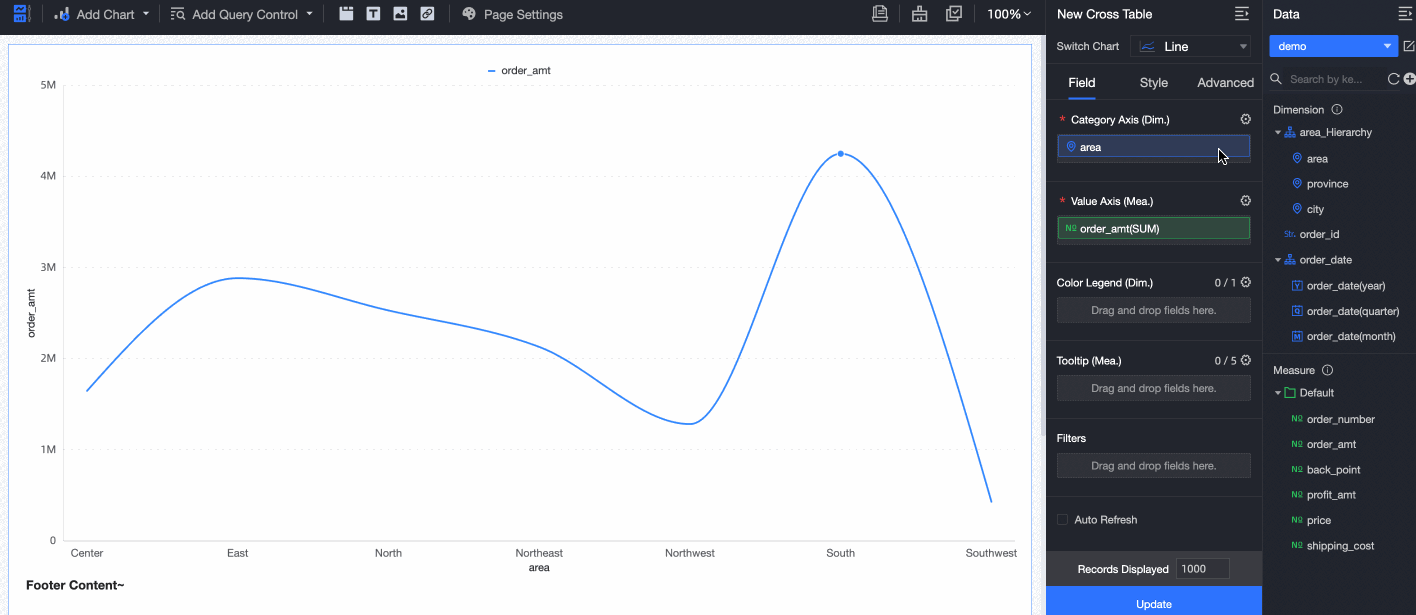
Learn how to configure the fields, styles, and advanced settings for a chart on a dashboard.
In the dashboard editor, use the Field tab to add dimension and measure fields to a chart and configure chart styles and advanced settings:
The available fields, style options, and advanced settings vary by data source and chart type, so the options you see may differ from those described in this topic.
Configure measures
This topic describes how to configure a measure field, using the order quantity field as an example:
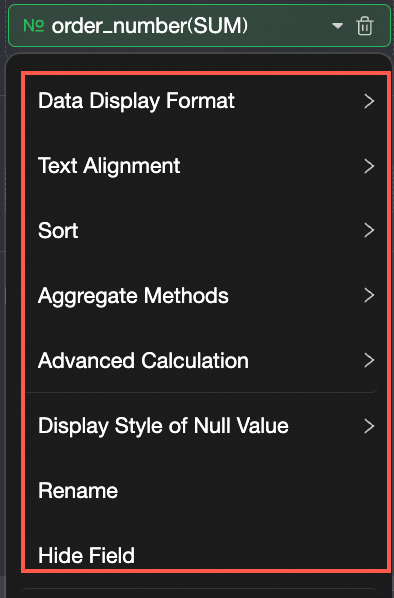
Move the pointer over the field and click the
 icon.
icon. 
Configure the following parameters based on your business requirements:
Data display format
Automatic
None (displays the raw value)
Integer
1 decimal place
2 decimal places
Percentage
1 decimal place (Percentage)
2 decimal places (Percentage)
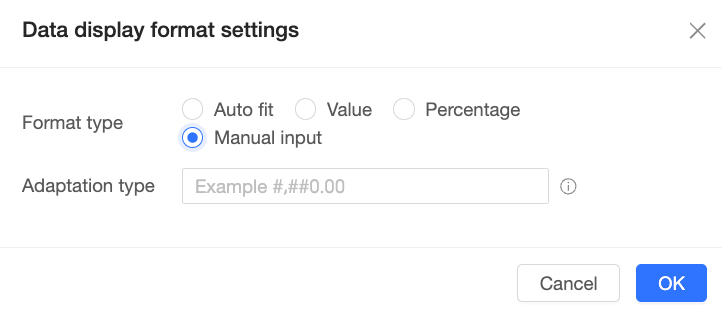
Custom
If the preset options are insufficient, select Custom for advanced settings. In the Data Display Format Settings dialog box, you can configure the format type and its parameters. The supported types are automatic adaptation, number, percentage, and manual input. The following table describes the settings for each type.
Format
Parameter
Description
Automatic adaptation
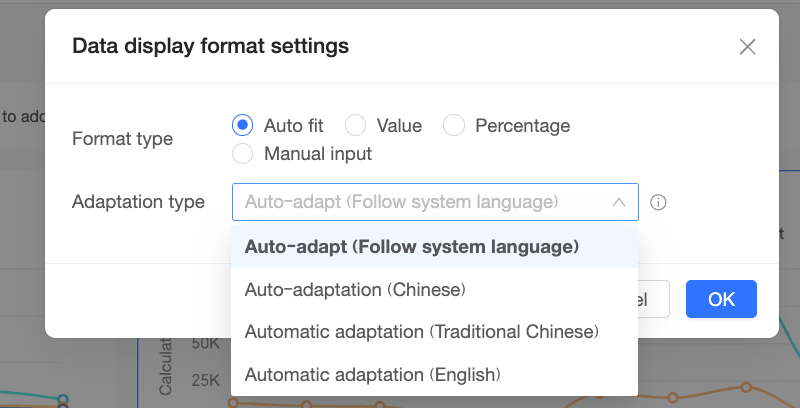
Adaptation mode
Supports automatic adaptation for different locales. You can set the format to adapt to Chinese, Traditional Chinese, or English, or select follow system language. The system automatically applies the appropriate numbering system for the selected language and dynamically adjusts decimal places to ensure a consistent layout.
Number
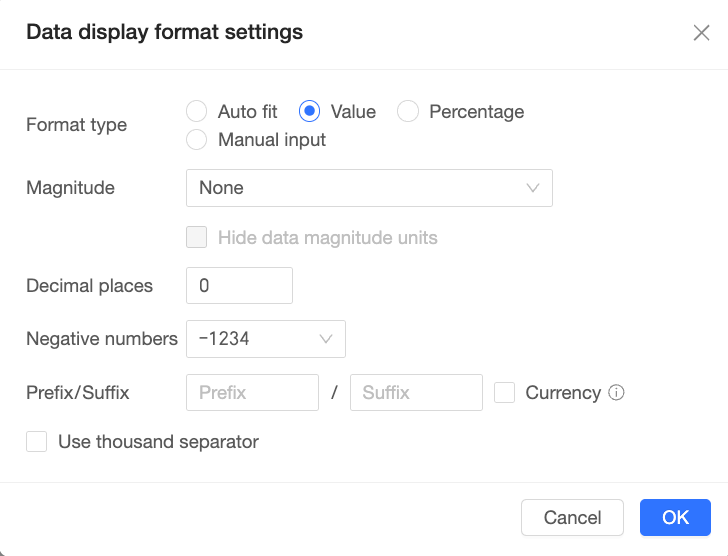
Magnitude
Sets the magnitude unit for the data. The default is None, which means no unit is added. You can select from options such as Automatic, Thousand, Ten thousand, Million, Ten million, Hundred million, K, k, M, mn, and bn.
NoteK and k represent thousands; M and mn represent millions; bn represents billions.
If you select Automatic, the system selects the most appropriate magnitude unit based on the actual value and system language. For example, it displays units such as "ten thousand" and "hundred million" in Chinese systems, and "K" and "M" in English systems.
Hide magnitude unit
Specifies whether to hide the magnitude unit. This option is unavailable when magnitude is set to None or Automatic.
Decimal places
Specifies the number of decimal places to display. You can enter an integer from 0 to 10.
Negative numbers
Specifies the display style for negative numbers. You can select one of the following options:
-1234: Displays numbers with a minus sign. This is the default option.
(1234): Displays numbers in parentheses.
Prefix/suffix
This setting adds text before and after the data. For example, if you set the prefix to "¥" and the suffix to "yuan", the data is displayed as "¥xxx yuan".
Currency symbol mode
Controls the position of the prefix for negative numbers. This option is available only when the negative number format is set to "-1234".
If this option is enabled, the prefix appears after the minus sign. For example: -¥5.
Use thousands separator
Specifies whether to insert a thousands separator in numbers.
If this option is selected, a separator is inserted every three digits.
Percentage
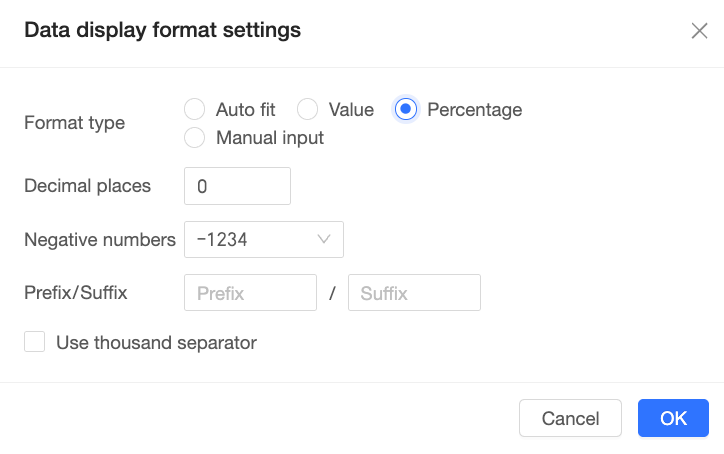
Decimal places
Specifies the number of decimal places to display. You can enter an integer from 0 to 10.
Negative numbers
Specifies the display style for negative numbers. You can select one of the following options:
-1234: Displays numbers with a minus sign. This is the default option.
(1234): Displays numbers in parentheses.
Prefix/suffix
Adds text before or after the data.
Use thousands separator
Specifies whether to insert a thousands separator in numbers.
If this option is selected, a separator is inserted every three digits.
Manual input
Format code
Manually enter a format code composed of special characters such as
0,#,,,.,E,%,‰,;, and'. For example:#,##0.00. The code length cannot exceed 50 characters.For more information about the syntax and features of manual input, see Manual input syntax and capabilities.
Alignment
Horizontal alignment: Automatic, Left, Center, Right.
Vertical alignment: Automatic, Top, Middle, Bottom.
Sort
No Sort, Ascending, Descending, Ascending Within Group, Descending Within Group, Advanced Sort.
Aggregation method
Supported methods include sum, average, count, distinct count, maximum, minimum, median, percentile, population standard deviation, sample standard deviation, population variance, sample variance, start point, and end point.
The following are use cases for the start point and end point aggregation methods:
Start point/End point:
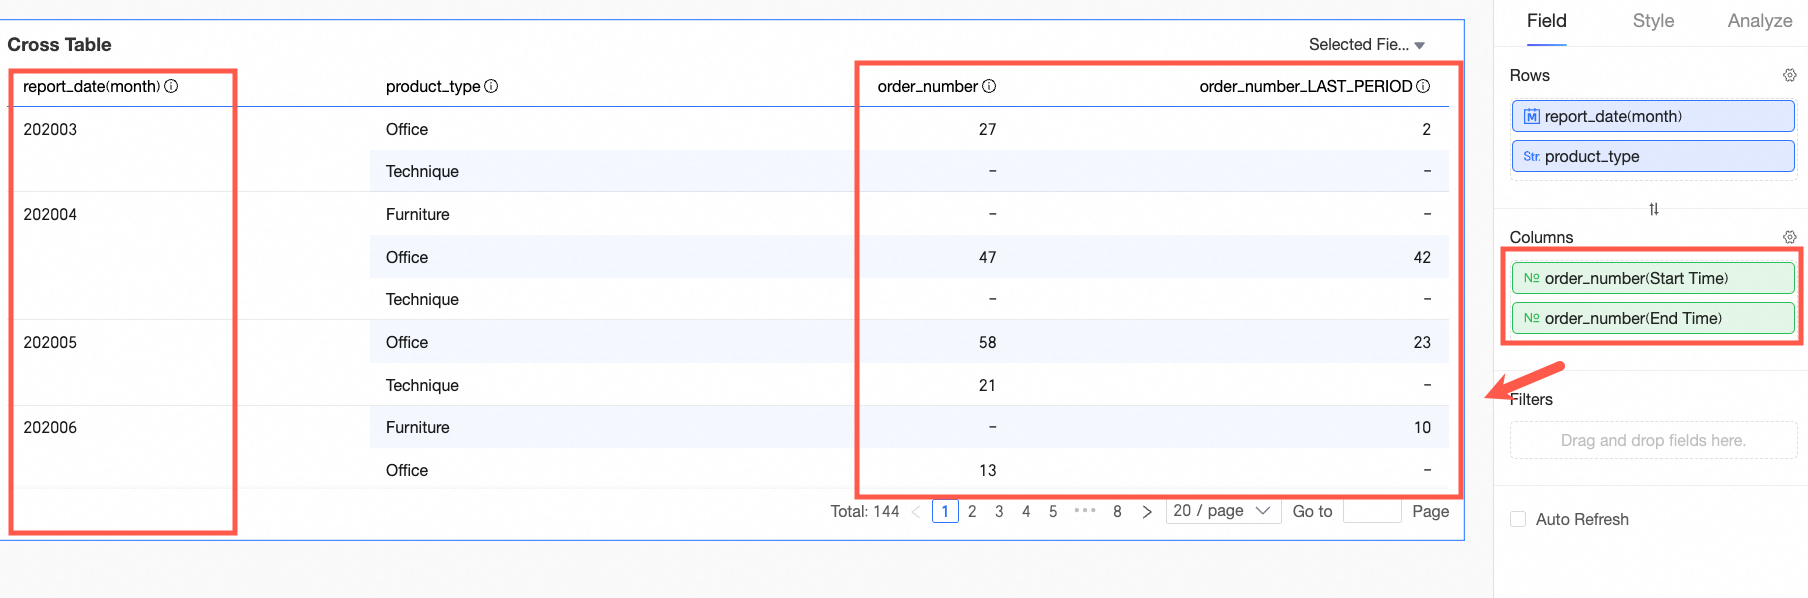
When analyzing monthly product order data, use start point and end point to view the values at the beginning and end of each time period, as shown in the figure.
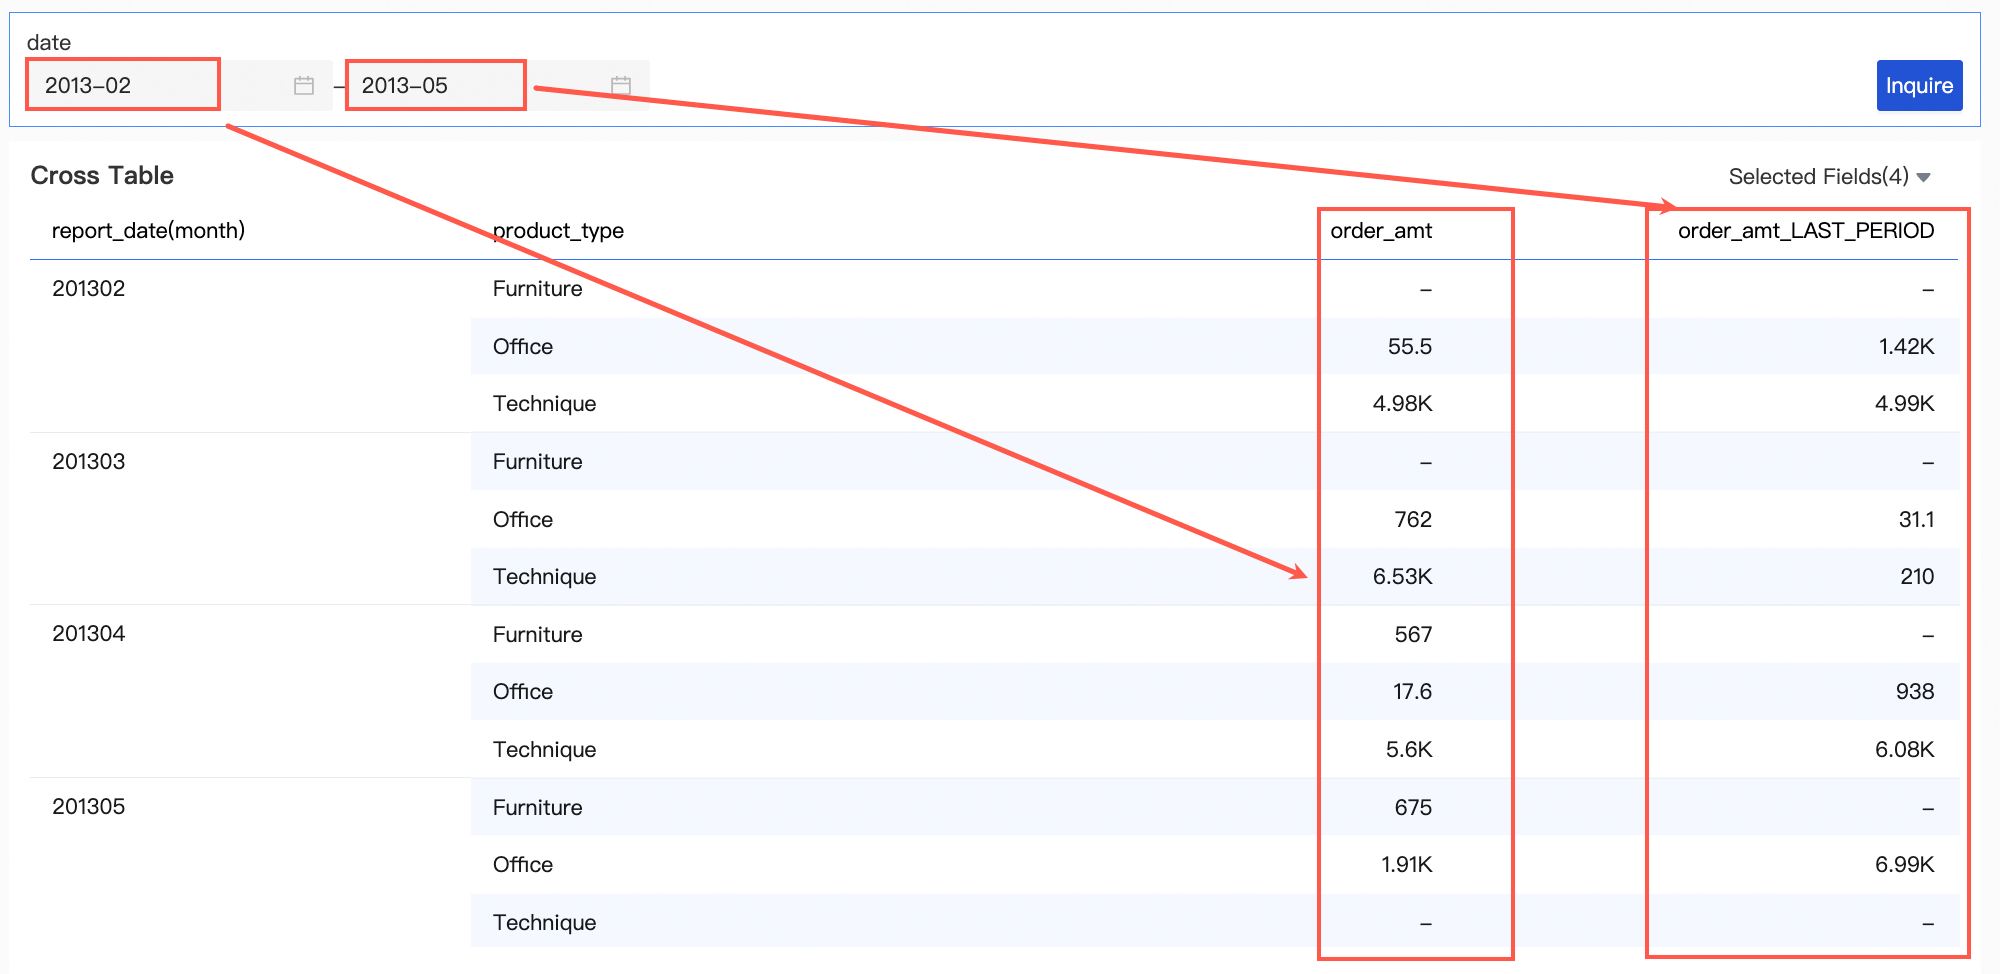
When using a query control for a specific time period, use start point and end point to view the values at the beginning and end of that period, as shown in the figure.
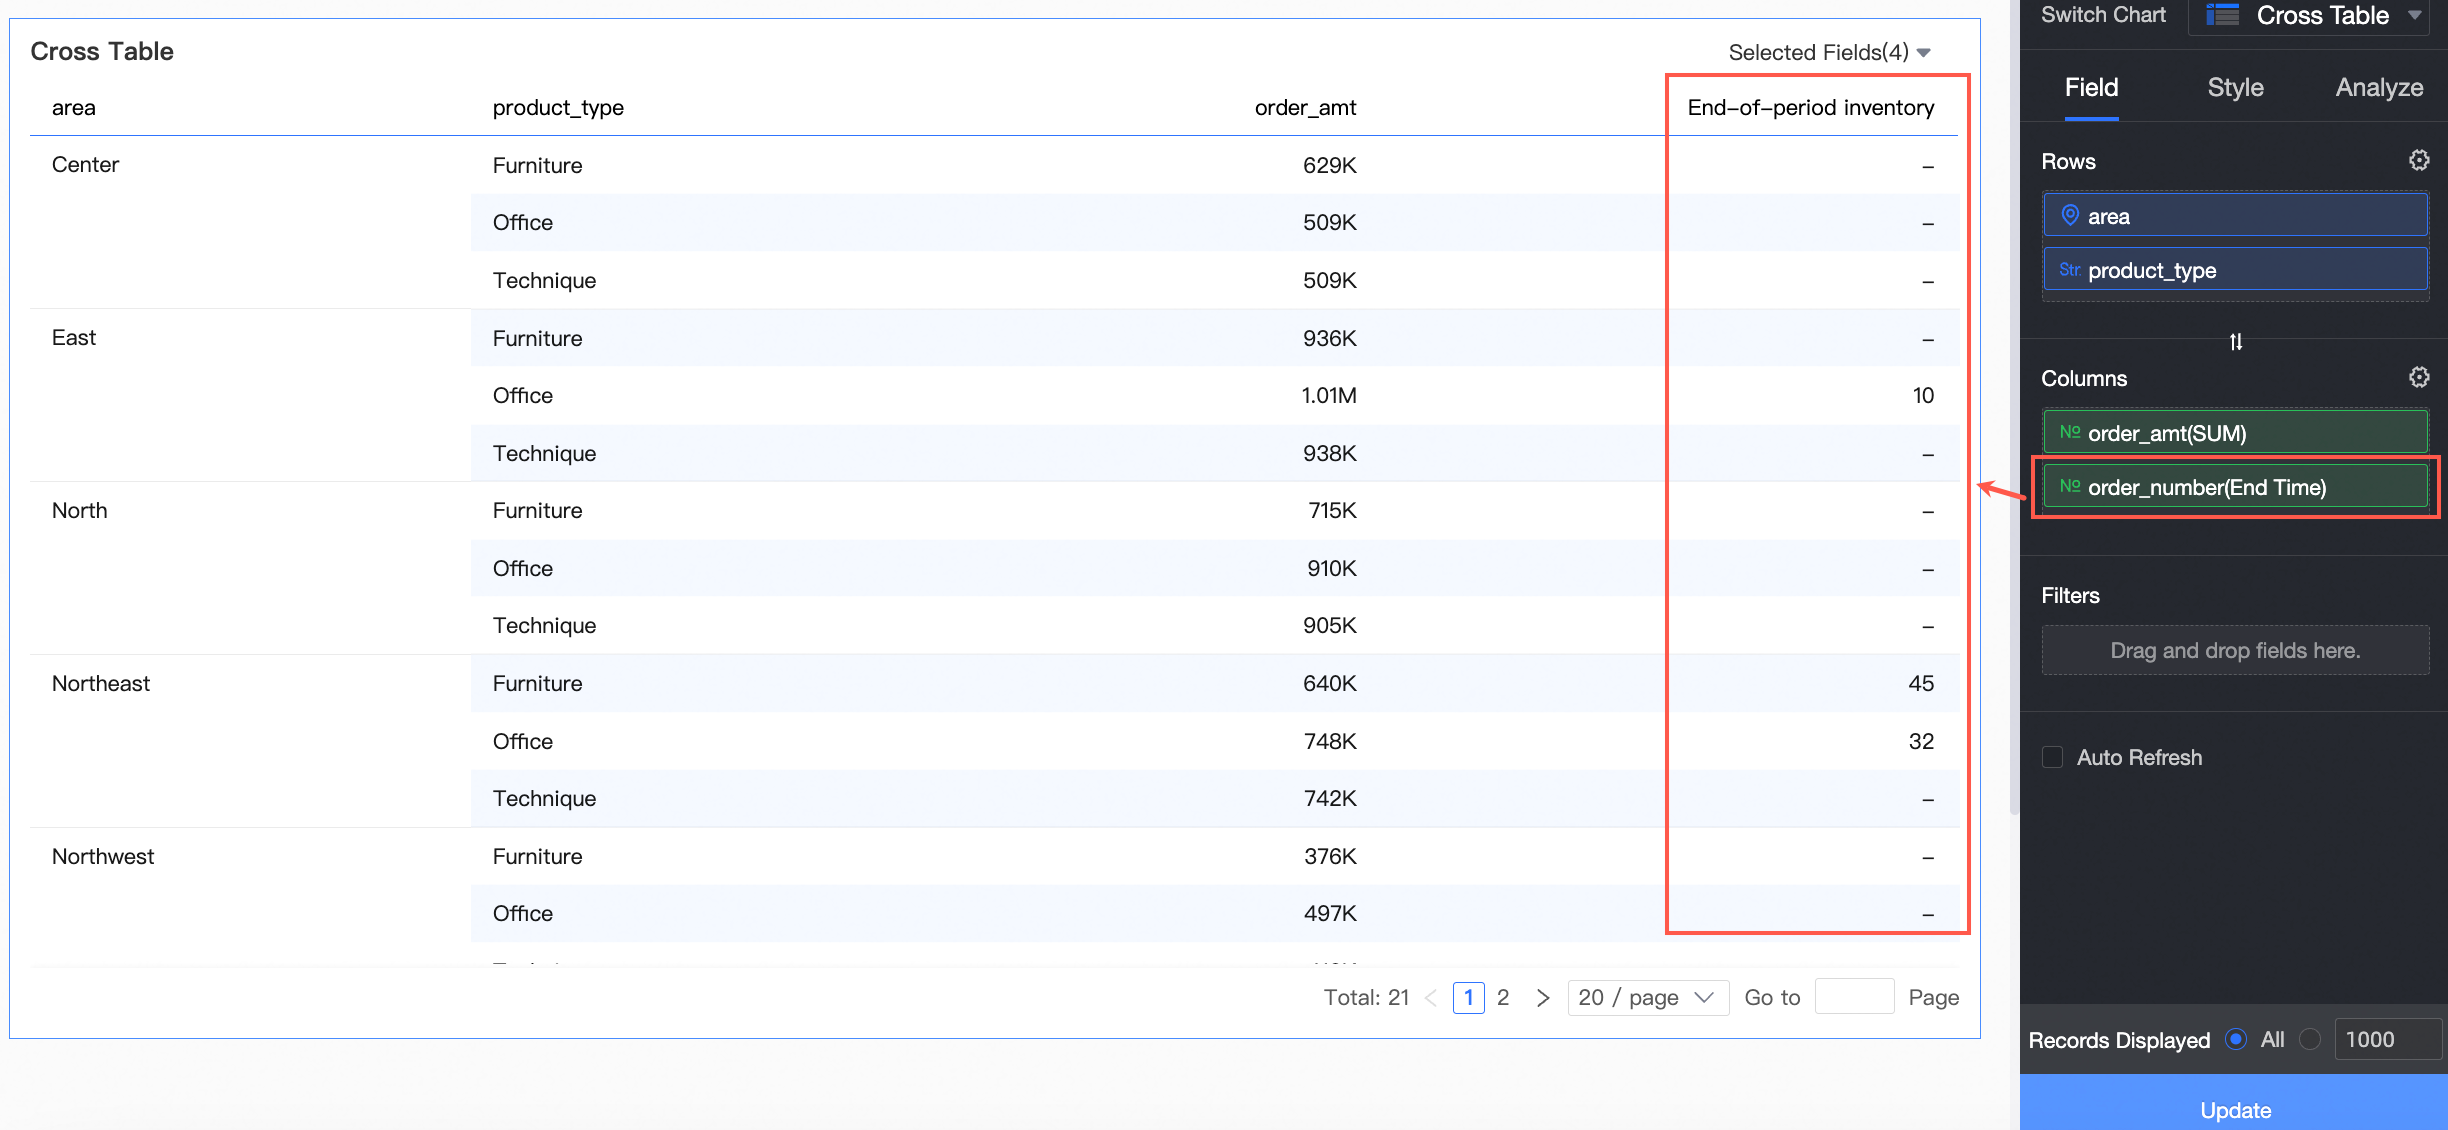
When you analyze inventory quantities for different product types in each region and need to view the inventory quantity at the final order time, set the field's aggregation method to end point, as shown in the figure:
The following table describes the aggregation methods supported by different data sources.
Data source
Aggregation method
All data sources supported by Quick BI
sum, average, count, distinct count, maximum, minimum, start point, and end point.
MySQL, Vertica, SAP IQ (Sybase IQ), SQL Server, Presto, Alibaba Cloud PolarDB for Oracle, PostgreSQL, Oracle, MaxCompute, Hive, SAP HANA, AnalyticDB for PostgreSQL, Gbase, IBM DB2 for LUW, Clivia, ClickHouse, and AnalyticDB for MySQL V2.0
population standard deviation, sample standard deviation, population variance, and sample variance
SAP IQ (Sybase IQ), Oracle, MaxCompute, SAP HANA, and IBM DB2 for LUW
median
SAP IQ (Sybase IQ), Oracle, MaxCompute, SAP HANA, and IBM DB2 for LUW
percentile
Advanced calculation
Date accumulation: Calculates the sum of data from an initial date to the current date. For more information, see Date accumulation.
Cumulative calculation: Calculates a running total from the results returned by the database, allowing you to observe the incremental increase of a measure. For more information, see Cumulative calculation.
NoteThe measure field cannot have the comparison feature enabled.
Only measure fields aggregated by sum (
 ) support cumulative calculation.
Cumulative calculation is supported only if the report's dimensions include exactly one date field with a granularity of year, quarter, month, week, or day.
Percentage
% of Grand Total
% of Column Grand Total
% of Row Grand Total
% of Parent Column Grand Total
% of Parent Row Grand Total
The percentage feature is supported only in cross tables. For more information, see New cross table.
Ranking
Ascending
Descending
Ascending Within Group
Descending Within Group
None
For more information, see Data ranking.
TopN
TopN (quick filter) selects the top or bottom N records from the database results based on their value.
For more information, see TopN.
Percentile
Calculates the percentile rank for each result returned from the database, showing where a data point falls within the entire dataset.
For more information, see Percentile.
Comparison
The available values vary based on the dimension fields. For more information, see Comparison.
None
Null value display style
Specifies how null values are displayed.
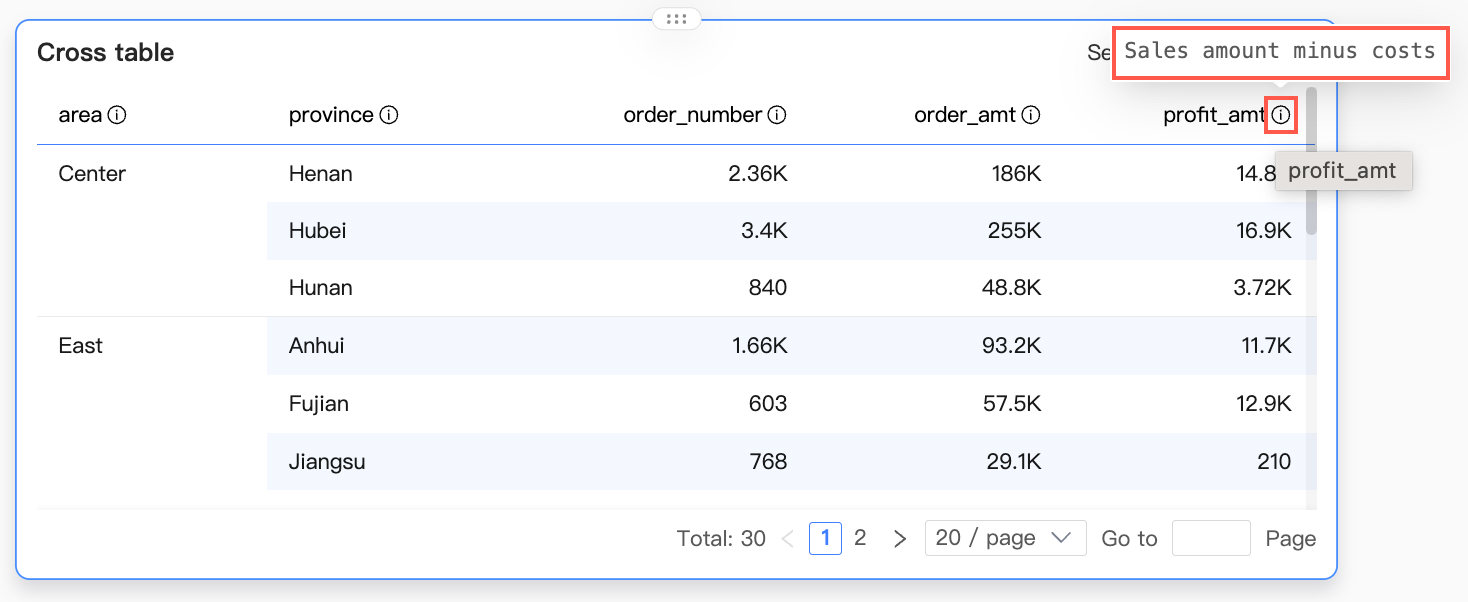
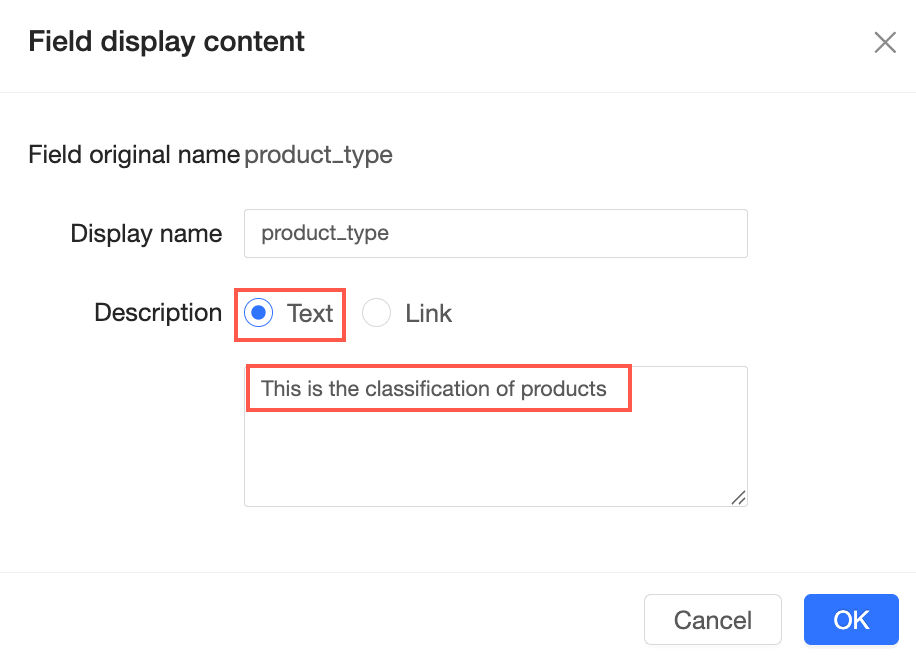
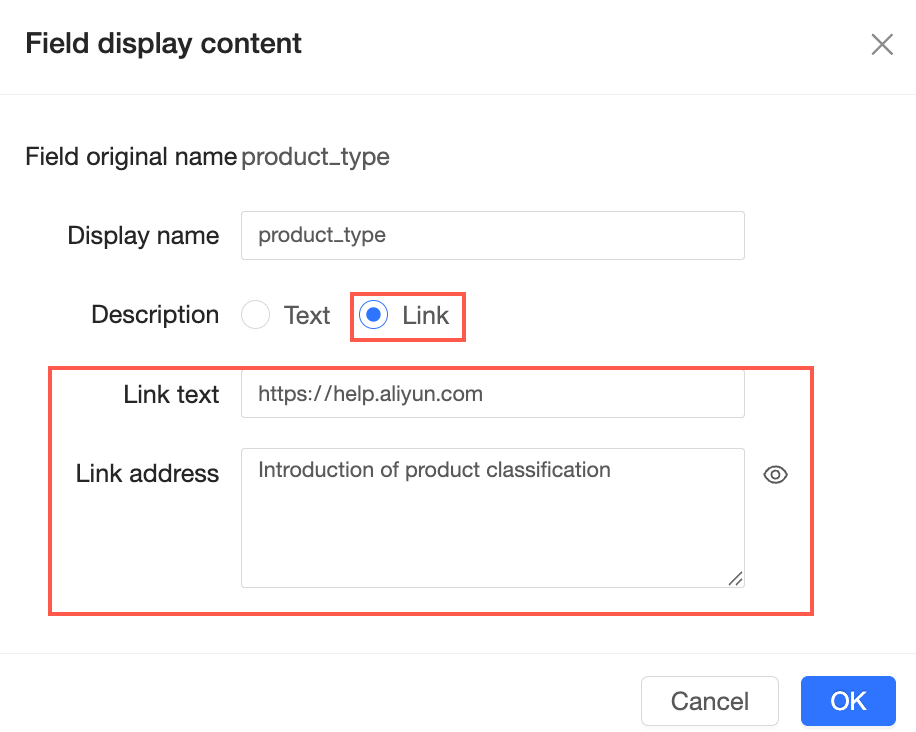
Field display content
Configure the display name and field description.
Display name: The name of the field as it appears in the chart.
Field description: An explanation or note for the field.
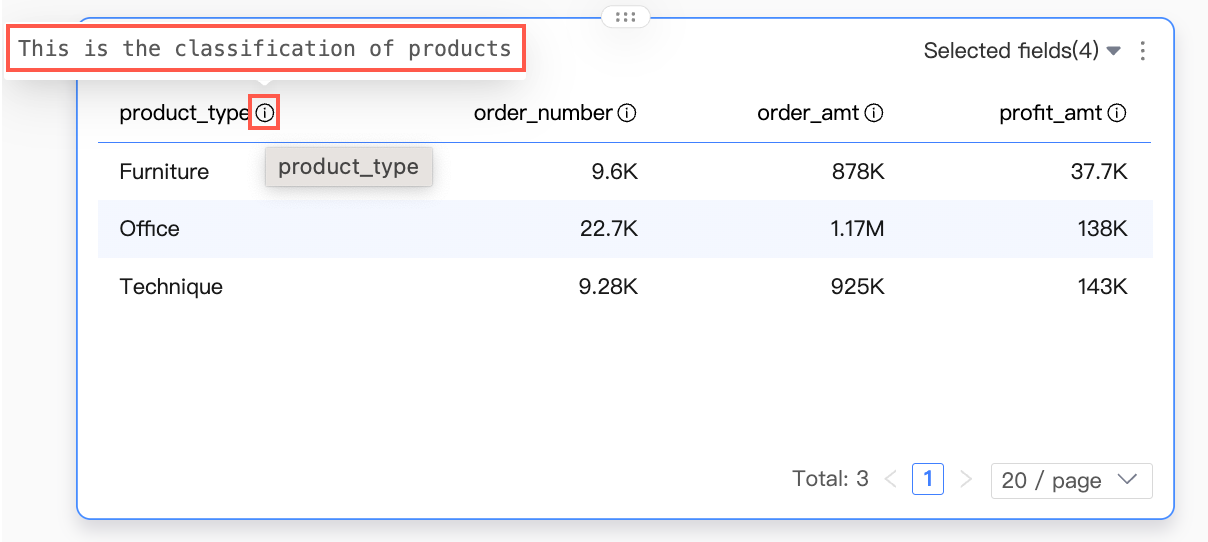
For text, you can enter a description.
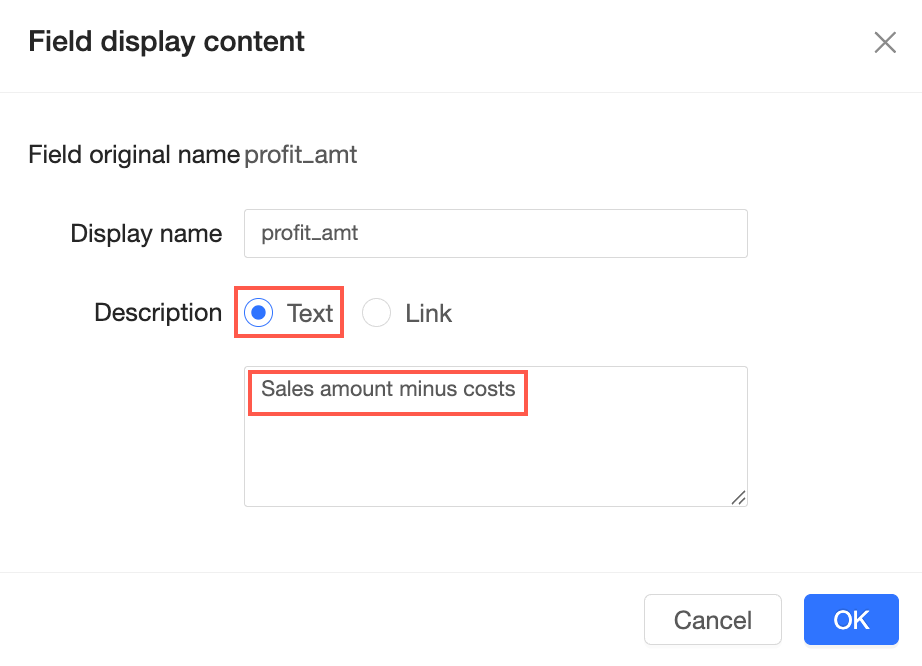
Once configured, you can view the description by clicking the icon next to the field name.
For a link, you can configure the link text and URL.
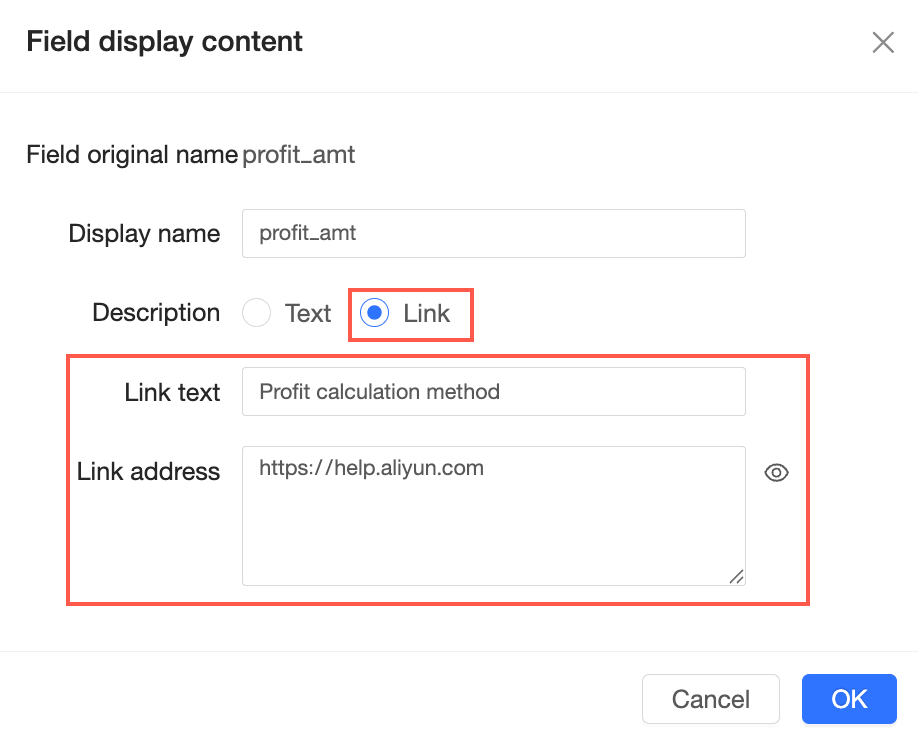 Click the
  icon to access the link.
 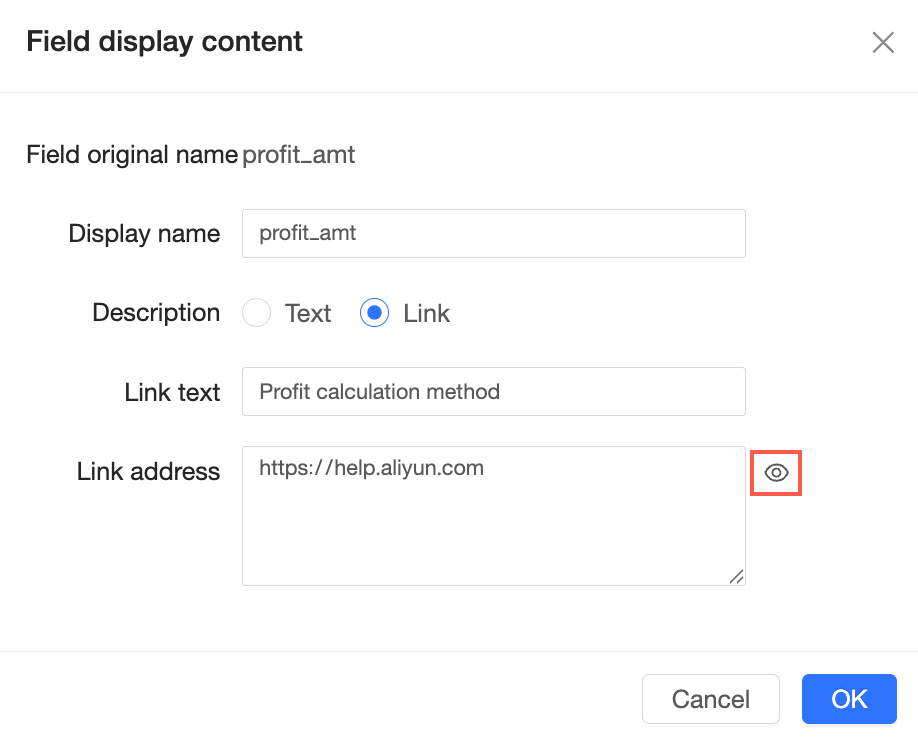 Once configured, clicking the icon next to the field name opens the link.
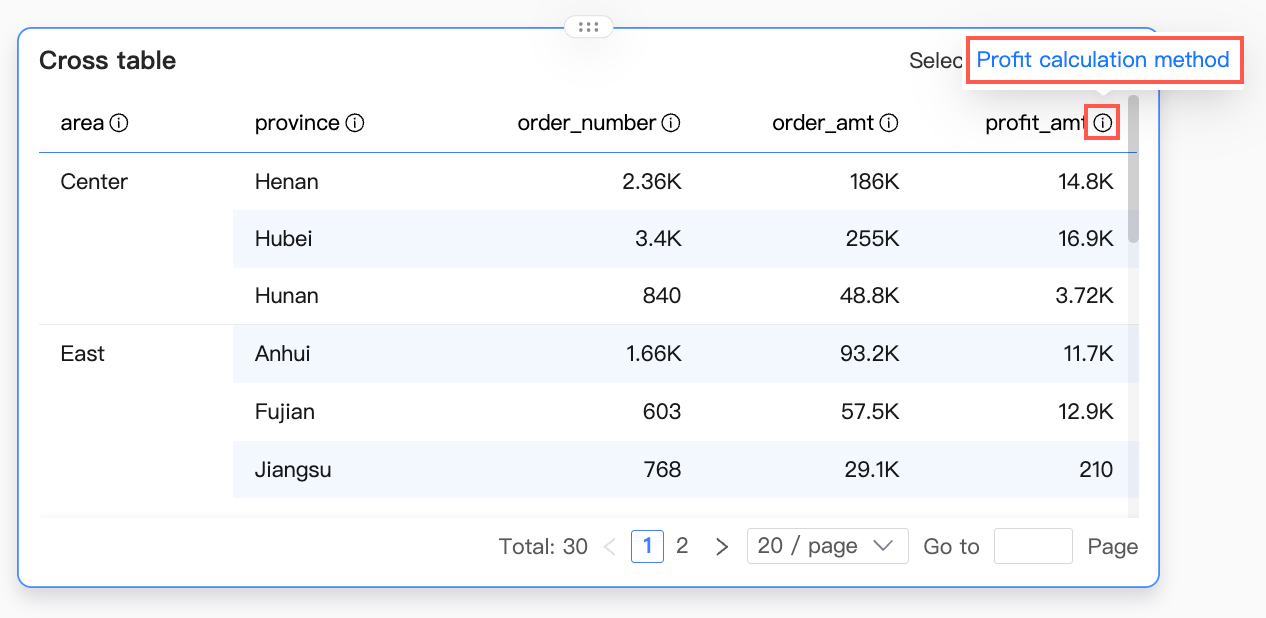
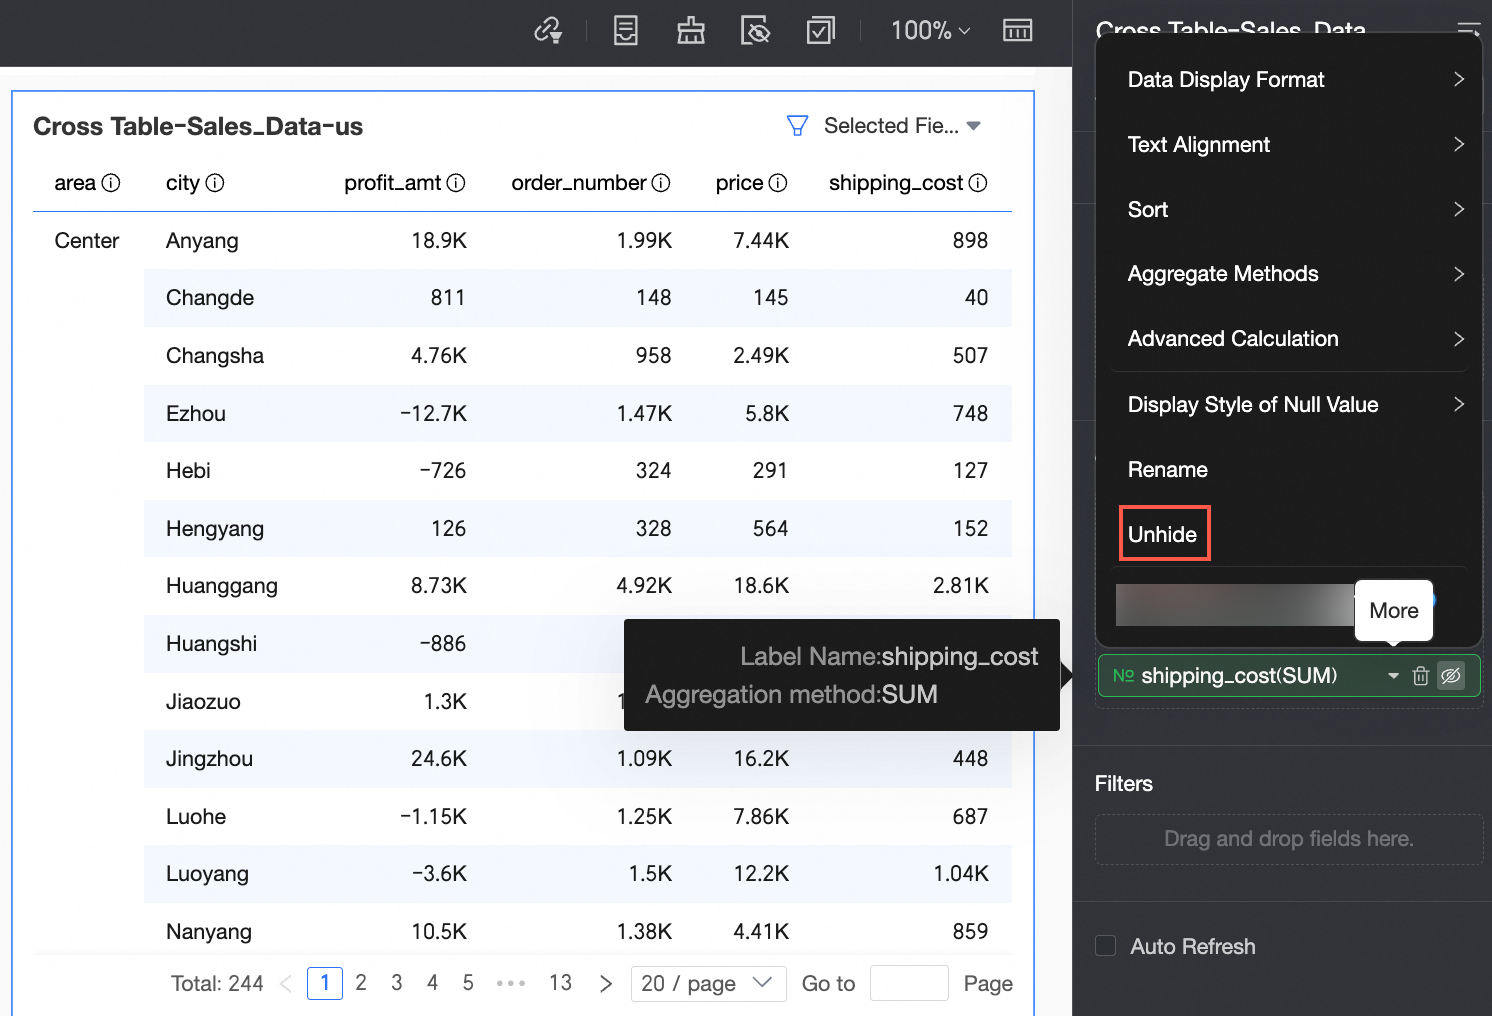
Hide field
A hidden field does not appear in the report. You can also unhide it.
Delete field
Hover over the measure field and click the
 icon on the right.
Configure dimension fields
Text fields
This example shows how to configure the product_type field as a dimension field.
Move the pointer over the field and click the
 icon.
icon. 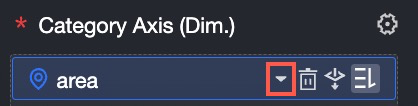
Configure the Sort parameter based on your business requirements. Valid values:
Alignment
Horizontal alignment: Automatic, Left, Center, Right.
Vertical alignment: Automatic, Top, Middle, Bottom.
Sort
Unsort, ascending, descending, ascending within group, descending within group, Custom, Field Sort, Advanced Sort.
If you select Custom, you can drag the target field to a specified area.
Advanced calculation
None, TopN.
For more information, see TopN.
Null value display style
Sets the display format for null values or empty strings.
Null value:
Display as '-'
Empty string:
Display as '-'
Field display content
Sets the display name and field description.
Display Name: The name of the field as it appears in the chart.
Field Description: Content that explains or provides notes for a field. You can use text or a link.
For text, you can enter a description.
Once configured, you can view the description by clicking the icon next to the field.
For a link, you can configure the link text and URL.
 Click the icon to visit the link.
 Once configured, you can click the icon next to the field to open the link.
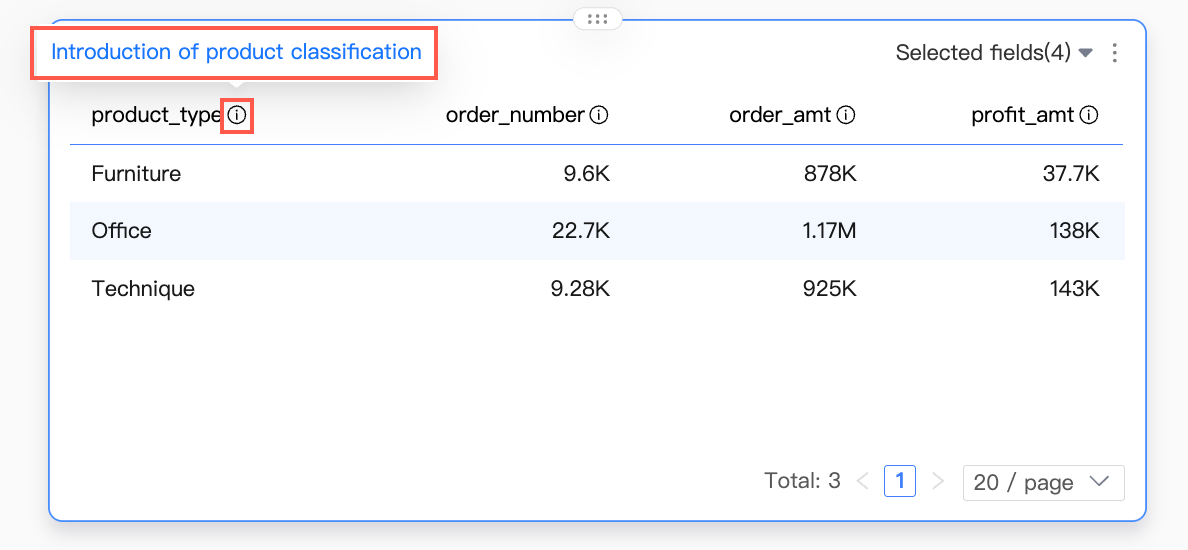
Hide field
If you hide a field, it will not appear in the report. You can also unhide the field.
To drill down into a dimension field:
Move the pointer over the field and click the
 icon.
icon. Delete the dimension field.
Move the pointer over the field and click the
 icon.
icon.
Date fields
For date-type fields, you can also configure the date display format in addition to the settings described above. This section uses the order date (day) field as an example:
Move the pointer over the field and configure the date display format for the field by following instructions shown in the following figure.
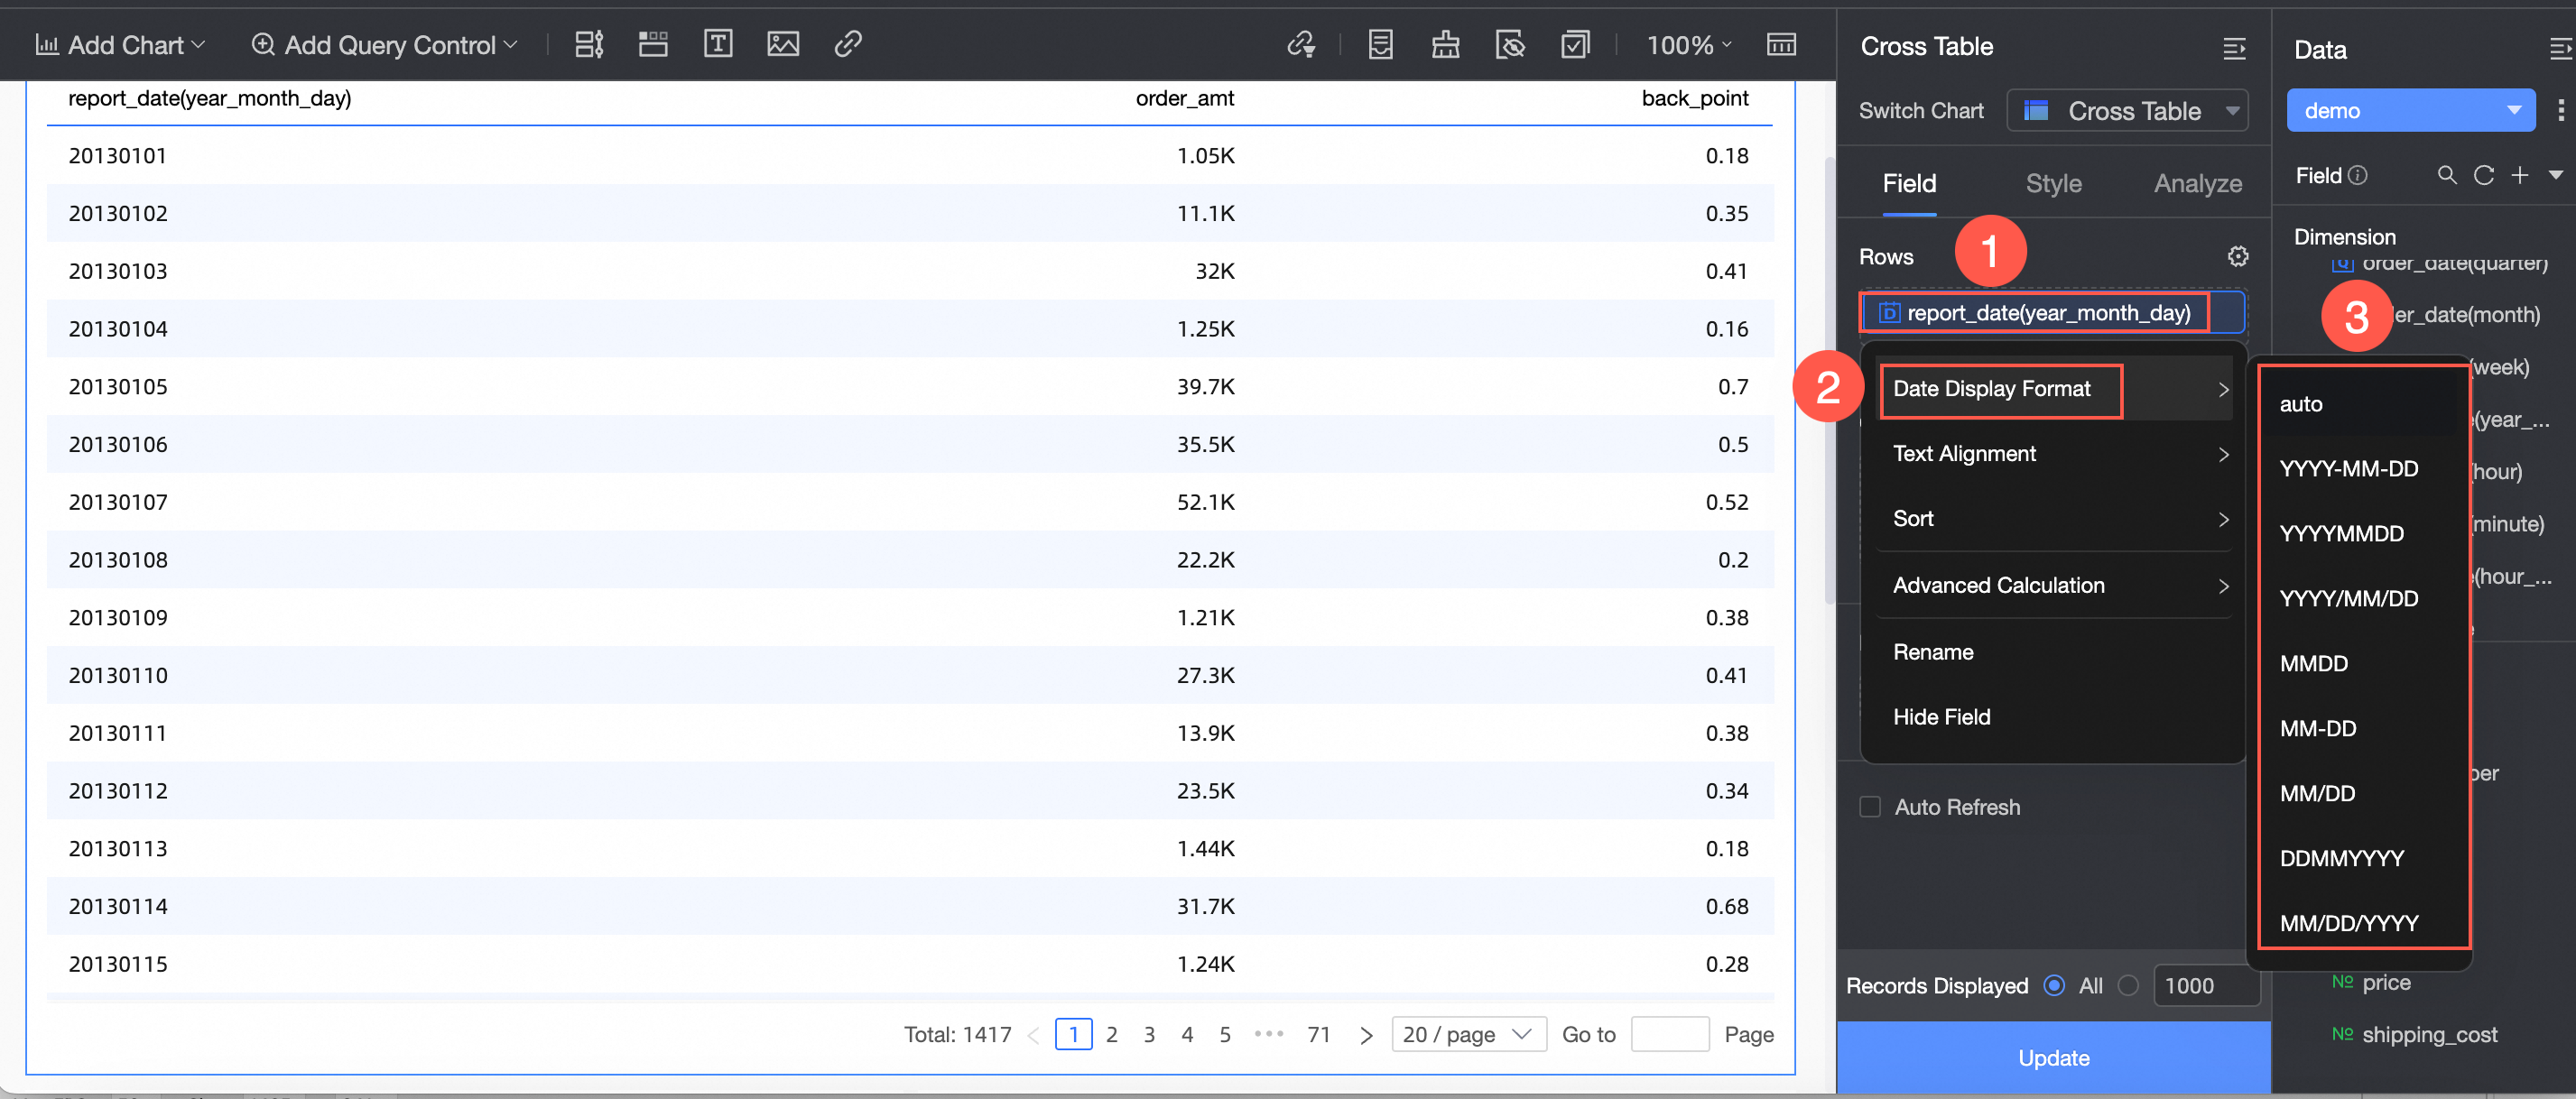
Configuration effect
Custom format syntax
When setting the data display format, you can enter a custom format code. The following table describes the special characters used for formatting.
Symbol | Name | Description |
| Digit placeholder (zero padding) | If a digit is missing from a position defined in the pattern, a Indicates at least three digits. The value is padded with leading zeros if it has fewer than three digits. |
| Digit placeholder (optional digit) | Displays a digit if one exists in the position; otherwise, nothing is displayed. This placeholder does not pad with zeros. |
| Decimal point | Separates the integer and fractional parts of a number. A period ( |
| Thousands separator | Inserts a separator every three digits (for example, 1,000,000). Note: This is a grouping separator, not a decimal point. |
| Scientific notation | Displays numbers in scientific notation. The letter E must be followed by at least one |
| Percentage | Multiplies the value by 100 and adds a |
| Per mille | Multiplies the value by 1,000 and adds a ‰ symbol. Multiple consecutive ‰ characters (for example, ‰‰) are not supported. |
| Positive/negative separator | Separates the pattern into two sections: the first for positive numbers and zero, and the second for negative numbers. |
| Quote | Encloses literal text to display it as-is. |
Any characters that are not special formatting symbols (such as letters or parentheses) are treated as literal text and displayed as-is. To display a special formatting symbol as a literal character, enclose it in single quotes.
Details and examples
Digit placeholders: 0 and #
The difference between them is their padding rules:
0forces a digit to be displayed and pads with zeros if necessary. It is suitable for fixed-length display scenarios, such as IDs or when zero-padding is required.#displays only significant digits and omits unnecessary zeros. It is suitable for dynamic display scenarios where you want to avoid extra zeros.
Do not insert any characters other than
.,,, orEbetween#and0. Other characters are treated as literal text and appended to the number.When
#and0are used together: in the integer part,0must be to the right of#; in the fractional part,0must be to the left of#.
Pattern | Input | Output | Description |
|
|
| Pads with leading zeros to meet the three-digit length. |
|
|
| Does not pad with zeros. |
|
|
| Displays at least one integer digit and rounds to two decimal places, padding with zeros if necessary. |
|
|
| Displays at least one integer digit and rounds to a maximum of two decimal places, omitting trailing zeros. |
|
|
| Forces the display of two decimal places. |
|
|
| Pads the integer part to 4 digits and the fractional part to 3 digits. |
Thousands separator: ,
Pattern | Input | Output | Description |
|
|
| Adds a thousands separator. |
|
|
| Commonly used for currency. |
|
|
| Groups digits by thousands and rounds to the nearest integer. |
Decimal point: .
Pattern | Input | Output | Description |
|
|
| Fixed at two decimal places. |
|
|
| Maximum of four decimal places, omitting trailing zeros. |
Scientific notation: E
Pattern | Input | Output | Description |
|
|
| Scientific notation with an integer exponent. |
|
|
| Exponent with at least two digits. |
|
|
| Adjusts decimal places and the exponent. |
Percentage: %
Pattern | Input | Output | Description |
|
|
| Displays as a percentage with an integer value. |
|
|
| Displays as a percentage with two decimal places. |
Multiple consecutive % characters (for example, %%) are not supported.
Per mille: ‰
Pattern | Input | Output | Description |
|
|
| Displays as per mille with an integer value. |
|
|
| Displays as per mille with two decimal places. |
Multiple consecutive ‰ characters (for example, ‰‰) are not supported.
Positive/negative separator: ;
Pattern | Input | Output | Description |
|
|
| Positive number is displayed normally. |
|
| The minus sign for the negative number is replaced by ▼. | |
|
|
| Custom prefixes for positive and negative numbers. |
|
|
Empty sections before or after the ; are not supported. For example, ;0.00m is invalid.
Single quote: '
Pattern | Input | Output | Description |
|
|
| Inserts a literal text prefix. |
|
|
| Escapes a special symbol to display it as a literal character. |
If the text you want to display contains special formatting characters (such as #, 0, ., or ,), failing to enclose them in single quotes can cause parsing errors or unexpected results. We recommend that you always enclose literal text in single quotes to ensure it is rendered correctly.
Quick reference
Requirement | Recommended pattern |
Two decimal places |
|
Thousands separator + two decimal places |
|
Percentage (two decimal places) |
|
Scientific notation |
|
Negative numbers in parentheses |
|
Display units (for example, CNY, m) |
|
Fixed-width zero padding (for example, 5-digit padding) |
|
Optional decimals (up to 4 places) |
|