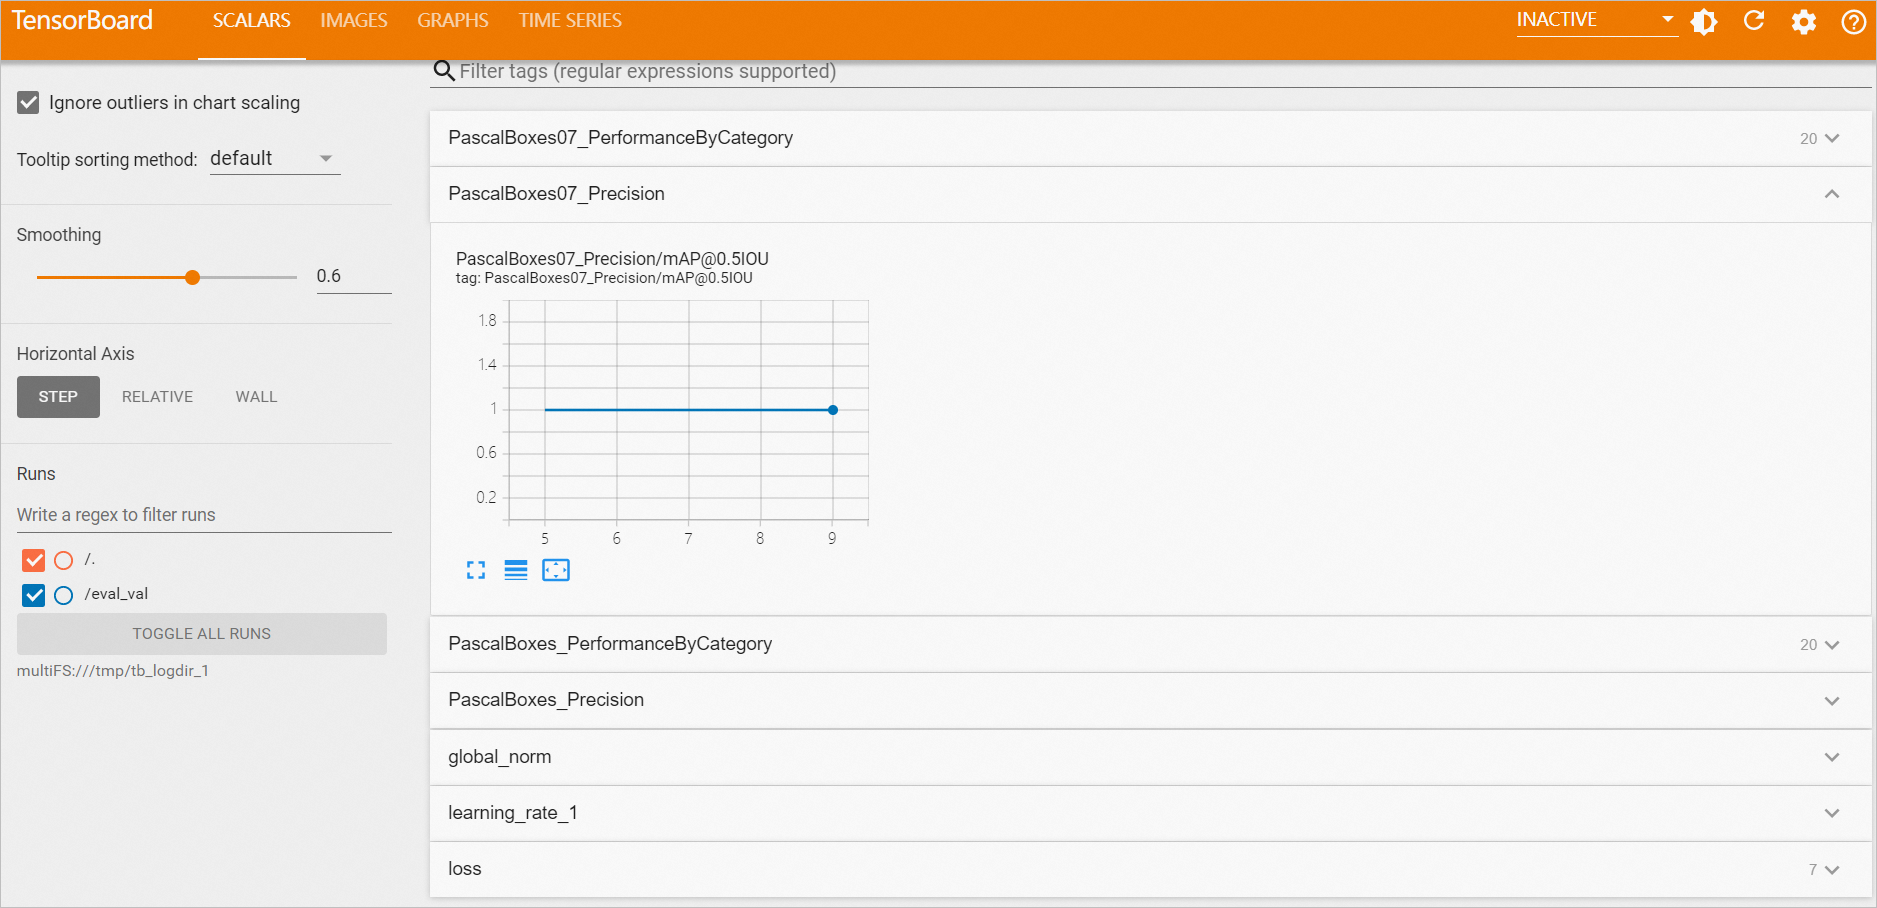
PAI Designer includes two visualization tools — the dashboard and TensorBoard — to help you inspect data analysis results and model training runs directly from the workflow canvas.
For standalone TensorBoard instances outside a workflow, see Manage TensorBoard instances.
Dashboard vs. TensorBoard
Choose the tool that matches your goal:
| Dashboard | TensorBoard | |
|---|---|---|
| Purpose | Visualize business data: data analytics results, business metrics, and real-time monitoring | Visualize the model training process: understand, debug, and optimize models |
| Features | Various chart types with a drag-and-drop interface for interactive data dashboards | Visualize loss function curves, accuracy curves, model structures, parameter distributions, and learning rate changes |
| Scenarios | Enterprise-level data analytics, operational monitoring, and business reporting | Monitoring deep learning model training, analyzing model performance, and comparing experiments |
| Supported algorithm components | Data visual analytics: Correlation Coefficient Matrix, Histogram, scatter chart, box plot chart, Data View<br><br>Feature engineering: Linear model feature importance, Random forest feature importance evaluation<br><br>Model evaluation: Confusion matrix, Clustering model evaluation, Multiclass classification evaluation, Binary classification evaluation<br><br>Model visualization: GBDT Binary Classification, GBDT Regression, Random Forest, XGBoost Training<br><br>Statistical analysis: Percentile, Lorenz Curve | Deep learning: TensorFlow (CPU)<br><br>Visual algorithms: Image classification training (torch), Object detection training (easycv), Image segmentation training (easycv) |
View analysis reports on the dashboard
Create a workflow and run it. After the workflow completes, open the dashboard using either of the following methods:
-
View all components: Click
 above the canvas to view visualizations for all components in the current workflow that support the dashboard. The following screenshot uses the Heart Disease Prediction preset template as an example.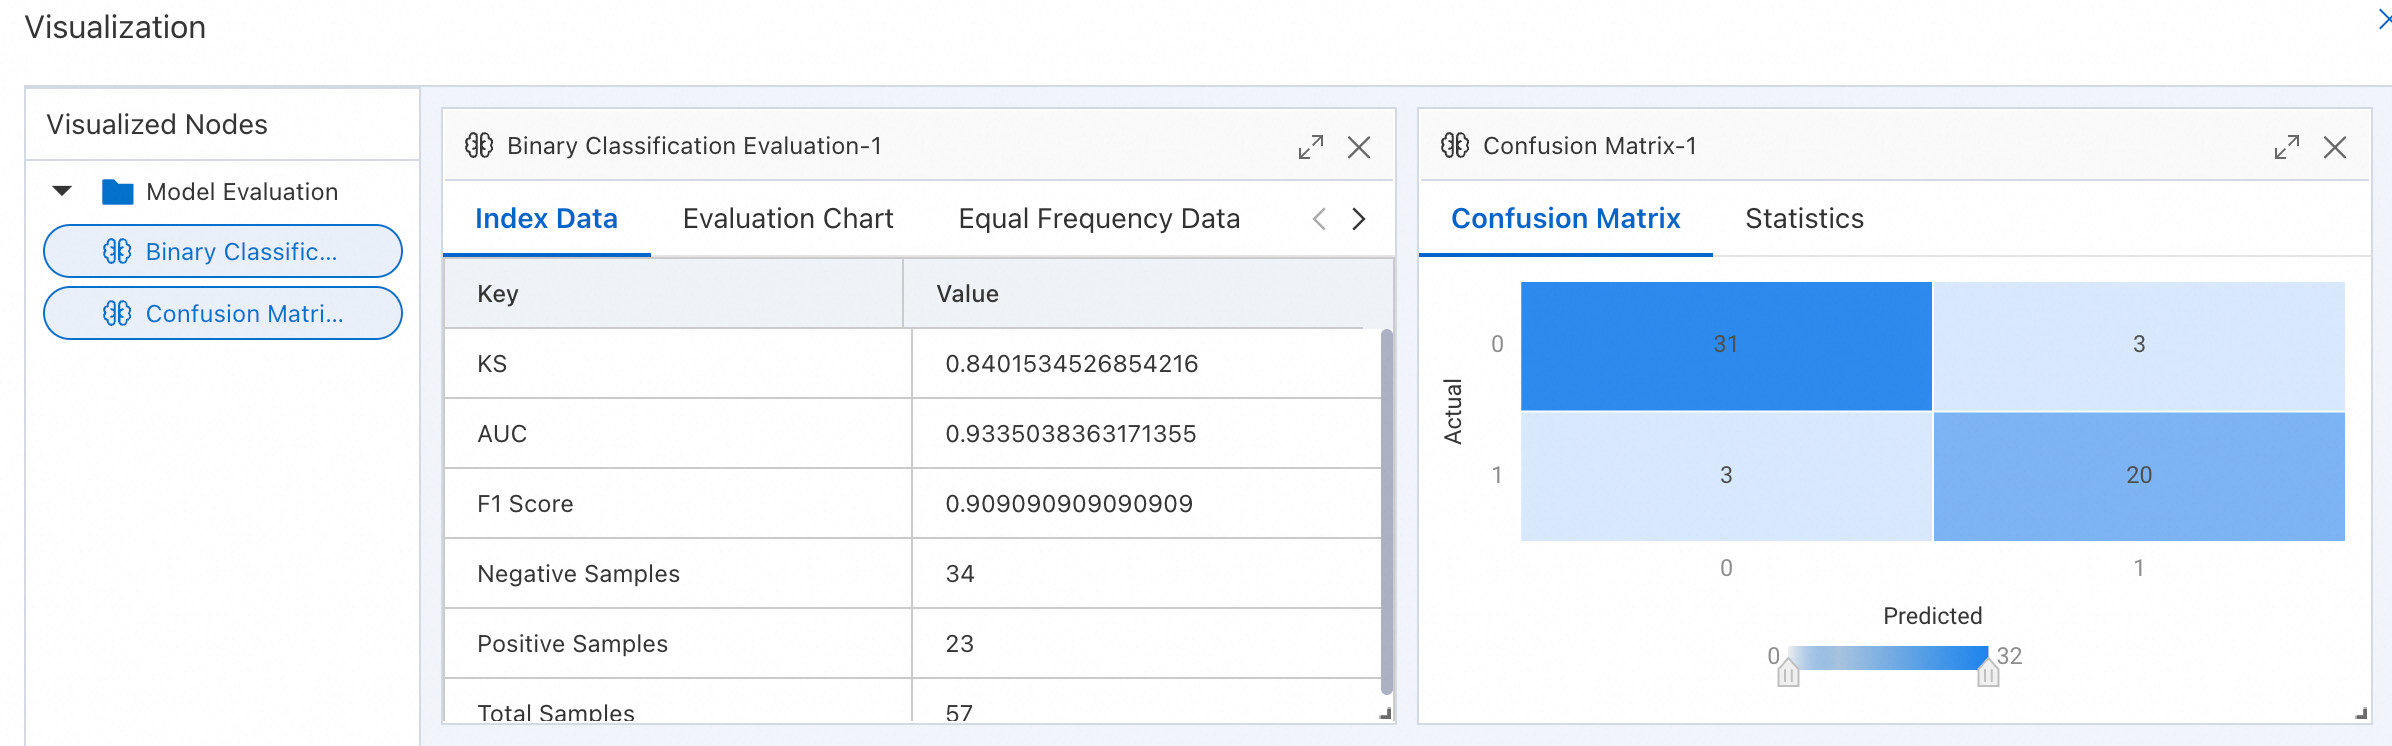
-
View a single component: Right-click the target component (such as Confusion Matrix or Binary Classification Evaluation) and select Visual Analysis.
View model training results on TensorBoard
Prerequisites
-
A workflow that includes at least one component that supports TensorBoard. For the full list, see Dashboard vs. TensorBoard.
Start TensorBoard
-
Create a workflow using components that support TensorBoard, and configure the Pipeline Data Storage path. TensorBoard renders the path determined by the algorithm's logic and automatically retrieves the pipeline's data storage path on startup.
If the Pipeline Data Storage path changes after you start TensorBoard, right-click the TensorBoard visualization node and select Run This Node, then start TensorBoard again. The system deletes the running TensorBoard instance and starts a new one based on the updated storage path.
-
Configure the workflow components as needed and run the workflow.
If the TensorBoard visualization component is Object Detection Training (easycv), set the Model Type parameter to YOLOX. Only YOLOX models currently support metric collection for TensorBoard.
-
After the workflow completes, right-click the TensorBoard visualization component and select View TensorBoard.
-
Click Start TensorBoard.