In machine learning, the data pivoting algorithm is a method for dataset visualization and exploratory data analysis. It uses charts, tables, and other visualization tools to reveal the data's structure, distribution, and relationships, helping users understand features, identify patterns, and discover anomalies. This algorithm is crucial during the data preprocessing and feature engineering stages, as it guides subsequent modeling and analysis.
Component configuration
Method 1: Use the console
In Machine Learning Designer, add the Data Pivoting component to a pipeline and configure its parameters in the pane on the right.
|
Parameter type |
Parameter |
Description |
|
Fields Setting |
Feature Columns |
Specifies the feature columns to use for visualization and analysis. The component then displays their distributions and relationships in charts or tables. |
|
Target Column |
Specifies the target variable, which is typically a label or response variable, for prediction or analysis. |
|
|
Enumeration Features |
Treats the selected features as enumeration features. |
|
|
k:v,k:v sparse data format |
Specifies whether to use sparse data in key-value format. |
|
|
Parameter Settings |
Number of bins for continuous features |
Specifies the number of discrete intervals (bins) to divide continuous features into for visualization and analysis. |
|
Tuning |
Number of cores |
The number of cores for computation. The value must be a positive integer. |
|
Memory per core |
The amount of memory for each core, in MB. The value must be an integer from 1 to 65536. |
Method 2: Use PAI commands
You can configure the parameters of the Data Pivoting component by running a PAI command in an SQL Script component. For more information, see Scenario 4: Execute PAI commands in the SQL Script component.
PAI
-name fe_meta_runner
-project algo_public
-DinputTable="pai_dense_10_10"
-DoutputTable="pai_temp_2263_20384_1"
-DmapTable="pai_temp_2263_20384_2"
-DselectedCols="pdays,previous,emp_var_rate,cons_price_idx,cons_conf_idx,euribor3m,nr_employed,age,campaign,poutcome"
-DlabelCol="y"
-DcategoryCols="previous"
-Dlifecycle="28"-DmaxBins="5" ;|
Parameter |
Required |
Default |
Description |
|
inputTable |
Yes |
None |
The name of the input table. |
|
inputTablePartitions |
No |
None |
The partitions of the input table to use for training. The following formats are supported:
Note
To specify multiple values for a single partition key, separate the values with a comma (,), for example, name1=value1,value2. |
|
outputTable |
Yes |
None |
The name of the output table. |
|
mapTable |
Yes |
None |
The output mapping table. To prepare data for machine learning training, Data Pivoting collects statistics for STRING features and maps them to integer IDs (label encoding). |
|
selectedCols |
Yes |
None |
The names of the columns to select from the input table. |
|
labelCol |
No |
None |
The label column. |
|
categoryCols |
No |
None |
Specifies numeric (INT or DOUBLE) columns to treat as enumeration features. |
|
maxBins |
No |
100 |
Specifies the maximum number of intervals for equal-distance discretization of continuous features. |
|
isSparse |
No |
false |
Specifies whether the input data is in a sparse format. The valid values are true and false. |
|
itemSpliter |
No |
A comma (,) |
Specifies the delimiter that separates key-value pairs if the input data is in a sparse format. |
|
kvSpliter |
No |
A colon (:) |
Specifies the delimiter that separates keys and values if the input data is in a sparse format. |
|
lifecycle |
No |
28 |
The lifecycle of the table. |
|
coreNum |
No |
System-determined |
The number of CPU cores to use for the job. Must be a positive integer. Valid values: [1, 9999]. |
|
memSizePerCore |
No |
System-determined |
The amount of memory for each core, in MB. The value must be an integer from 1 to 65536. |
Example
-
Prepare the test data as shown in the following table.
Age
Workclass
Fwlght
Edu
Edu_num
Married
C
Family
Race
Sex
Gail
Loss
Work_year
Country
Income
39
State-gov
77516
Bachelors
13
Never-married
Adm-clerical
Not-in-family
White
Male
2174.0
0.0
40.0
United-States
<=50K
50
Self-emp-not-inc
83311
Bachelors
13
Married-civ-spouse
Exec-managerial
Husband
White
Male
0.0
0.0
13.0
United-States
<=50K
38
Private
215646
HS-grad
9
Divorced
Handlers-cleaners
Not-in-family
White
Male
0.0
0.0
40.0
United-States
<=50K
53
Private
234721
11th
7
Married-civ-spouse
Handlers-cleaners
Husband
Black
Male
0.0
0.0
40.0
United-States
<=50K
28
Private
338409
Bachelors
13
Married-civ-spouse
Prof-specialty
Wife
Black
Female
0.0
0.0
40.0
Other
<=50K
37
Private
284582
Masters
14
Married-civ-spouse
Exec-managerial
Wife
White
Female
0.0
0.0
40.0
United-States
<=50K
49
Private
160187
9th
5
Married-spouse-absent
Other-service
Not-in-family
Black
Female
0.0
0.0
16.0
Jamaica
<=50K
52
Self-emp-not-inc
209642
HS-grad
9
Married-civ-spouse
Exec-managerial
Husband
White
Male
0.0
0.0
45.0
United-States
>50K
31
Private
45781
Masters
14
Never-married
Prof-specialty
Not-in-family
White
Female
14084.0
0.0
50.0
United-States
>50K
42
Private
159449
Bachelors
13
Married-civ-spouse
Exec-managerial
Husband
White
Male
5178.0
0.0
40.0
United-States
>50K
-
Add the Read Table and Data Pivoting components to the pipeline, and connect them.
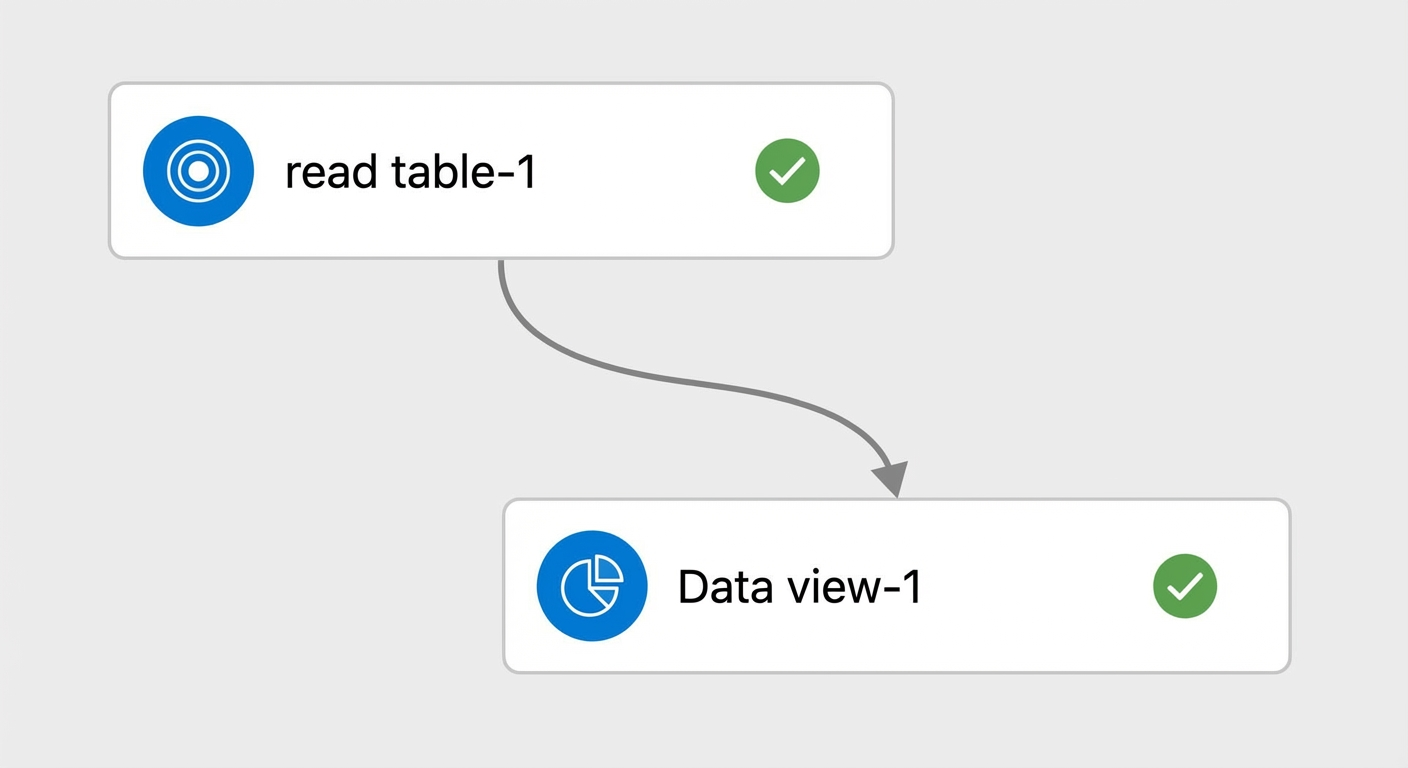
In the Fields Setting tab of the Data Pivoting component, select income as the target column and the other 14 fields as feature columns. Treat the BIGINT-type edu_num field as an enumeration feature. The Data Pivoting component's Fields Setting tab will show that Feature Columns, Target Column, and Enumeration Features have 14, 1, and 1 field selected, respectively.
-
Click
 in the upper-left corner to run the pipeline.
 -
After the pipeline finishes, right-click the Data Pivoting component and select View Data to view the results:
-
Output: To prepare the data for machine learning algorithms, STRING columns such as family, race, sex, and income are mapped to numeric values. The resulting training data table contains 15 columns: age, fwlght, edu_num, edu, workclass, married, c, family, race, sex, country, gail, loss, work_year, and income. The country column is highlighted to indicate it is a STRING feature column.
-
String Column Feature Mapping Table
NoteIf no STRING-type feature columns are selected, the String Column Feature Mapping Table is empty.
The String Column Feature Mapping Table contains three columns: feature_name, feature_value, and map_id. Each row maps a categorical feature value to a numeric ID. For example, for the feature
edu_num, the value 13 is mapped to 1 and 14 is mapped to 2. For the featureedu, the value '11th' is mapped to 1, and 'Bachelors' is mapped to 3, and so on. -
Output Meta Table: The output feature metadata table contains 10 columns (feature_name, feature_id, feature_type, feature_value, mean, std, min_value, max_value, label_num, and distribute_info) and 15 rows of feature data. The feature_type can be
label(for income),enum(for edu_num, edu, workclass, married, c, family, race, sex, and country), ornum(for age, fwlght, gail, loss, and work_year). For numeric features (num), the mean, std, min_value, and max_value columns contain specific statistical values. For enumeration (enum) and label features, these columns all contain-1.0. The feature_value column shows the enumerated values or numeric range for each feature, and the distribute_info column shows the distribution of feature values. distribute_info indicates the record count for each interval after the feature's value range is divided into equal intervals.
-