When building or refining a classification or regression model with Random Forest, you may want to know which input features drive predictions — and which add little value. The Random Forest Feature Importance Evaluation component ranks each feature by its contribution to the model, so you can prune uninformative columns, prioritize data collection, or explain model behavior to stakeholders.
The component supports two scoring methods:
-
Mean decrease in impurity (MDI): measures how much each feature reduces the average impurity across all decision trees during training.
-
Permutation importance: measures how much model accuracy drops when a feature's values are randomly shuffled.
Prerequisites
Before you begin, ensure that you have:
-
A trained Random Forest model available in PAI
-
Access to Machine Learning Designer
-
An input table containing the feature columns and label column
Configure the component
Method 1: Configure the component on the pipeline page
On the pipeline details page in Machine Learning Designer, add the Random Forest Feature Importance Evaluation component to the pipeline and configure the following parameters.
| Tab | Parameter | Description |
|---|---|---|
| Fields Setting | Feature Columns | Optional. The feature columns selected from the input table for training. Defaults to all columns other than the label column. |
| Target Column | Required. The label column. Click the |
|
| Parameters Setting | Parallel Computing Cores | Optional. The number of cores used in parallel computing. |
| Memory Size per Core | Optional. The memory size per core, in MB. |
Method 2: Use PAI commands
Use the SQL Script component to run PAI commands. For details, see Scenario 4: Execute PAI commands within the SQL script component.
pai -name feature_importance -project algo_public
    -DinputTableName=pai_dense_10_10
    -DmodelName=xlab_m_random_forests_1_20318_v0
    -DoutputTableName=erkang_test_dev.pai_temp_2252_20319_1
    -DlabelColName=y
    -DfeatureColNames="pdays,previous,emp_var_rate,cons_price_idx,cons_conf_idx,euribor3m,nr_employed,age,campaign,poutcome"
-Dlifecycle=28 ;| Parameter | Required | Default | Description |
|---|---|---|---|
inputTableName |
Yes | — | Name of the input table. |
outputTableName |
Yes | — | Name of the output table. |
labelColName |
Yes | — | Name of the label column in the input table. |
modelName |
Yes | — | Name of the input model. |
featureColNames |
No | All columns other than the label column | Feature columns selected from the input table for training. |
inputTablePartitions |
No | All partitions | Partitions selected from the input table for training. |
lifecycle |
No | Not specified | Lifecycle of the output table. |
coreNum |
No | Determined by the system | Number of cores. |
memSizePerCore |
No | Determined by the system | Memory size per core, in MB. |
Example
This example uses the bank_data table to evaluate which features most influence a classification model trained with Random Forest.
-
Create the training table by running the following SQL statements. This example selects the top 10 records from
bank_data.drop table if exists pai_dense_10_10; create table pai_dense_10_10 as select age, campaign, pdays, previous, poutcome, emp_var_rate, cons_price_idx, cons_conf_idx, euribor3m, nr_employed, y from bank_data limit 10; -
Create the experiment shown below. For details, see Custom pipelines. Use
pai_dense_10_10as the data source. Setyas the label column; all other columns are feature columns. For the Columns Forced to Convert parameter, selectageandcampaign— these columns are processed as enumerated (categorical) features. Keep the default settings for all other parameters.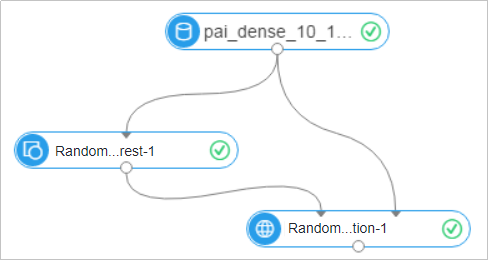
-
Run the experiment and view the prediction results.
-
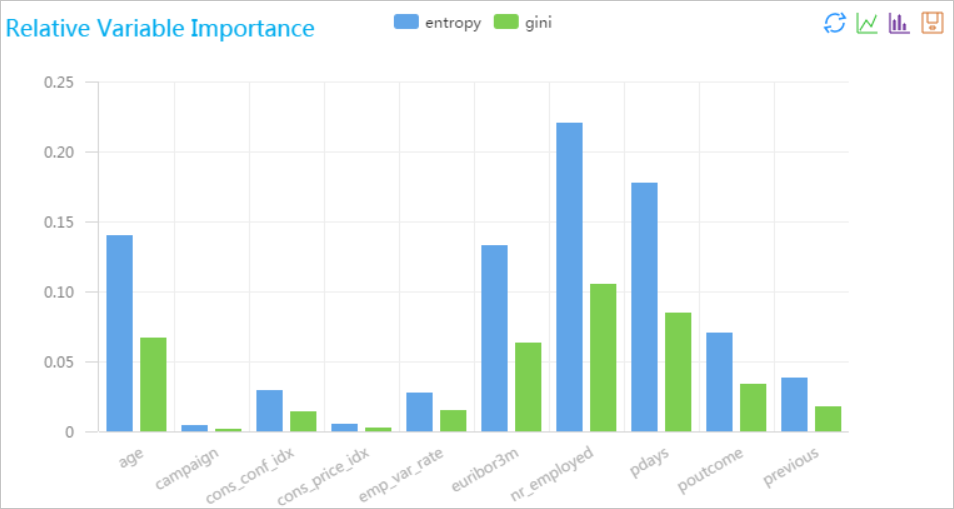
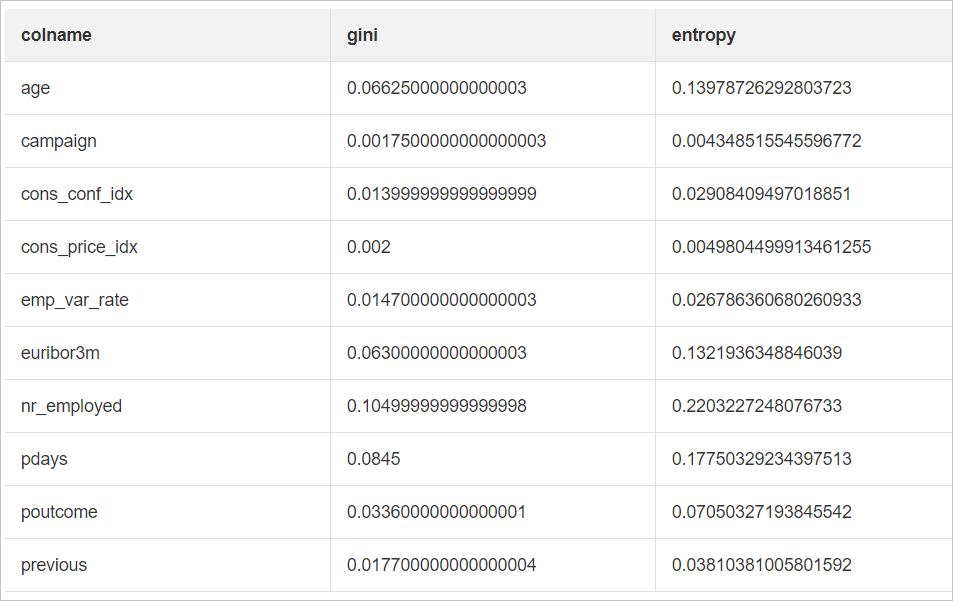
Right-click the Random Forest Feature Importance Evaluation component and select View Analytics Report to view the result.