All Products
Search
Document Center

DataWorks:MaxCompute table data

Last Updated:Jul 15, 2024

After you add a MaxCompute data source to a workspace and associate the data source with DataStudio in the workspace, you can directly perform operations on MaxCompute tables in Data Map in the DataWorks console. For example, you can retrieve data, preview data, view metadata details, view data lineages, and manage tables by category and group in Data Map. This topic describes how to view and manage MaxCompute tables in Data Map.

Prerequisites

A MaxCompute data source is added to a workspace and associated with DataStudio in the workspace. After the association, DataWorks automatically collects metadata of the data source. DataWorks collects full existing metadata at a time, collects incremental metadata every day, and then aggregates the full and incremental metadata to Data Map. DataWorks automatically performs O&M operations on the crawler that is used to collect metadata of a data source. You do not need to manually manage the crawler.

Note

If you cannot find the desired table in Data Map, perform the following steps: In the left-side navigation pane of the DataMap page, click My Data. In the left-side navigation pane of the page that appears, choose My Tools > Refresh Table Metadata. On the Refresh Table Metadata page, configure parameters to manually synchronize the desired table.

Go to the DataMap page

Log on to the DataWorks console. In the top navigation bar, select the desired region. Then, choose Data Governance > Data Map in the left-side navigation pane. On the page that appears, click Go to Data Map.

Search for a table

In the left-side navigation pane of the DataMap page, click image. The page on which you can search for tables appears. You can enter a keyword in the search box and click Search to search for all tables whose names or descriptions contain the keyword in the selected data source. Alternatively, you can click the Fields tab on the left of the page, enter a keyword in the displayed field, and then press Enter to search for all fields whose names or descriptions contain the keyword in the selected data source. You can also search for tables by category, project, or database. For information about how to configure table categories, see Table management by category: Configuration management.

You can perform the following shortcut operations on search results:

  • Request permissions on a table: You can find a table and click Apply for Permission to request permissions on the table in Security Center. You can view permission requesting records in Data Map. For more information, see Request and manage table permissions.

  • Add a table to a data album: You can add the current table to the desired data album and manage the table on the details page of the data album. For more information, see Table management from the business perspective: Data albums.

  • Add a table to favorites: You can find a table and click Add to Favorites to add the table to favorites or click Remove from Favorites to remove the table from favorites.

  • View table lineages: You can find a table and click View Lineage. Then, you can view the lineages between this table and other tables and the lineages between fields in this table and fields in other tables. The lineages are obtained based on the parsing result of data forwarding operations such as job scheduling and data synchronization. The lineages that are generated by manual operations such as ad hoc queries are excluded. For more information, see the View lineage information section in this topic.

  • View data definition language (DDL) statements: You can find a table, move the pointer over the more icon, and then select View DDL. In the Generate DDL Statement message, you can view or copy the DDL statement that is used to create the table.

View the details of a table

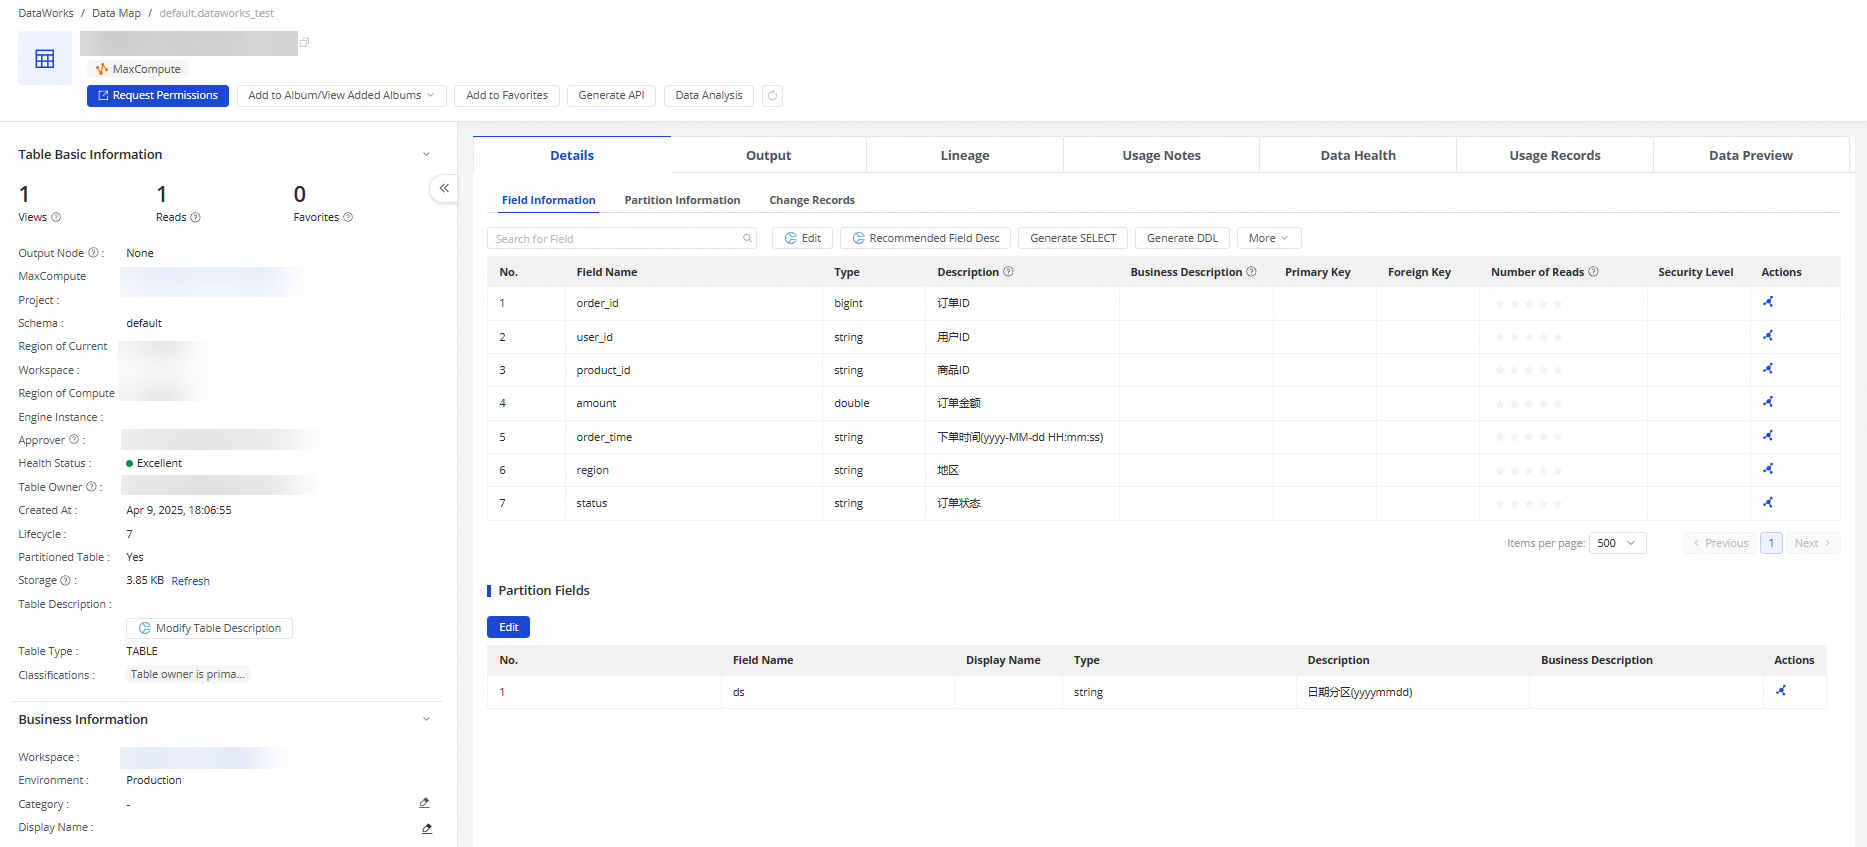
Click the name of a table in the search result list to go to the table details page and view the table details.

image.png

Area or tab

Description

References

Area for shortcut operations

In the upper part of the table details page, you can request permissions on the table, add the table to a data album or view a data album, and add the table to favorites. You can click Generate API to generate an API based on the table in DataService Studio, and click Data Analysis to write SQL statements on the SQL Query page in DataAnalysis to perform operations such as querying and analyzing data.

Table Basic Information

You can view the information about a table in this area. The information that you can view includes the number of times that the table is viewed, the number of times that the table is read, the number of times that the table is added to favorites, the lifecycle, the approver, the table owner, and the table type.

View the basic information about a table

Table Model Information

You can view the information about the current table model in this area. The information that you can view includes the data layer to which the table model belongs, business category of the table model, and storage policy of the table model.

After you click View Model, the Dimensional Modeling page of Data Modeling appears. You can view the table model on the page. On the configuration tab of the table model, you can modify the information about the table model, publish the table model, view the operation logs of the table model, or develop data for the table model.

Note

You can view the model information of only the tables that are generated by DataWorks Data Modeling.

Overview of dimensional modeling

Permission Information

You can view your permissions on a table in this area. After you click Click to View, the Permission Application Records tab appears. You can view the request processing status on this tab.

Request and manage table permissions

Technical Information

You can view the following information about a table in this area: DDL Statement Updated At, Data Updated At, and Last Viewed At.

Note

Description of the Last Viewed At parameter:

  • The value of this parameter indicates the time when the table was last accessed by using a command or in a node scheduling scenario.

  • The time is for reference only and may not be the same as the actual time when the table was last accessed.

  • The information is collected in offline mode and is updated with a delay of one day.

-

Details

You can view the following information about a table on this tab: field information, partition information, and change records.

View the details of a table

Output Information

If the table data periodically changes with the node in the production environment that generates the table, you can view the running details of the node on the Output Information tab. The information is collected in offline mode and is updated with a delay of one day.

-

Lineage

You can view the inner lineages of the node that generates the table or the lineages between this node and other nodes of the same compute engine type. If the current table is used as the data source of an API, you can also view the lineages between the table and the API. MaxCompute allows you to view the complete lineages of a batch synchronization node that is used to synchronize data to MaxCompute. The information is collected in offline mode and is updated with a delay of one day.

Note

For more information about how to view the complete lineages of a DataService Studio API, see View the details of an API.

View lineage information

Usage Notes

You can perform the operations such as modifying usage notes, viewing versions, or viewing markdown syntax. You can learn the relevant information based on the data description.

-

Data Quality

You can view the monitoring rules that are configured for the table and the alerts that are generated based on the monitoring rules. You can click Configure Rules to go to the Data Quality page and configure monitoring rules for the table.

Configure a monitoring rule for a single table

Records

You can view the reference and access records of the table on the following subtabs:

  • Frequently Associated: On this subtab, you can view the number of times that the table data is referenced.

  • Access Statistics: You can view the reference records of the table in the Trend for Reads, Field References in Clauses, and Top 10 Readers sections on this subtab.

View the usage records of a table

Data Preview

You can preview 20 random data records in the current table on this tab.

Important
  • You can preview tables that are in the production environment only if you are granted the required permissions. If you do not have permissions on tables, request permissions on the tables. For more information, see Request permissions on tables.

  • If the Preview Data switch is turned on for the workspace to which the table belongs, you can preview the table data on the Data Preview tab without the need to request permissions on the table in Security Center. The switch is on the Workspaces Owned/Managed by Me page.

  • If you configure data masking rules and the data masking rules are in the active state, the Data Preview tab displays data based on the data masking rules. For information about how to configure a data masking rule, see Create a data masking rule.

  • The Data Preview tab cannot display data in MaxCompute external tables or data in MaxCompute tables that contain JSON-formatted fields.

-

Data Profiling

You can view the data profiling results of a table on this tab. DataWorks detects the data of a table based on the schema and partition key values. The data profiling results include basic statistical information and data distribution.

Note
  • If you perform data profiling on the table, you are charged for the data profiling task, and the fees are generated in Data Quality. You can go to the Node Query page of Data Quality to view the data profiling logs of the table.

  • Data profiling is available only in the China (Shanghai) region.

View the basic statistical information about data and data distribution

View the basic information about a table

In the Table Basic Information section on the left of the table details page, you can view the information about the table, such as the number of times that the table is viewed, the number of times that the table is read, and the number of times that the table is added to favorites.

  • Views: This item displays the number of times that the table details page is viewed in Data Map over the last 30 days. The information is collected in offline mode and is updated with a delay of one day.

  • Reads: This item displays the number of times that the table is read from the production environment by executing SQL statements or running Tunnel Download commands, or Data Integration nodes over the last 30 days. This item collects only the number of times that the table generated by an auto triggered node is read. The number of times a table that is not generated by a node in DataWorks is not collected. The information is collected in offline mode and is updated with a delay of one day.

  • Favorites: This item displays the number of times that the table is added to favorites. The number of times is collected in real time.

  • Storage: This item displays the logical storage space occupied by data in the table. The information is collected in offline mode and is updated with a delay of one day.

  • Output Node: This item displays the ID of the auto triggered node that generates the table. If the table is periodically updated but no node ID is displayed, the data in the table may not be generated by an auto triggered node in DataWorks. You can contact the table owner for details. The information is collected in offline mode and is updated with a delay of one day.

    Note

    If you do not have the permissions to view the code of the node that generates the table, contact the administrator of the workspace to which the node belongs and ask the workspace administrator to grant you the required permissions. For more information, see Enable the prompt feature that displays impacts of committing or deploying nodes.

View the details of a table

Click the Details tab and view information about a table on the following subtabs of the Details tab: Field Information, Partition Information, and Change Records.

  • Field Information

    On this subtab, you can view the field information about a table. If the table is a partitioned table, you can also view partition fields in the table that are displayed in the Partition Fields section.

    Operation

    Description

    Edit

    You can click this button to modify the following information about the fields in the table: description, business description, security level, and primary key. You can also save the modified information or cancel the modification. You can specify a security level for multiple fields at the same time.

    Note
    • Only a workspace member that is assigned the Workspace Administrator role or the table owner can modify settings for table fields. If you want to modify settings for table fields, you must obtain the permissions of the Workspace Administrator role. For more information, see Manage permissions on global-level services.

    • The Security Level column is displayed on the Field Information subtab only for MaxCompute tables for which you specify field security levels.

    • You can specify security levels for fields in a MaxCompute table on the Field Information subtab only after you enable the security level feature in the MaxCompute compute engine associated with the current workspace. For information about how to enable the security level feature, see Label-based access control.

    Batch Edit Security Level

    You can click this button to specify or modify security levels for multiple fields in the table at a time. This improves data security.

    Upload

    You can click this button and drag the file that you want to upload from your on-premises machine to the Batch Upload Field Information dialog box.

    Note
    • Only a workspace member that is assigned the Workspace Administrator role or the table owner can upload data to a table whose details are displayed on this page. If you want to upload data to a table whose details are displayed on this page, you must obtain the permissions of the Workspace Administrator role. For more information, see Manage permissions on global-level services.

    • Only .xlsx files created in Excel 2007 are supported. You can also click Download Template File to download the template file.

    • The upload feature is not supported for table models that are generated by DataWorks Data Modeling.

    Download

    You can click this button to download the field information about the table.

    Generate SELECT Statement

    You can click this button to view or copy the SELECT statement in the Generate SELECT Statement dialog box. The statement can be used to query the table data.

    Generate DDL Statement

    You can click this button to view or copy the DDL statement in the Generate DDL Statement dialog box. The statement can be used to create the table.

    Note
    • The Number of Reads parameter represents the number of times that a field is specified in JOIN statements on the previous day. The value of this parameter is presented in the form of star rating based on the proportion of the number of times the field is specified in JOIN statements to the total number of times all fields in the table are specified in JOIN statements. The highest level of star rating is 5, and the lowest level of star rating is 0.

    • The Associated Metric parameter specifies the metrics that are associated with the fields in the table. If you want to create or update the association, go to the Dimensional Modeling page in Data Modeling. On the configuration tab of the table, modify the association between fields and metrics in the Field Management section. Then, publish the table to make the association take effect.

  • Partition Information

    On this subtab, you can view the partition information about a table, such as the partition name, the number of data records, and the logical storage space.

    Note
    • The data in the Number of Records and Storage columns is for reference only. The data displayed on the Partition Information subtab may not be updated in real time. The data in the compute engine prevails.

    • For a MaxCompute transactional table, you cannot view the number of data records in the table. The fixed value -1 is displayed in the Number of Records column for a MaxCompute transactional table. You can execute the SELECT COUNT(*) FROM <Table name> WHERE <Partition>; statement to query the number of records.

  • Change Records

    On this subtab, you can view the change records of a table, such as the change description, the change type, and the change granularity.

    You can select a change type from the Change Type drop-down list on the Change Records subtab to view the related table changes.

View lineage information

The lineage information is about the lineages between tables and the lineages between fields. The lineages are obtained based on the parsing result of data forwarding operations such as job scheduling and data synchronization. On the Lineage tab, you can view the ancestor and descendant tables of a table and the ancestor and descendant fields of a table field. You can also expand the lineage levels of a table to view the sources and destinations of the table. In addition, you can perform impact analysis for the required levels of descendant tables of a table based on your business requirements.

Note
  • The lineage feature is supported only in DataWorks Standard Edition or a more advanced edition.

  • The lineage information of a table includes the lineages between tables and the lineages between fields. The lineage information is obtained based on the parsing result of data forwarding operations such as job scheduling. The lineage information displayed on the Lineage tab is collected in offline mode and is updated with a delay of one day.

  • The lineage information that is generated by manual operations, such as ad hoc queries, is not included.

  • If Data Map cannot display data lineages that are generated by executing SQL statements in a PyODPS node as expected, you can resolve this issue by manually configuring the scheduling parameters in the code of the PyODPS node. For more information, see Develop a PyODPS 3 task and Develop a PyODPS 2 task.

  • View the lineage information of a table

    On the Table Lineage subtab, you can view the lineage details of a table. The following information is included:

    • View the numbers of ancestor and descendant tables of each table in the lineage graph. Move the pointer over a table or a node of a specific type and view information of the table or node, such as the basic information, logs, and code.

    • Enter a keyword in the search box of the lineage graph to display all the descendant tables whose names contain the keyword, or enter @+Username in the search box to display all the descendant tables that belong to the specified account.

    • Click the image.png or image.png icon in the lineage graph to show or hide ancestor or descendant nodes based on your business requirements.

  • View the lineage information of a table field

    On the Field Lineage subtab, you can view the lineage details of a table field. The following information is included:

    • Select the required field from the Change Field drop-down list to view the lineage graph of the field.

    • View the numbers of ancestor and descendant fields of each field in the lineage graph. Move the pointer over a field or a node of a specific type to view information of the field or node, such as the basic information, logs, and code.

    • Enter a keyword in the search box of the lineage graph to display all the descendant fields whose names contain the keyword, or enter @+Username in the search box to display all the descendant fields that belong to the specified account.

    • Click the image.png or image.png icon in the lineage graph to show or hide ancestor or descendant nodes based on your business requirements.

  • Perform impact analysis

    If the schema or data of a table changes, the descendant tables of the table are affected. You can perform impact analysis on the table to view the descendant tables and obtain the descendant tables that may be affected by the change. On this subtab, you can search for the desired descendant tables based on the filter conditions such as lineage level, node type, and table type, and you can download the search result to your on-premises machine.

    Note

    You can select up to 50 lineage levels of descendant tables for which you want to perform impact analysis.

View the usage records of a table

You can view the reference and access records of the table on the following subtabs:

  • Frequently Associated: On this subtab, you can view the number of times that the table data is referenced.

    Note

    The Frequently Associated subtab displays the number of times that the table data is referenced over the last 30 days. The information is collected in offline mode and is updated with a delay of one day.

  • Access Statistics: You can view the reference records of the table in the following sections on this subtab:

    • Trend for Reads: A date in the line chart corresponds to the number of times that the table is read from the development or production environment on the date. The number of times that a field in the table is read is related to the numbers of times a node that references the field is run and the field is referenced in the code of the node. The information is collected in offline mode and is updated with a delay of one day.

      If a field in the table is referenced by a node once and the node is run twice, the number of times that the field is read is recorded as two. If the field is referenced in the code of the node twice, the number of times that the field is read is recorded as two after the node is run once.

    • Field References in Clauses: This section displays the number of times that the fields in the table are specified in the WHERE, SELECT, JOIN, and GROUP BY statements. The information is collected in offline mode and is updated with a delay of one day.

    • Top 10 Readers: This section displays the users who read the table by executing SQL statements over the last 30 days and other details about the read operations. The users include scheduling users in the production environment and users who commit nodes in the development environment. The SQL statements that are used include WHERE, SELECT, JOIN, and GROUP BY. The information is collected in offline mode and is updated with a delay of one day.

View the basic statistical information about data and data distribution

You can view the data profiling results of a table on this tab. DataWorks detects the data of a table based on the schema and partition key values. The data profiling results include basic statistical information and data distribution.

Note

Limits:

  • Only data in partitioned tables can be detected.

  • Only tables in the production environment can be detected.

  • Only the table owner can enable the Auto Profiling feature.

  • This feature is available only in the China (Shanghai) region.

On the Data Profiling tab, you can specify a profiling mode and view data profiling records. The Manual Profiling and Auto Profiling modes are supported.

  • Manual Profiling: To implement manual profiling, perform the following steps:

    Note

    Data profiling tasks run in the MaxCompute project to which a detected table belongs. The system can detect a maximum of 10 columns in a table at a time. To save resources, select only the columns that you want to detect.

    1. On the Data Profiling tab, click Manual Profiling.

    2. In the Manual Profiling dialog box, configure the parameters.

      • Partition Value: The partition that you want to detect. You can select the desired partition from the Partition Value drop-down list.

      • Detailed Configuration: The columns that you want to detect. You can select the desired columns in the Detailed Configuration section.

      • Estimated Cost: The estimated cost for running the data profiling task. The cost is estimated based on the settings of the preceding parameters.

        Important
        • To detect data in the MaxCompute table, you must execute MaxCompute SQL statements. When you execute MaxCompute SQL statements, you are charged for using the MaxCompute service. The estimated cost is for reference only. The actual cost varies based on the amount of data that is detected. You can check the bills for MaxCompute to view the actual cost.

        • Features provided by Data Quality are used during data profiling. When you run a data profiling task, fees are generated in Data Quality and included in the bills for DataWorks. For more information, see Billing overview.

    3. Select I understand that using this service will be charged and click Commit.

    4. After the data profiling task is complete, view the data profiling results on the Data Profiling tab.

      You can select an option from the Profiling Records drop-down list to view the desired data profiling result. You can choose Data Distribution > Value range to view the distribution of data values in a field.

  • Auto Profiling: To enable auto profiling, perform the following steps:

    1. Turn on Auto Profiling.

    2. In the Auto Profiling (When Partition Information Changes) dialog box, configure the parameters.

      • Detailed Configuration: The columns that you want to detect. You can select the desired columns in the Detailed Configuration section.

      • Bind Trigger: The auto triggered node that triggers auto profiling. You must select an auto triggered node from the Bind Trigger drop-down list. You can view the IDs of auto triggered nodes in Operation Center. We recommend that you select the auto triggered node that generates the current table.

        After you select the metrics based on which you want to detect the table data and submit the auto profiling task, the system runs the auto profiling task to detect the latest partition in the table after the auto triggered node is successfully run.

      • Estimated Cost: The estimated cost for running the data profiling task. The cost is estimated based on the settings of the preceding parameters.

    3. Select I understand that using this service will be charged and click Commit.

    4. After the data profiling task is complete, view the data profiling results on the Data Profiling tab.

      You can select an option from the Profiling Records drop-down list to view the desired data profiling result.

Request and manage table permissions

You can go to Security Center of DataWorks to request permissions to query MaxCompute tables and perform other operations on MaxCompute tables. You can view permission request records in Data Map.

  • Request table permissions

    1. On the table details page, click Apply for Permission.

      image.png

      Note

      If the table is hidden, the Apply for Permission button is not displayed on the table details page.

    2. By default, the Permission Application tab in Security Center of the latest version appears. For more information, see Manage permissions on MaxCompute.

  • Manage table permissions

    1. In the left-side navigation pane of the DataMap page, click My Data.

    2. In the left-side navigation pane of the My Data page, click Permission Management.

      On the page that appears, you can click Apply for Function and Resource Permissions to request permissions on functions and resources, and view requests that are pending for you to process, requests that you sent, and requests that you processed on the To Be Approved, Submitted by Me, and Handled by Me tabs, respectively. You can specify a validity period for permissions. If the validity period of the permissions is exceeded, the system automatically revokes the permissions. For more information, see View and manage permissions.

Manage MaxCompute tables

Use data albums to manage tables

You can add the current table to the desired data album, and manage the table on the details page of the data album. You can also view the data albums to which the current table is added. For more information, see Table management from the business perspective: Data albums.

Configure categories to manage tables

In the left-side navigation pane of the DataMap page, move the pointer over the settings icon, and choose Configuration Management > Manage Categories to configure categories to manage MaxCompute tables. For more information, see Table management by category: Configuration management.