Data Quality allows you to configure quality monitoring rules for data tables. You can use these rules to check if table data meets your requirements, automatically block tasks that produce problematic data, and prevent dirty data from propagating downstream, ensuring that your output data meets expectations. This topic describes how to configure, run, and manage quality monitoring rules for a specific table.
Prerequisites
Quality rules are configured for engine data tables. To do this, you must first acquire engine metadata. For more information, see Metadata acquisition.
Limitations
Data source limits: You can configure quality monitoring rules only for MaxCompute, E-MapReduce, Hologres, CDH Hive, AnalyticDB for PostgreSQL, AnalyticDB for MySQL, StarRocks, MySQL, SQL Server, DLF, and Lindorm data sources.
Network limits: After a rule is configured, the scheduling node that generates the table data must use a resource group with established network connectivity to trigger the Data Quality rule check.
Rule effectiveness limits: Rules that use a dynamic threshold require at least 21 days of sample data to work correctly. With fewer than 21 days of data, the rule check may fail or produce inaccurate results. If you do not have 21 days of sample data, you can configure the rule, associate it with a scheduling task, and then use the backfill feature to generate the required data.
Core components of quality monitoring

Configuring quality monitoring rules for a table is the core process of defining your data quality validation logic. This process involves four key components:
Monitoring scope: Specifies the target asset for data quality checks. The configuration includes:
Monitored Object: Select one or more physical tables for data quality checks. Both partitioned and non-partitioned tables are supported.
Data range: For a partitioned table, you must use a partition filter expression to dynamically define which partitions to scan during each check. For example, use
$[yyyymmdd-1]to check the partition data from the day before the data timestamp.
Monitoring Rule: Define the specific validation logic and measurement standards to determine whether data meets expectations.
Rule definition: You can add one or more quality rules to a monitored object. Each rule is instantiated from a rule template. The template can be one of the following types:
System template: Use a built-in template provided by DataWorks. System templates cover multiple dimensions, such as integrity, uniqueness, and validity. Examples include "table row count fluctuation" and "field unique value count".
Custom template: Create reusable validation logic with custom SQL.
Rule properties: Each rule requires you to configure its key properties, including a threshold (for example, fluctuation rate not exceeding 30%) and its severity (strong or weak rule). If a check for a strong rule fails, it can block the associated scheduling task.
Trigger Method: Defines when the quality monitoring task runs.
Scheduled trigger: Associates the quality monitoring with an upstream DataWorks scheduling node, typically the one that generates the monitored table. When the scheduling node runs successfully, the associated quality rules are automatically triggered for validation. This is the best practice for automated data quality assurance.
Triggered Manually: This validation process is not associated with a scheduling task and requires you to start it manually from the UI. This method is suitable for temporary, one-time data exploration and validation.
Alert policy: Configures the notification strategy for when data quality issues occur.
Alert subscription: You can configure alerts for specific rule check results, such as "failed" or "warning". The system supports sending notifications through various channels, including email, SMS, telephone, DingTalk chatbots, Lark chatbots, WeCom chatbots, and custom webhooks.
After you configure these four components and save the settings, a complete quality monitoring plan is created. Before you deploy it to the production environment, we recommend that you use the test run feature to verify your configuration.
Procedure
Step 1: Access the table quality details page
Go to the Data Quality page.
Log on to the DataWorks console. In the top navigation bar, select the desired region. In the left-side navigation pane, choose . On the page that appears, select the desired workspace from the drop-down list and click Go to Data Quality.
Go to the Configure by Table page.
In the left-side navigation pane, click to go to the rule configuration page.
In the Data Source list on the left, select the database that contains the table for which you want to configure rules.
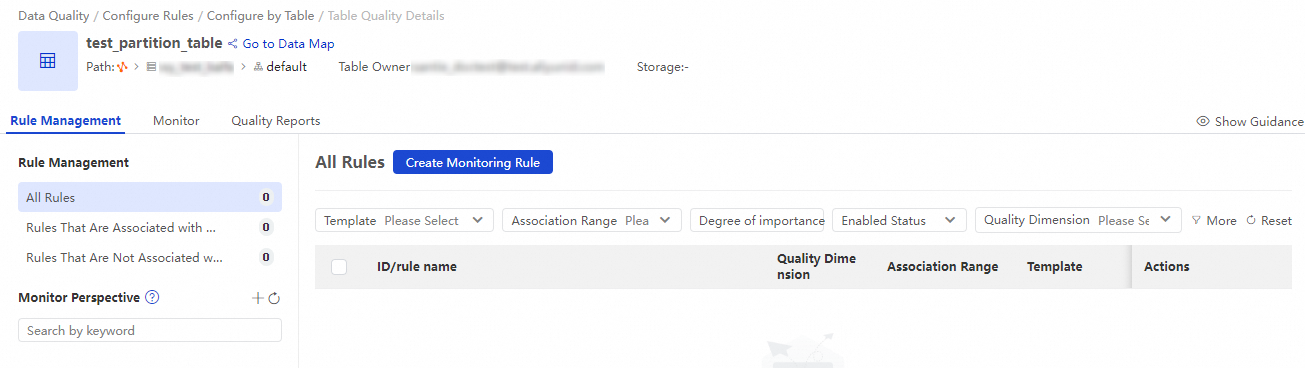
Filter tables by database type, database, table name, or other criteria. Click the target table name, or click Rule Management in the Actions column to go to the table's quality details page.
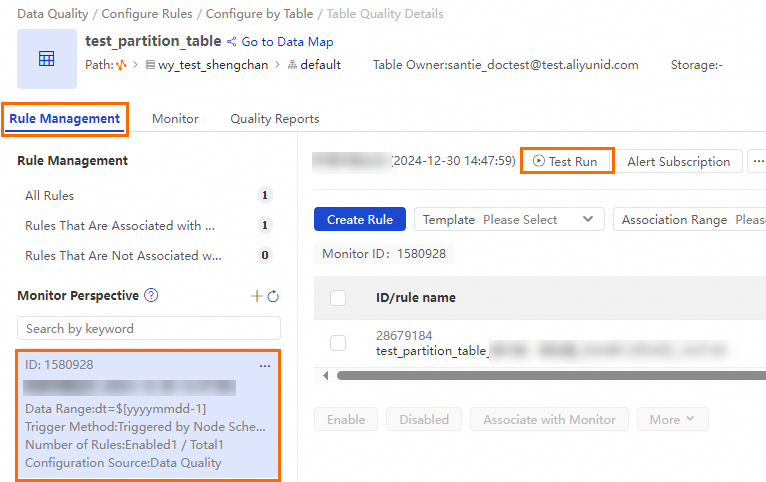
This page displays all configured quality monitors and rules for the current table. You can filter rules based on whether they are associated with a quality monitor. You can also define the run configuration for rules that are not yet associated with a quality monitor.
Step 2: Create a quality monitor
Create a quality monitor.
You can create a quality monitor in one of the following two ways:
Rule management tab
On the Table Quality Details page, click the Rule Management tab. Next to Monitor Perspective, click the
 icon to create a new quality monitor.
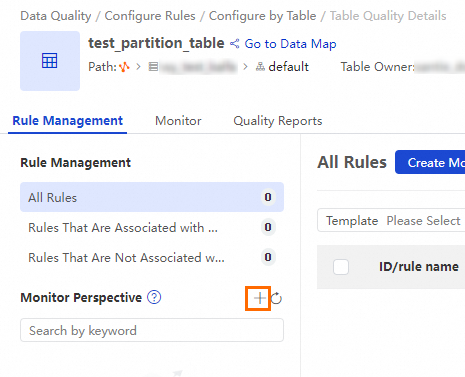
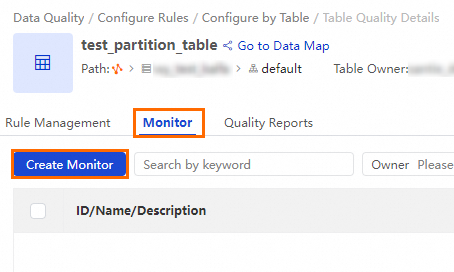
Quality monitoring tab
On the Table Quality Details page, switch to the Quality monitoring tab. Click Create Monitor.
Configure the parameters for the quality monitor.
Section
Parameter
Description
Basic Configurations
Monitor Name
Enter a custom name for the quality monitor.
Quality Monitoring Owner
Specify the owner of this quality monitor. When you configure an alert subscription, you can specify the owner as the alert recipient by using the Email, Email and SMS, or Telephone notification method.
Monitored Object
The object for data quality checks. By default, this is the current table.
Data Range
Use a partition filter expression to define which partitions of the table the quality rule will check.
For a non-partitioned table, you do not need to configure this parameter. The default is Full Table.
For a partitioned table, the expression format is
partition_name=partition_value. The partition value can be a fixed value or a built-in partition filter expression.
NoteThis configuration does not take effect when configuring rules with a custom template or custom SQL. For quality rules configured with a custom template or custom SQL, the custom SQL determines which partitions to check.
Select Quality Rules
Select Quality Rules
Selects the quality rules to associate with the quality monitor. These rules will check if the data in the specified range meets expectations.
NoteYou can create multiple quality monitors for different partitions and associate them with different quality rules to apply different validation rules to different partitions.
If you have not created a quality rule, you can skip this step. You can first create the quality monitor and then add rules to it later. For more information about how to create a quality rule, see Step 3: Configure data quality rules.
Running Settings
Trigger Method
The trigger method for the quality monitor.
Triggered by Node Scheduling in Production Environment: Associates the quality monitor with a specific, periodically scheduled task in DataWorks Operation Center. After the task runs successfully, the quality rules in this quality monitor are automatically triggered. Dry-run tasks do not trigger quality rule checks.
Triggered Manually: Allows you to manually trigger the quality monitoring rules that are associated with the current quality monitor.
ImportantIf the table you are monitoring is not a MaxCompute table and you set Trigger Method to Triggered by Node Scheduling in Production Environment, the selected periodically scheduled task cannot use a public scheduling resource group. Otherwise, the quality monitor reports an error when it runs.
Associate Scheduling Node
If you set Trigger Method to Triggered by Node Scheduling in Production Environment, you can configure this parameter to specify an associated scheduling node. After the specified scheduling node runs successfully, the quality monitoring rules are automatically triggered.
Select Run Resource
Specifies the computing resources required to run the quality rule checks. By default, the resource for the data source of the monitored table is selected. If you select another data source, make sure that its resources can access the table.
Handling Policies
Quality Issue Handling Policies
Configure the blocking or alerting policy to use when the system detects a data quality issue.
Alert: When a data quality issue is detected, the system sends an alert to the subscribed channels for the quality monitor.
The default conditions are
Strong Rule · Critical Anomaly,Strong Rule · Warning Anomaly,Strong Rule · Check Failed,Weak Rule · Critical Anomaly,Weak Rule · Warning Anomaly, andWeak Rule · Check Failed.Blocks: When a data quality issue is detected, the system identifies the production scheduling node that triggered the table quality check, sets the node to Failed, and prevents downstream nodes from running. This process blocks the production pipeline to prevent problematic data from spreading.
The default condition is
Strong Rule · Critical Anomaly.ImportantIf you set the policy to Blocks, the system also triggers an alert when a data quality rule's conditions are met.
Alert Method Configuration
You can send alert notifications by using Email, Email and SMS, DingTalk Chatbot, DingTalk Chatbot @ALL, Lark Group Chatbot, Enterprise WeChat Chatbot, Custom Webhook, or Telephone.
NoteTo use a chatbot, add a DingTalk, Lark, or WeCom chatbot, obtain its webhook URL, and then paste the URL into the alert subscription.
The Custom Webhook notification method is supported only in DataWorks Enterprise Edition. For information about the message format of an alert notification sent by using a Custom Webhook, see Appendix: Webhook message format.
If you select Email, Email and SMS, or Telephone as the notification method, you can set Recipient to Data Quality Monitoring Owner, Shift Schedule, or Scheduling Task Owner.
Data Quality Monitoring Owner: Alert notifications are sent to the Quality Monitoring Owner specified in the Basic Configurations section of the current quality monitor.
Shift Schedule: When an alert for a quality rule check is triggered by a scheduling node that is associated with a quality monitor, the system sends an alert notification to the on-duty user for the current day in the shift schedule.
Scheduling Task Owner: Alert notifications are sent to the owner of the scheduling node that is associated with the quality monitor.
Click Save to create the quality monitor.
Step 3: Configure data quality rules
You can configure quality rules based on built-in table-level and field-level monitoring templates. For more information about built-in rule templates, see View built-in rule templates.
On the Table Quality Details page, on the Rule Management tab, select the quality monitor that you created and click Create Rule to go to the rule configuration page.
Create a data quality rule.
Data Quality provides several methods for configuring quality monitoring rules. Select the one that best suits your business requirements.
Method 1: System template
Data Quality provides dozens of built-in quality rule templates. In the left-side pane, click + Use next to a template to quickly create a quality monitoring rule. You can add multiple rules at the same time.
You can click + System Template Rule at the top and then modify the Template parameter to change the rule template.
Method 2: Custom template
NoteBefore you use a custom template to create a rule, you must go to to create a custom rule template. For more information, see Create and manage custom rule templates.
When you use a custom template, the system automatically displays its basic configurations, such as the FLAG parameter and validation SQL. You can specify a custom Rule Name and configure monitoring thresholds based on the rule type. For example, a numeric rule requires a normal threshold and a critical threshold, while a fluctuation-type rule also requires a warning threshold.
Method 3: Custom SQL
This method allows you to customize the data quality validation logic for the table.
Method 4: Custom script
Custom script rules support hour- and minute-level data validation. For information about how to write script rules, see Using system rule templates. For example:
- assertion: change 30 minutes ago for max(id) = 15
  name: 30-minute difference in max value of id field is 15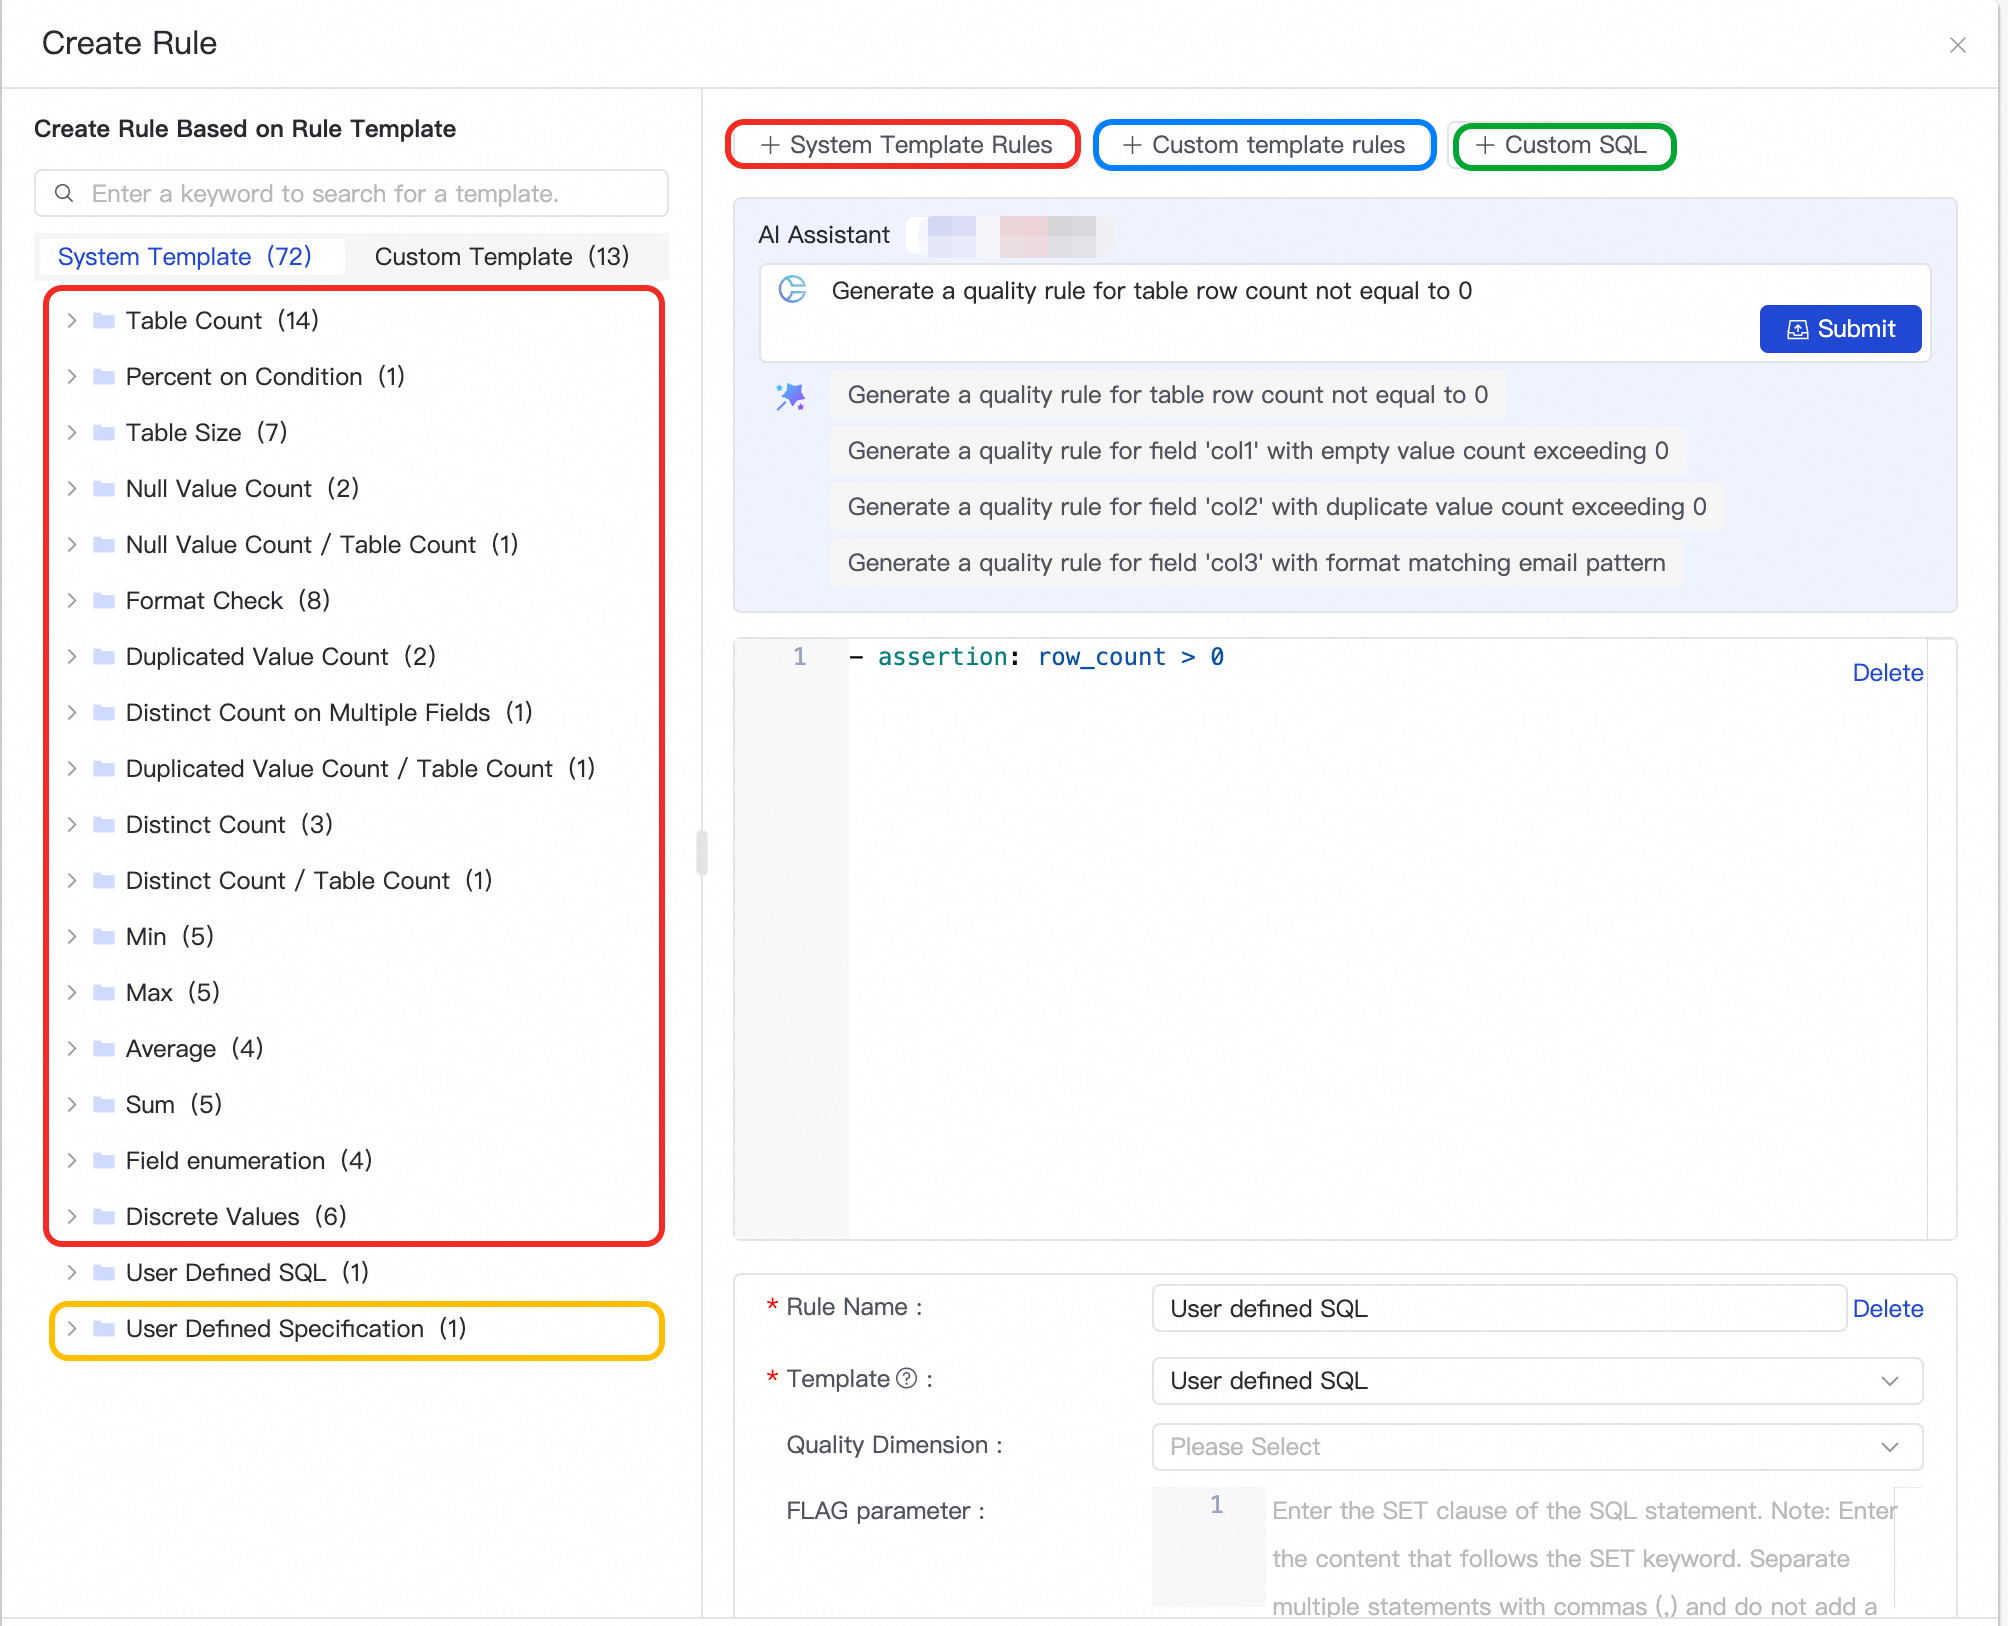
(Optional) Add the configured rule to a quality monitor. For more information about quality monitors, see Step 2: Create a quality monitor.
NoteA quality rule can be triggered only after you add it to a quality monitor. You can select an existing quality monitor here, or select this quality rule in the Select Quality Rules step when you configure a quality monitor.

Click OK.
Step 4: Test the rule execution
You can test the rules in a quality monitor in the following ways.
From the rule management tab
On the Rule Management tab, under Monitor Perspective, find the quality monitor that you created and click Test Run.
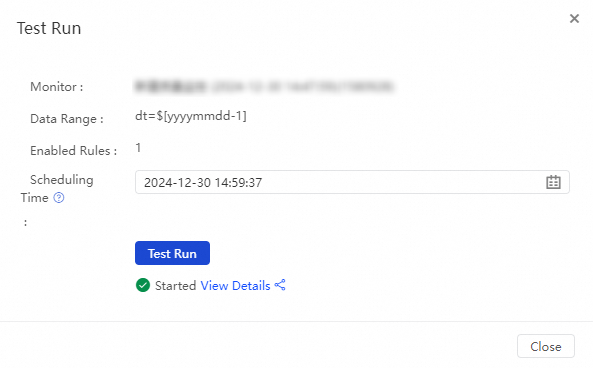
In the Test Run dialog box, confirm parameters such as Data Range and Scheduling Time, and then click Test Run. After Started is displayed, you can click View Details to view the detailed results of the test run.
From the quality monitoring tab
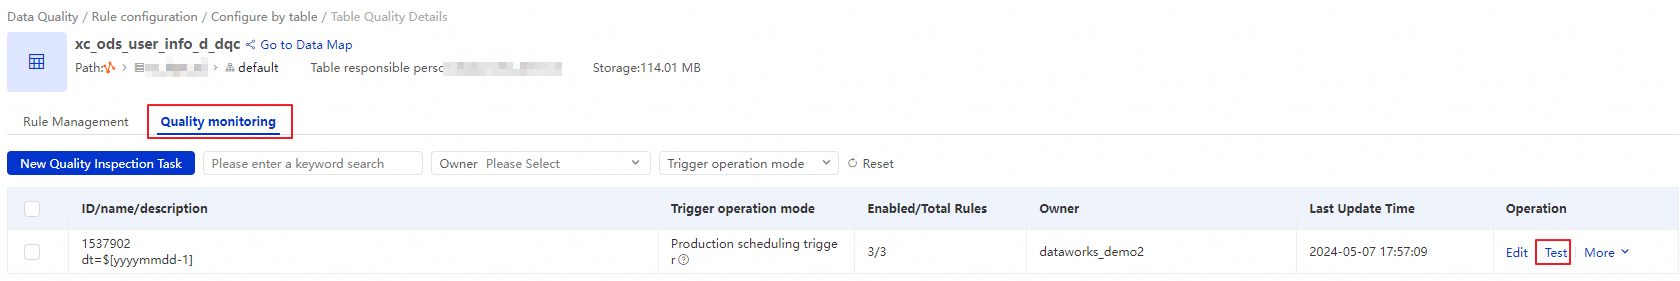
On the Monitor tab, find the quality monitor that you created, and click Test in the Actions column.
In the Test Run dialog box, confirm parameters such as Data Range and Scheduling Time, and then click Test Run. After Started is displayed, you can click View Details to view the detailed results of the test run.
Step 5: Modify alert subscriptions
You configured alert subscriptions in Step 2. Create a quality monitor. When a rule triggers, the system sends a notification to the specified alert recipients. If you want to modify the alert subscription to notify other users, you can configure it in the following ways.
From the rule management tab
On the Rule Management tab, under Monitor Perspective, find the quality monitor that you created and open the alert subscription page as shown in the following figure.
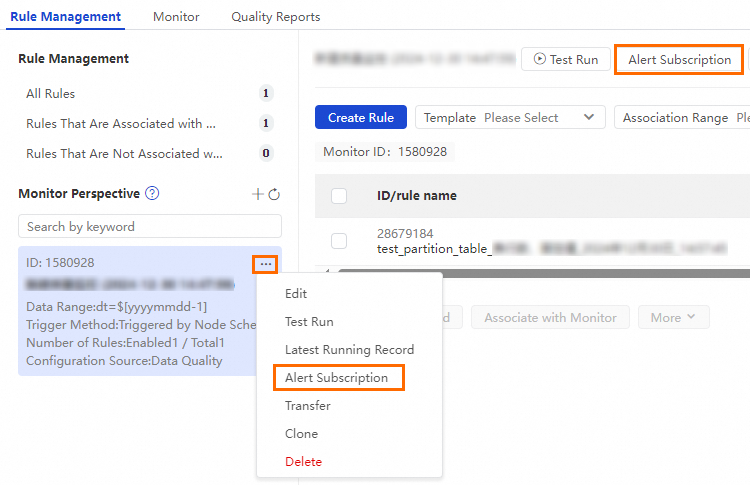
In the Alert Subscription dialog box, add a Notification Method and a Recipient, and then click Save in the Actions column. After you save the settings, you can add another subscription.
The supported notification methods include Email, Email and SMS, DingTalk Chatbot, DingTalk Chatbot @ALL, Lark Group Chatbot, Enterprise WeChat Chatbot, Custom Webhook, and Telephone.
NoteTo use a chatbot, add a DingTalk, Lark, or WeCom chatbot, obtain its webhook URL, and then paste the URL into the alert subscription.
The Custom Webhook notification method is supported only in DataWorks Enterprise Edition. For information about the message format of an alert notification sent by using a Custom Webhook, see Appendix: Webhook message format.
If you select Email, Email and SMS, or Telephone as the notification method, you can set Recipient to Data Quality Monitoring Owner, Shift Schedule, or Scheduling Task Owner.
Data Quality Monitoring Owner: Alert notifications are sent to the Quality Monitoring Owner specified in the Basic Configurations section of the current quality monitor.
Shift Schedule: When an alert for a quality rule check is triggered by a scheduling node that is associated with a quality monitor, the system sends an alert notification to the on-duty user for the current day in the shift schedule.
Scheduling Task Owner: Alert notifications are sent to the owner of the scheduling node that is associated with the quality monitor.
From the quality monitoring tab
On the Monitor tab, find the quality monitor that you created, and click in the Actions column.
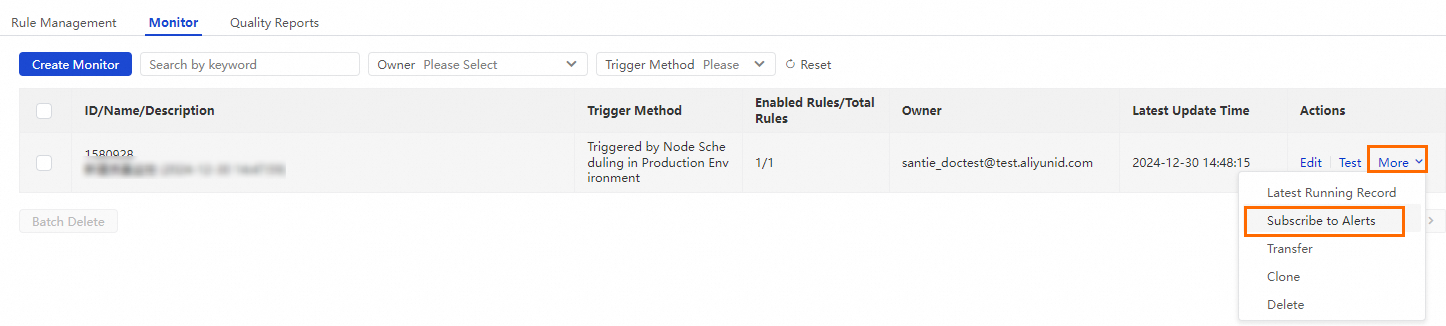
In the Alert Subscription dialog box, add a Notification Method and a Recipient, and then click Save in the Actions column. After you save the settings, you can add another subscription.
The supported notification methods include Email, Email and SMS, DingTalk Chatbot, DingTalk Chatbot @ALL, Lark Group Chatbot, Enterprise WeChat Chatbot, Custom Webhook, and Telephone.
NoteTo use a chatbot, add a DingTalk, Lark, or WeCom chatbot, obtain its webhook URL, and then paste the URL into the alert subscription.
The Custom Webhook notification method is supported only in DataWorks Enterprise Edition. For information about the message format of an alert notification sent by using a Custom Webhook, see Appendix: Webhook message format.
If you select Email, Email and SMS, or Telephone as the notification method, you can set Recipient to Data Quality Monitoring Owner, Shift Schedule, or Scheduling Task Owner.
Data Quality Monitoring Owner: Alert notifications are sent to the Quality Monitoring Owner specified in the Basic Configurations section of the current quality monitor.
Shift Schedule: When an alert for a quality rule check is triggered by a scheduling node that is associated with a quality monitor, the system sends an alert notification to the on-duty user for the current day in the shift schedule.
Scheduling Task Owner: Alert notifications are sent to the owner of the scheduling node that is associated with the quality monitor.
Next steps
After a quality monitor runs, you can go to Quality O&M in the left-side navigation pane and click Monitor and Running Records to view the table's quality check status and the complete records of its quality rule checks.
Appendix
Appendix 1: Formulas for fluctuation rate and variance
Formula for fluctuation rate:
Fluctuation rate = (Sample value - Baseline value) / Baseline valueSample value: The value of the sample collected on the current day. For example, for a 1-day fluctuation check of the table row count in an SQL task, the sample is the row count of the current day's partition.
Baseline value: The comparison value from historical samples.
NoteIf the rule is a
table row count, 1-day fluctuation ratecheck for an SQL task, the baseline value is the row count of the previous day's partition.If the rule is a
table row count, 7-day average fluctuation ratecheck for an SQL task, the baseline value is the average row count from the previous 7 days.
Formula for variance fluctuation:
(Current sample - Average of last N days) / Standard deviationNoteYou can use variance only for numeric types such as BIGINT and DOUBLE.
Appendix 2: Built-in partition filter expressions
The following example assumes this scenario:
The data timestamp (bizdate) is
20240524The scheduling time is
10:30:00
Partition filter expression | Description | Example |
| Checks the partition data of the current data timestamp. |
|
| Checks the partition data from the day before the data timestamp. |
|
| Checks the partition data from 7 days before the data timestamp (one week ago). |
|
| Checks the partition data from the same day of the previous month as the data timestamp. |
|
| Checks the partition for the current data timestamp, accurate to the second of the current scheduling time. |
|
| Checks the second-level partition data at midnight of the current data timestamp. |
|
| Checks the second-level partition data from one hour before the scheduling time on the current data timestamp. |
|
| (For hourly partitions) Checks the partition from one hour before the scheduling time. The format is usually |
|
| (For minute-level partitions) Checks the partition from 30 minutes before the scheduling time. The format is usually |
|
| (For two-level partitions) Checks all hourly partition data from the day before the data timestamp. | All partitions from |