After you create a MaxCompute data source and bind it to DataWorks Data Studio, you can perform operations on MaxCompute tables in Data Map. These operations include retrieving and previewing data, viewing metadata details, viewing data lineage, managing tables using categorization and grouping, and gaining data insights. This topic describes how to view and manage MaxCompute tables in Data Map.
Prerequisites
You must create a MaxCompute data source and bind it to DataWorks Data Studio. After the data source is bound, DataWorks automatically collects metadata from the engine. The system performs a one-time full collection of existing metadata and then collects incremental metadata daily. All metadata is aggregated into Data Map. The system automatically maintains the metadata collection process, so you do not need to manage it manually.
In Data Map, you can use the global metadata search feature to find your target MaxCompute table.
If you cannot find the target table in Data Map, you can go to to manually sync the table.
View table details
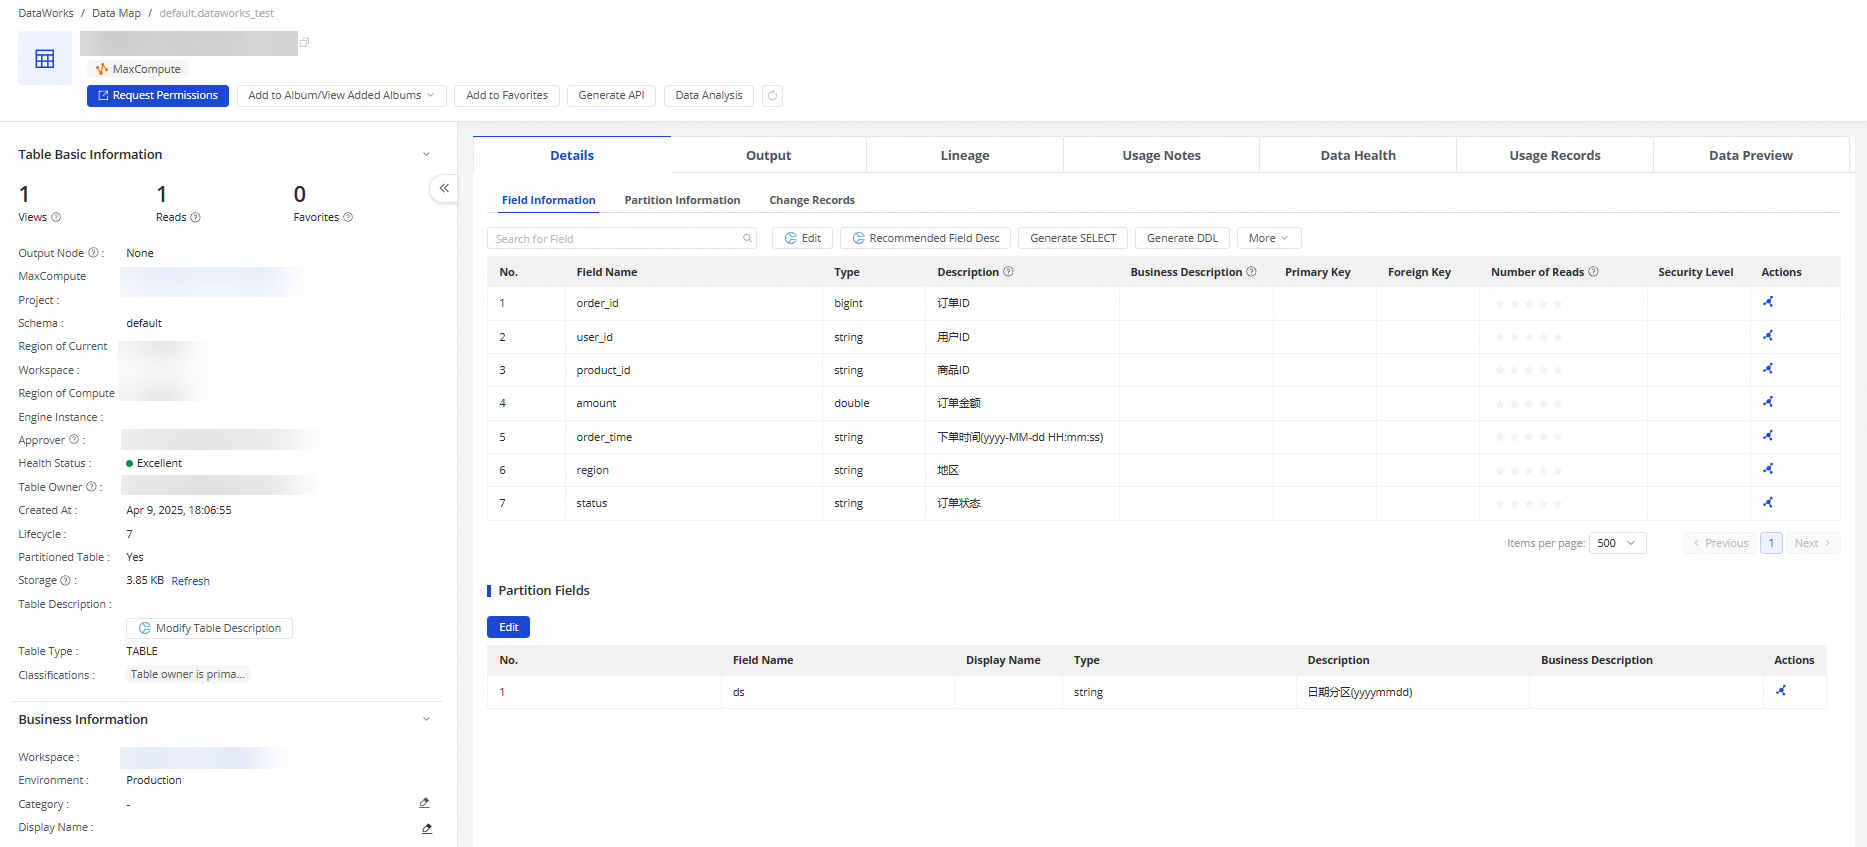
In the list of search results, you can click the name of the target table to open its details page and view its comprehensive information.
Feature | Description | References | |
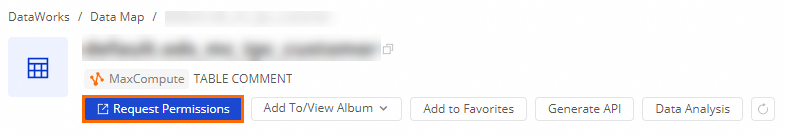
Quick actions | On the top of the page, you can request permissions, add the table to a data album or view albums, favorite the table, generate an API on the DataService Studio page, or write SQL statements on the SQL Query page to query and analyze data. | ||
Table Basic Information | You can view the table's Views, Reads, Favorites, and Lifecycle in the Table Basic Information area. Information such as Approver, Health Status, Table Owner, and Table Type. | ||
Table model information | View information such as the data warehouse layer, business category, and storage policy for the current modeled table. Click View Model to go to the page to view the created model table. On the table editing page, you can modify table information, publish the table, view operation logs, or perform data development on the table model. Note Only tables generated by DataWorks Smart Data Modeling display model information. | ||
Table permission information | View the table permissions you currently hold. Click View Details to go to the Table Permission Request page to apply for permissions. | ||
Table technical information | View the DDL Statement Updated At, Data Updated At, and Last Viewed At. Note Last view time:
| - | |
Details | View the table’s field information, partition information, and change records. | ||
Output information | If the table data changes periodically due to associated tasks, click Output Information to view runtime details of the corresponding production task. This data is calculated offline and has a T+1 delay. | - | |
Lineage information | View lineage relationships within or across engine nodes. You can also view lineage between the engine (as a data source) and output data interface APIs. Additionally, MaxCompute supports end-to-end lineage tracking based on offline synchronization. This data is calculated in real time. Note To view the complete end-to-end lineage chain from the API perspective (including upstream data sources and downstream apps), see View API details. | ||
Usage instructions | You can edit, view historical versions, and view Markdown syntax to understand business-related information about the data. | - | |
Data Health | Data Asset Governance | Shows the current table’s governance health score, trend of issues requiring governance, and specific governance items. If governance issues exist, you can quickly address them. | |
Data Quality | Shows configured data quality monitoring rules and the DQC alert list for the current table. Click Configure Rules on the right to go to the Data Quality page and set up quality monitoring rules for the table. | ||
Usage Records | Shows table usage records through two dimensions: Frequently Associated and Access Statistics.
| ||
Data Preview | Preview 20 random rows of data from the current table. Important
| ||
Data Insight | Create data insights for the table to obtain statistical and distribution information through in-depth data analysis and interpretation. | ||
View lineage information
Lineage information is generated by parsing real data flows, such as scheduled jobs and data synchronization jobs, to show the relationships between tables and fields. On the lineage page, you can view the upstream and downstream dependencies of tables or fields, trace the original data source, identify the final destination databases, and perform impact analysis across different lineage levels.
Lineage information is available only in DataWorks Standard Edition and later versions.
Table and field lineage is generated in real time by parsing real data flows, such as scheduled jobs.
Lineage from ad hoc queries or manual operations is not supported.
If Data Map fails to display the data lineage of SQL statements that are executed by a PyODPS node, you must manually configure DataWorks scheduling parameters in the code of your PyODPS task. For more information, see Develop a PyODPS 3 task and Develop a PyODPS 2 task.
View Table Lineage

On the Table Lineage tab, you can view the detailed lineage of the current table. The following information is provided:
The number of upstream and downstream nodes for each lineage node. You can move the pointer over a table or task type to view its basic information.
You can click a node and enter a keyword in the floating panel that appears to view all downstream tables that contain the keyword. You can also enter
@+account_nameto view all downstream tables that are owned by the specified account.You can click + or - on the lineage graph to expand or collapse upstream or downstream nodes as required.
View Field Lineage

On the Field Lineage tab, you can view the detailed lineage of the target field. The following information is provided:
You can switch fields in the Change Field area to view the lineage of the selected field.
The number of upstream and downstream nodes for each field lineage node. You can move the pointer over a field or task type to view its basic information.
You can click + or - on the lineage graph to expand or collapse upstream or downstream nodes as required.
Impact Analysis
If the schema or data of a table changes, downstream nodes may be affected. You can use the Impact Analysis feature to identify the affected downstream tables in advance. You can filter the results by lineage level, task type, or table type, and download the analysis results to your on-premises machine.
NoteYou can analyze up to 50 levels of table lineage.
View data preview
Request and manage table permissions
You can use DataWorks Security Center to request query and operation permissions for MaxCompute tables and view your request history in Data Map.
Request table permissions
Go to the table details page and click Request Permissions.
 Note
NoteIf the table is hidden, the Request Permissions button is not displayed.
You are redirected to the Permission Request page in the new Security Center. For more information, see MaxCompute data access control.
Manage table permissions
In the navigation pane on the left, click My Data.
In the navigation pane on the left, click Managed by Me. On the page that appears, you can update the lifecycle and Visibility of the table, or perform operations such as Delete, Transfer, and Modify Category.
Permission approval: You can go to the page to view permission approval details and approval records. For more information, see Data access control.
Manage MaxCompute tables
Manage tables using data albums
You can add the current table to a target data album to manage it on the details page of the album, or view the data albums that the table has joined. For more information, see Data albums.
Configure category navigation management table
In the navigation pane on the left of Data Map, choose Configuration Management > Category Management Configuration to configure category navigation for managing MaxCompute tables. For more information, see Configuration management.