Data Asset Governance (formally Data Governance Center) can detect issues that need to be handled in the data storage, task computing, code development, data quality, and security dimensions based on governance plans. Data Asset Governance provides health scores to assess the effectiveness of data governance and visualizes the governance results by providing governance reports and leaderboards of governance issues from the global, workspace, and individual dimensions. This helps you achieve governance objectives in an efficient manner. Data Asset Governance also provides features such as business asset management, asset analysis, resource consumption details of tasks, and cost estimation to help you better understand the usage details of various resources.
Limits
Editions
Only DataWorks Enterprise Edition or a more advanced edition supports Data Asset Governance. For information about DataWorks editions, see Features of DataWorks editions. For information about how to activate DataWorks, see Purchasing guide.
Regions
Data Asset Governance is available in the following regions: China (Hangzhou), China (Shanghai), China (Beijing), China (Zhangjiakou), China (Shenzhen), China (Chengdu), China (Hong Kong), Singapore, Malaysia (Kuala Lumpur), Indonesia (Jakarta), Germany (Frankfurt), US (Silicon Valley), and US (Virginia).
Permissions
The following table describes the permissions that each role has on Data Asset Governance.
Role
Permission
References
Tenant-level data governance administrator
A tenant-level data governance administrator can view governance reports, governance issues, and check events from the global dimension and perform relevant rectification operations.
For information about how to grant permissions to users, see the Manage tenant-level roles section in the Manage permissions on global-level services topic.
For more information about the permissions of a data governance administrator, see the Data Governance section in the Permissions of built-in workspace-level roles topic.
Workspace administrator
A workspace administrator can view governance reports from the workspace dimension. If you want to view governance reports in a workspace from the workspace dimension, you must be the administrator of the workspace.
For information about how to grant permissions to users, see the Add a RAM user to a workspace as a member and assign roles to the member section in the Manage permissions on workspace-level services topic.
For information about how to view governance reports, see the View a governance report section in the View data governance results topic.
Workspace-level data governance administrator
A workspace-level data governance administrator can view and manage the data governance content of the workspace to which the role belongs.
NoteThis role does not have permissions to view data governance situations of all workspaces in a region from the global dimension or manage global governance operations, such as enabling check items at the global level. If you want to allow a Resource Access Management (RAM) user to perform global governance operations, assign the Data Governance Administrator role at the tenant level to the RAM user. For more information, see Data Governance Administrator role at the tenant level.
For information about how to grant permissions to users, see the Add a RAM user to a workspace as a member and assign roles to the member section in the Manage permissions on workspace-level services topic.
For information about the features supported by the workspace-level data governance administrator role, see the Data Governance section in the Permissions of built-in workspace-level roles topic.
Common user
Common users are the personnel who handle detected issues in Data Asset Governance. A common user can view check events and governance issues from the personal dimension and perform rectification operations. If you want to perform rectification operations on issues that are detected in a workspace of a tenant, you must be added to the workspace as a member.
NoteBy default, except for Alibaba Cloud accounts and RAM users to which the AliyunDataWorksFullAccess policy is attached, all other users are common users within a tenant.
For information about how to grant permissions to users, see the Add a RAM user to a workspace as a member and assign roles to the member section in the Manage permissions on workspace-level services topic.
Only Alibaba Cloud accounts and RAM users to which the AliyunDataWorksFullAccess policy is attached can use all features of Data Asset Governance. If you want to use all features of Data Asset Governance as a RAM user, you must apply for the required permissions. For more information, see the Grant the permissions to perform operations in DataWorks to a RAM user section in the Prepare a RAM user topic.
Data sources
Only MaxCompute, E-MapReduce (EMR), and Hologres data sources support Data Asset Governance.
NoteBefore you can use a Hologres data source in Data Asset Governance, you must first collect metadata of Hologres in Data Map. For more information, see Collect Metadata.
Hologres data sources are supported by Data Asset Governance only in the following regions: China (Beijing), China (Shanghai), China (Hangzhou), and China (Shenzhen).
Data governance logic
Data Asset Governance detects check events based on check items before data development tasks are committed and deployed. Data Asset Governance detects governance issues based on governance items after the tasks are committed and deployed. This helps you handle events and issues that are related to your data in a comprehensive manner. If the check on an item is triggered for a task and the task fails the check, an event is generated. Severe events may block the subsequent data development process. You can view and handle the event in Data Asset Governance. After the event is handled and the task passes the check, you can proceed to the subsequent data development process. The following figure describes the logic of data governance.

DataWorks provides workspaces in standard and basic modes. The task development process varies based on the workspace mode. In this topic, a workspace in standard mode is used to show how to develop a task. The actual task development process varies based on the mode of your workspace. For more information about the common development process in workspaces in different modes, see DataStudio (legacy version).
Run checks based on check items.
Check items are used to check data for violations against check items before tasks are committed and deployed. Before you commit and deploy a task, you can check whether the task violates the check items that you specify for task development by using the check items. If the system detects that the task violates the check items, a check event is generated to block the subsequent task development process. You can handle issues that are related to the check event. This way, the task development process can be executed as expected.
Run checks based on governance items.
Governance items are used to manage and govern tasks after the tasks are committed and deployed. After a task is committed and deployed, you can view governance issues from the global, individual, or workspace dimensions in Data Asset Governance. Data governance engineers can handle detected governance issues and take measures at the earliest opportunity to achieve the objectives of data governance.
Data governance process

Configure governance tools.
Enable a governance plan template and configure custom items.
Operation
Description
References
Configure custom check items
If the check items provided in the template do not meet your business requirements, you can configure custom check items based on your business requirements.
Create a check item for a registered custom extension.
DataWorks also allows you to create check items in Data Asset Governance for a custom extension. After you create such check items, Data Asset Governance detects the check events triggered by the custom extension.
Disable check items.
If the governance plan template contains a check item that is unnecessary for a workspace, you can disable the check item for this workspace. After you disable the check item, Data Asset Governance no longer detects the check event triggered by the check item in the specified workspace.
Configure custom governance item
If the governance plan template contains a governance item that is unnecessary for a workspace, you can create a rule to disable the governance item in the specified workspace. After you disable the governance item, Data Asset Governance no longer detects governance issues based on the governance item in the specified workspace. Detected governance issues are not displayed on the Governance Issue tab.
NoteYou can disable only optional governance items. You cannot disable mandatory governance items or create governance items.
Optional. Configure a governance unit.
DataWorks allows you to perform data governance on multiple workspaces in a centralized manner by creating a governance unit based on your business requirements. Then, you can view statistics on the overall health score, governance issues, and check events for the workspaces within the governance unit. For more information about how to create and manage a governance unit, see Configure a governance unit.
Optional. Configure issue notification methods.
If you want the system to notify specified personnel of detected issues by using system messages, emails, DingTalk group messages, and webhook URLs, you can configure issue notification methods. This way, the specified personnel can view and handle the issues at the earliest opportunity. For more information, see Configure notification settings.
Start a check and handle detected governance issues.
Check data for violations against check items before the data is committed and deployed.
DataWorks performs a check based on check items. Before data is committed and deployed, DataWorks checks the data based on the check items. If the data violates the check items, check events are generated. Then, you can view and handle the check events. For more information, see Handle check events.
Run checks after task deployment.
DataWorks detects governance issues based on governance items. After data is committed and deployed, DataWorks detects governance issues based on the governance items. Then, you can view and handle the governance issues. For more information, see Handle check events.
Run asset 360 checks.
You can use the asset 360 feature to detect, view, and handle governance issues on specified tasks and table. For more information, see Asset 360.
Perform automated governance of materialized views.
Data Asset Governance supports materialized views based on automated governance and intelligent recommendations. This is an intelligent and automated solution for big data computing tasks that need to frequently handle a large number of similar subqueries. For more information, see Materialized views.
If invalid issues are detected in this process, you can add the issues to a whitelist or undeploy related tasks or tables on which invalid issues are detected. For more information, see Add invalid governance issues to a whitelist and Graceful undeployment.
Select an analytical dimension.
Based on use scenarios: DataWorks provides multiple dimensions such as data production, data usage, and data management to help you analyze the effectiveness of data governance and govern data in an efficient manner.
Based on rational use of resources: DataWorks provides statistics on the resource consumption and task running status, the number and storage status of MaxCompute tables, and resource usage overview and details. Data developers and administrators can view and analyze the overall resource situation of a workspace and use resources in a rational manner based on the statistics. For more information about asset analysis, see Asset analysis
View governance results.
After you handle governance issues, you can choose in the left-side navigation pane to go to the Workbench page to view the governance results of the operations that you performed from different dimensions. You can analyze the governance results to identify the dimensions and types of governance issues that frequently occur. This can help you take measures to handle the governance issues and achieve data governance objectives.
Data Asset Governance calculates health scores based on the governance items by using the health assessment model. You can view the health scores on governance reports and governance leaderboards to learn the governance results. A higher health score indicates a better governance result. For more information about health scores, see the Quantitative assessment: health scores section in the Overview topic.
Quantitative assessment: health scores
Health scores are calculated based on the metadata related to user behaviors, data features, and task types of your data assets in the production, transmission, and management processes. Technologies such as data processing and machine learning are used to calculate health scores. You can view the health scores of your data assets from the personal or workspace dimensions. Data Asset Governance provides health scores in the following dimensions based on different metadata: storage, computing, R&D, quality, and security.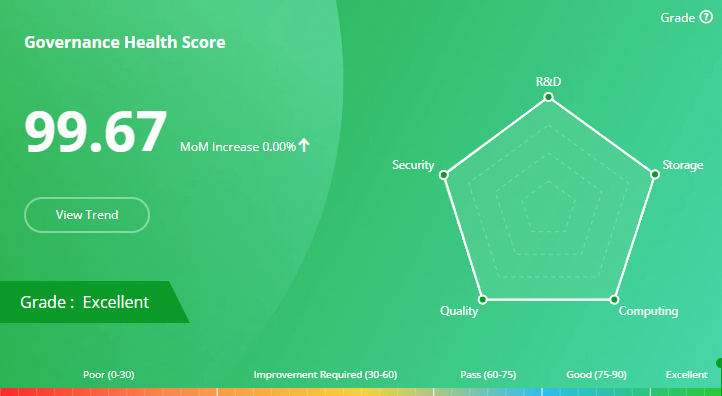
The health scores range from 0 to 100. A higher score indicates healthier data assets. This helps you use data in a secure, efficient, and stable manner and ensures data production and business operation. Data Asset Governance uses a built-in health assessment model to perform a quantitative assessment on the data governance effectiveness of your account and generates an overall health score and a health score for each governance dimension. A higher health score indicates a better governance effectiveness. The following table describes the assessment grades and the health score range for each grade.
Excellent: [90, 100]
Good: [75, 90)
Pass: [60, 75)
Improvement required: [30, 60)
Poor: [0,30)
Terms
Check item: Check items are an active governance mechanism that acts on the data production process. You can use a check item to check tasks for violations against the check item before you start or deploy the tasks to identify potential issues such as full table scans or absent scheduling dependencies. If content that violates the check item is detected, the system generates a check event and intercepts and handles the content. Check items can help you restrict and manage the data development process and ensure the standardization and normalization of data processing.
Governance item: Governance items are used by DataWorks to detect issues that need to be optimized or resolved in data assets during data governance, such as violations against R&D specifications and issues in data quality, security compliance, and resource utilization. Governance items are classified into mandatory governance items and optional governance items. By default, mandatory governance items are globally enabled and cannot be disabled. You can enable optional governance items based on your business requirements. For example, you can use governance items to detect Tasks running time is too long, Continuous error nodes, or No one visits leaf nodes.
Governance issue: Governance issues are detected by DataWorks based on the specified governance items and wait to be handled.
Governance unit: A governance unit consists of one or more workspaces. You can view statistics on the overall health score, governance issues, and check events of the workspaces within a governance unit.
Governance plan: Data Asset Governance provides governance plan templates for different governance scenarios, with a focus on achieving predetermined governance objectives within specific periods. A governance plan template can be used to quickly determine highly relevant governance items and check items and identify objects that can be optimized. This helps governance owners keep a close eye on data governance effectiveness and assists the team in efficiently achieving governance objectives by performing quantitative assessments.
Knowledge base: The knowledge base provides definitions of built-in check items and governance items in Data Asset Governance to help data governance engineers quickly identify and understand issues that occur during data governance. The knowledge base provides solutions to issues and also provides operation guidance to help improve data governance efficiency.