A test instance is generated each time you test an auto triggered task. You can view the details of the test instance in the list of test instances or in the directed acyclic graph (DAG) of the test instance.
Background information
You can test an auto triggered task to check whether the auto triggered task can be run as expected in the production environment. A test instance is generated each time you test an auto triggered task. You can view the details of the test instance on the Test Instance page.
For more information about how to test an auto triggered task, see View and manage auto triggered nodes.
For more information about how to view the details of a test instance in the list of test instances, see Manage test instances in the instance list.
For more information about how to view the details of a test instance in the DAG of the test instance, see Manage test instances in the DAGs of the instances.
The code of the auto triggered task is run during the test. Make sure that the test does not affect your business before you test the auto triggered task.
Limits
Limits on feature usage:
Only users of DataWorks Professional Edition or a more advanced edition can use the intelligent diagnosis feature. If you use another edition, you can use the feature free of charge on a trial basis. However, we recommend that you upgrade the DataWorks service to DataWorks Professional Edition to use more features. For more information, see Intelligent diagnosis.
Only users of DataWorks Professional Edition or a more advanced edition can use the aggregation, upstream analysis, and downstream analysis features provided by DAGs. For more information, see Billing of DataWorks advanced editions.
Some features can be used only by users who are granted O&M permissions. If the entry point of a feature is dimmed or is not displayed, you can go to the SettingCenter page and check whether you are granted the required O&M permissions on the Workspace Members tab of the Workspace Members and Roles page in Management Center. For more information, see Manage permissions on workspace-level services.
Limits on logs and instances:
You cannot manually delete a test instance. DataWorks deletes a test instance about 30 days after the test instance expires. If you no longer need to run a test instance, you can freeze the instance.
Test instances that are run on the shared resource group for scheduling are retained for one month (30 days), and the operation logs for the test instances are retained for one week (7 days).
Test instances that are run on an exclusive resource group for scheduling are retained for one month (30 days), and the operation logs for the test instances are also retained for one month (30 days).
The system regularly clears excess operation logs every day when the size of operation logs generated for the test instances that finish running exceeds 3 MB.
Test an auto triggered task
Go to the Operation Center page.
Log on to the DataWorks console. In the top navigation bar, select the desired region. In the left-side navigation pane, choose . On the page that appears, select the desired workspace from the drop-down list and click Go to Operation Center.
Test an auto triggered task.
In the left-side navigation pane of the Operation Center page, choose . On the Auto Triggered Nodes page, use one of the following methods to test an auto triggered task:
Method 1: In the list of auto triggered tasks, find your desired auto triggered task and click Test in the Actions column. If the current page is not displayed in list mode, you can click the
 icon in the middle of the page. The current page is displayed in list mode.
 Method 2: In the DAG of your desired task, right-click the task and select Test. If the current page is not displayed in DAG mode, you can click DAG in the Actions column of your desired task to open the DAG of the task.
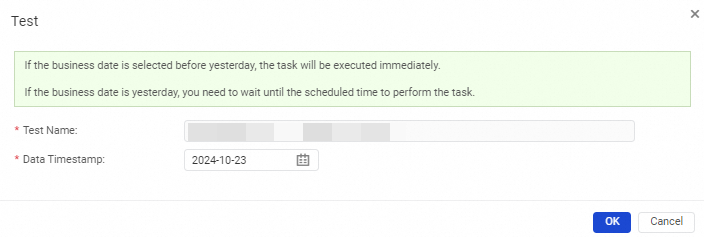
Configure parameters in the Test dialog box.
Parameter
Description
Test Name
The name of the test instance.
Data Timestamp
The data timestamp of the test instance.
NoteIf you select a date earlier than the previous day, the test instance is immediately run.
If you select the previous day, the test instance is run when the scheduling time of the instance arrives.
Manage test instances in the instance list
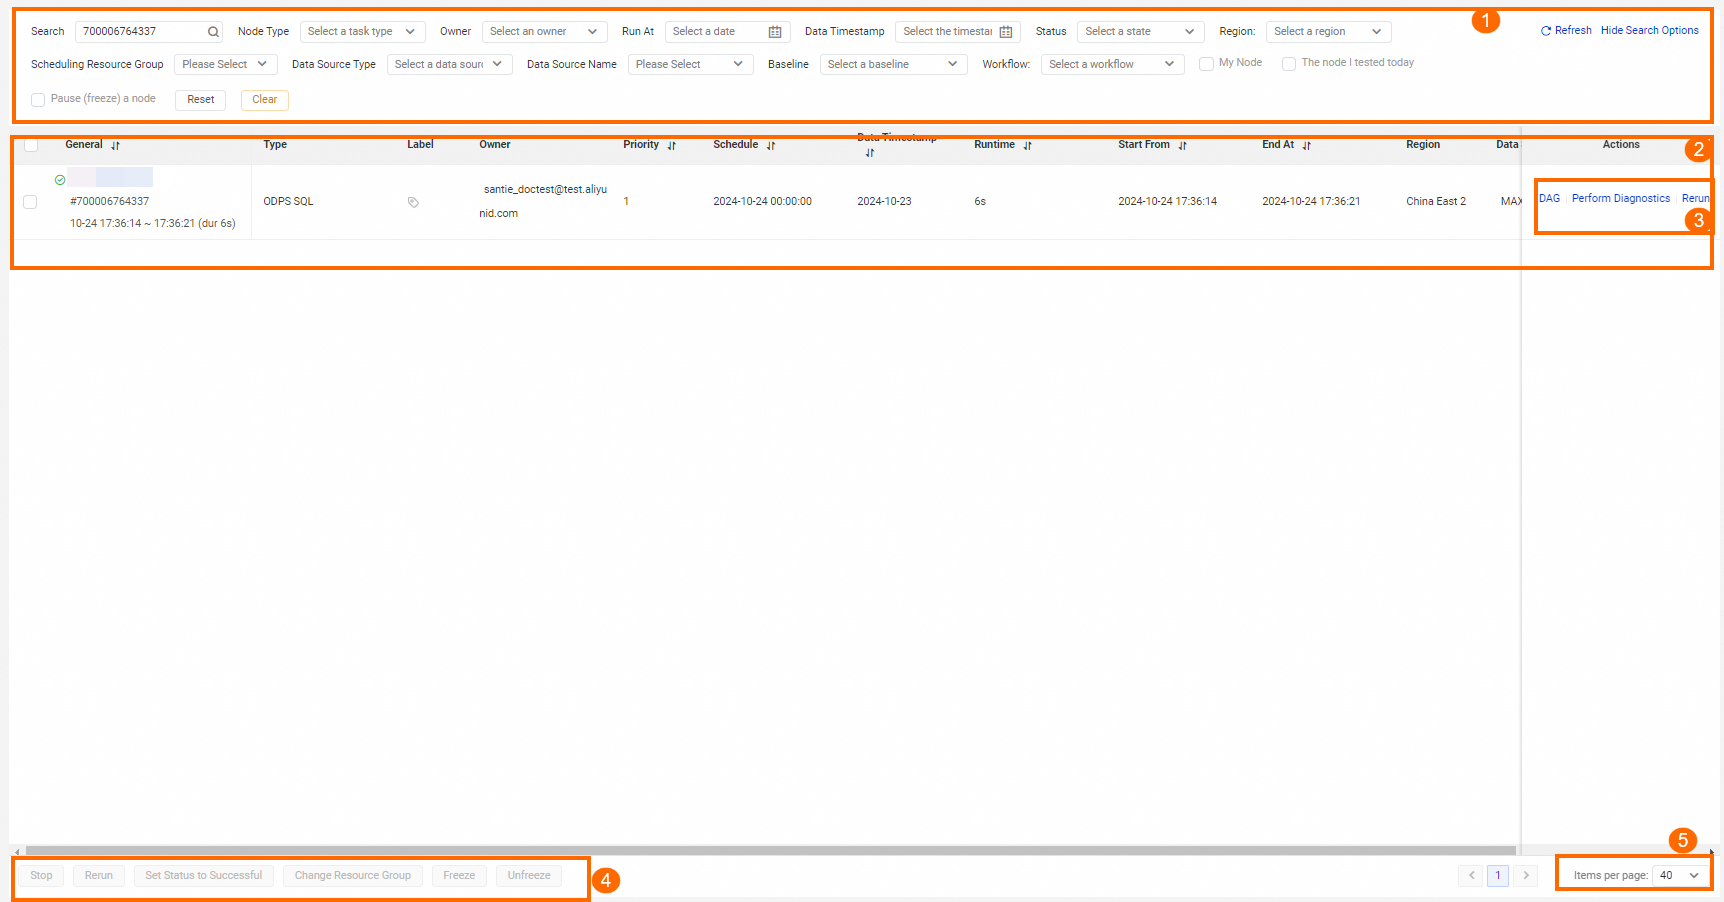
You can view the status of and perform related operations on the test instances that are generated for an auto triggered task in the instance list.
Operation | Description |
Filter | Allows you to specify conditions to search for test instances in the area marked with 1 in the preceding figure. You can search for test instances by task name or task ID. You can also specify the filter conditions to search for test instances: such as Node Type, Run At, Data Timestamp, Scheduling Resource Group, My Nodes, Tested by Me Today, and Frozen Nodes. Note By default, the data timestamp is set to the day before the current day. |
List of test instances | Allows you to view the test instances that meet the specified conditions in the area marked with 2 in the preceding figure. |
Actions | Allows you to perform operations on a test instance in the area marked with 3 in the preceding figure.
|
Batch operations | Allows you to perform operations on multiple test instances at the same time. You can click the following buttons in the area marked with 4 in the preceding figure to perform operations on multiple test instances at the same time: Stop, Rerun, Set Status to Successful, Change Resource Group, Freeze, and Unfreeze. |
Items per page | Allows you to select the number of items that you want to view on a single page in the area marked with 5 in the preceding figure. The maximum number that you can select is 200. |
Manage test instances in the DAGs of the instances
In the list of test instances, you can click the name of a test instance or DAG in the Actions column of a test instance to open the DAG of the test instance. In the DAG, you can right-click the test instance to perform the related operations.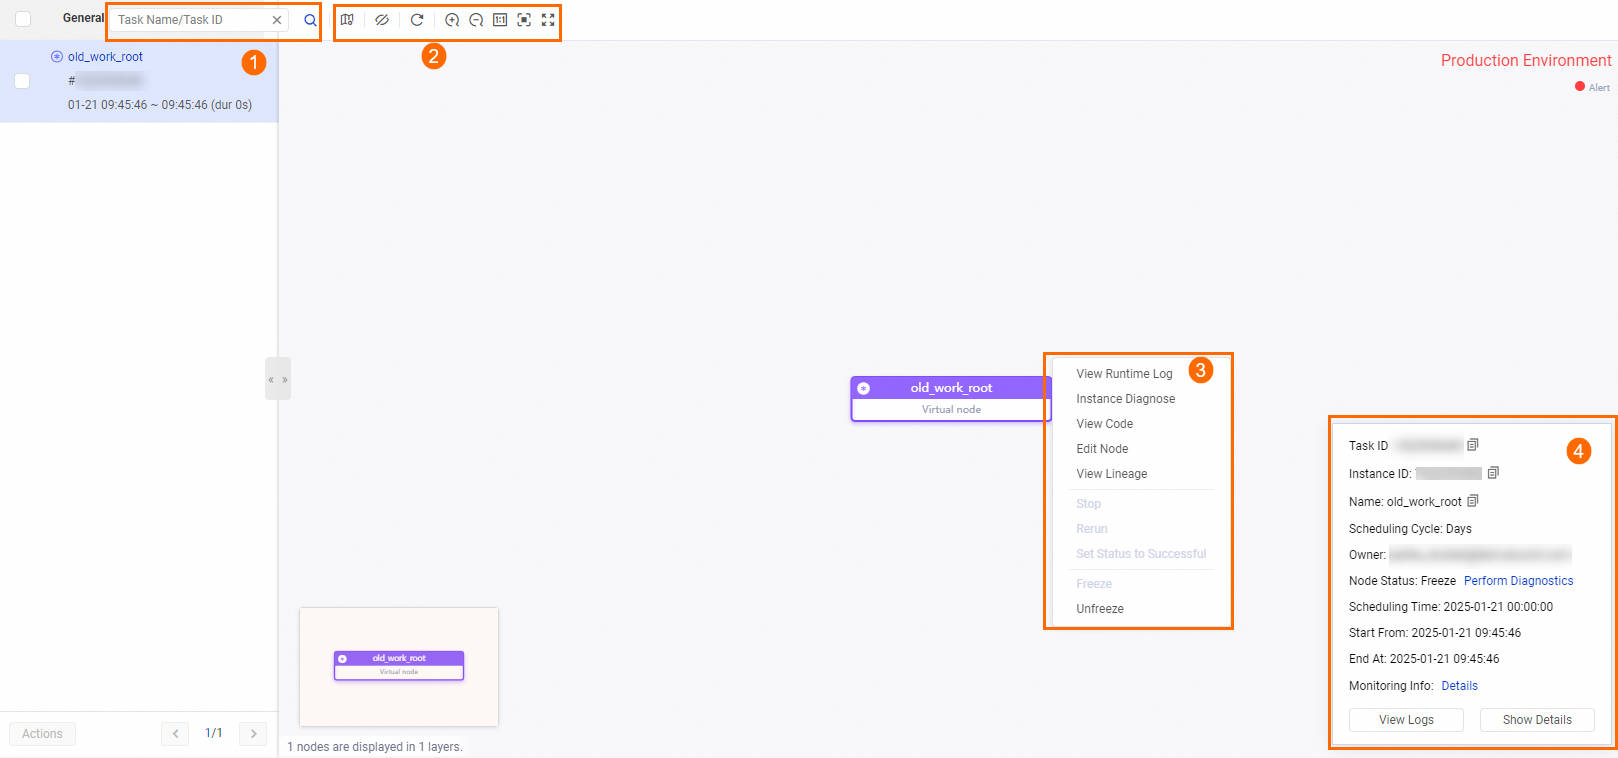
Functionality | Description |
Operations that you can perform in the DAG of a test instance | You can click DAG in the Actions column of a test instance to open the DAG of the test instance. You can perform the following operations in the DAG of the test instance:
|
Operations on a single instance | You can right-click your desired test instance in the DAG and perform operations on the instance.
Note For more information about other operations, see Manage test instances in the instance list. |
Details about a single instance | In the area marked with 4 in the preceding figure, you can perform the following operations:
|
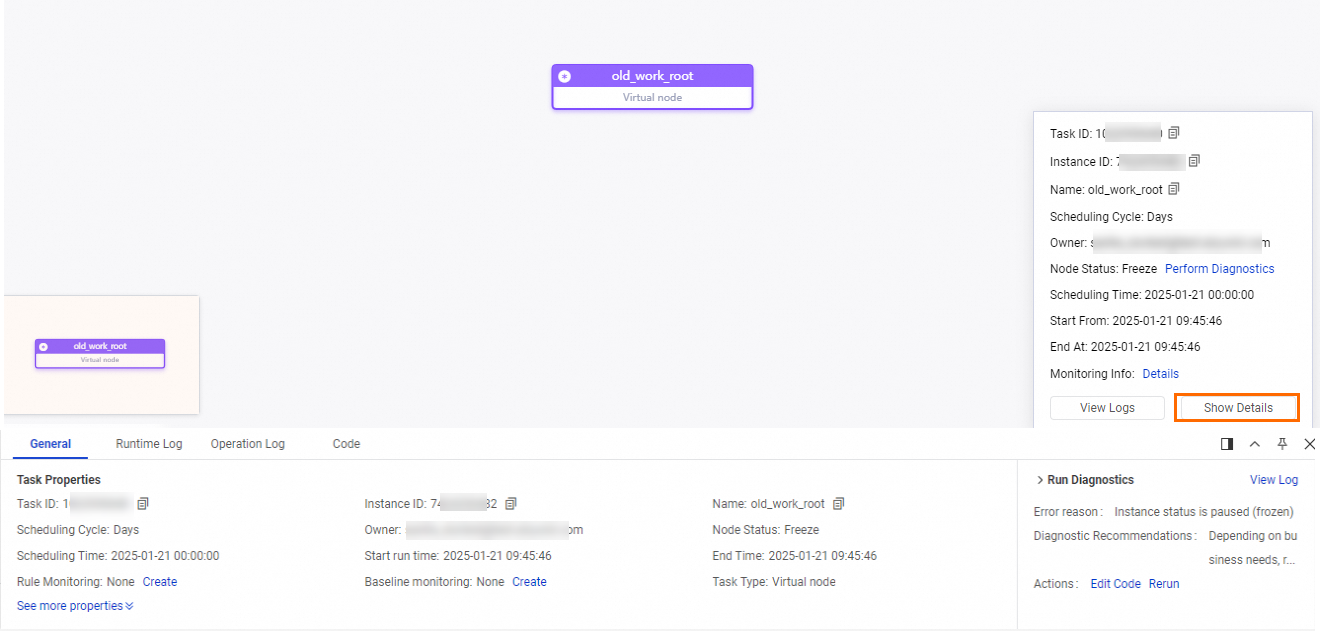
View the details about a test instance
In the DAG of a test instance, you can click the test instance, and then click Show Details in the pane that appears in the lower-right corner of the canvas. Then, you can view the details about the test instance on the following tabs: General, Context, Runtime Log, Operation Log, and Code.
Tab | Description |
General | On this tab, you can view the scheduling properties of a test instance in the production environment. For more information about the basic parameters, see Configure the resource property.
|
Runtime Log | On this tab, after the auto triggered task for which the test instance is generated is started, you can view the execution details of the auto triggered task based on the operation logs. For more information about the core parameters in the logs, see Appendix: Parameters in operation logs. |
Operation Log | On this tab, you can view the operation records of a task or an instance, including the operation time, operator, and specific operations. |
Code | On this tab, you can view the latest code of the task for which the current test instance is generated in the production environment. If the code of the task does not meet your expectations, you must check whether the latest code of the task is successfully deployed to the production environment. For more information, see Deploy nodes. |
Troubleshoot instance running issues
If a test instance is not run as expected, you can use the intelligent diagnosis feature to identify the reason why the instance is not run as expected or identify the issue that occurs on the instance.