Perform basic O&M operations on scheduled tasks
After auto triggered nodes are committed and deployed to the scheduling system, they run periodically based on their scheduling configurations. Use the Cycle Task page in Operation Center to view node status, control execution, respond to failures, and manage node lifecycle.
Prerequisites
Before performing operations described in this topic, ensure that:
-
The auto triggered node is deployed to the scheduling system in the production environment. Only deployed nodes appear on the Cycle Task page.
-
You have the required permissions in the target workspace.
Usage notes
-
Auto triggered nodes generate instances automatically only in the production environment. The development environment does not generate periodic scheduled instances.
-
After modifying node code, scheduling configurations, resources, or functions in the production environment, commit and deploy the changes to make them take effect.
-
If a deployment fails, is blocked, or produces a version that does not meet your requirements, go to the Cycle Task page in Operation Center to troubleshoot. See Manage auto triggered tasks.
Overview
| Operation | Description |
|---|---|
| View auto triggered nodes | View node details and run operations in the node list or the directed acyclic graph (DAG) on the Cycle Task page. |
| Run auto triggered nodes | Understand the three running modes, the conditions a node must meet to run, and how to perform emergency operations when a node is blocked or data quality issues occur on descendant nodes. |
| Manage auto triggered nodes | Deploy and undeploy nodes, control execution (freeze, dry run), configure monitoring and alerting, change resource groups, and update node owners. |
| View operation records | View operation logs, version history, and operation records for a node or its instances. |
View auto triggered nodes
The node list on the Cycle Task page shows all auto triggered nodes deployed to the scheduling system in the production environment. Use it to verify node code, scheduling configurations, scheduling dependencies, and data lineage.
The following nodes are not automatically scheduled:
Nodes that do not depend on any other nodes
Nodes that serve as ancestor nodes of other nodes and also depend on their own descendant nodes
For more information, see Manage auto triggered tasks.
Run auto triggered nodes
Running modes
DataWorks generates auto triggered node instances every night for the next day, based on a snapshot of the node at a specific point in time. To trigger additional instances manually, click Backfill Data or Test in the Actions column.
| Instance type | When to use | How it is generated | How it runs |
|---|---|---|---|
| Auto triggered node instance | Periodic extract, transform, and load (ETL) operations | DataWorks generates instances every night for the next day. | Triggered automatically by DataWorks. |
| Data backfill instance | Backfill historical or future data for the current node and its descendant nodes | Click Backfill Data in the Actions column. | Instances are generated and triggered to run after you submit the backfill request. |
| Test instance | Verify that a node runs as expected | Click Test in the Actions column. The node code runs during the test. | Instances are generated and triggered to run after you submit the test request. |
Conditions for running an auto triggered node
An auto triggered node runs only when all of the following conditions are met:
-
All ancestor nodes have run successfully.
-
The scheduled run time has arrived.
-
Enough scheduling resources are available.
-
The node is not frozen.
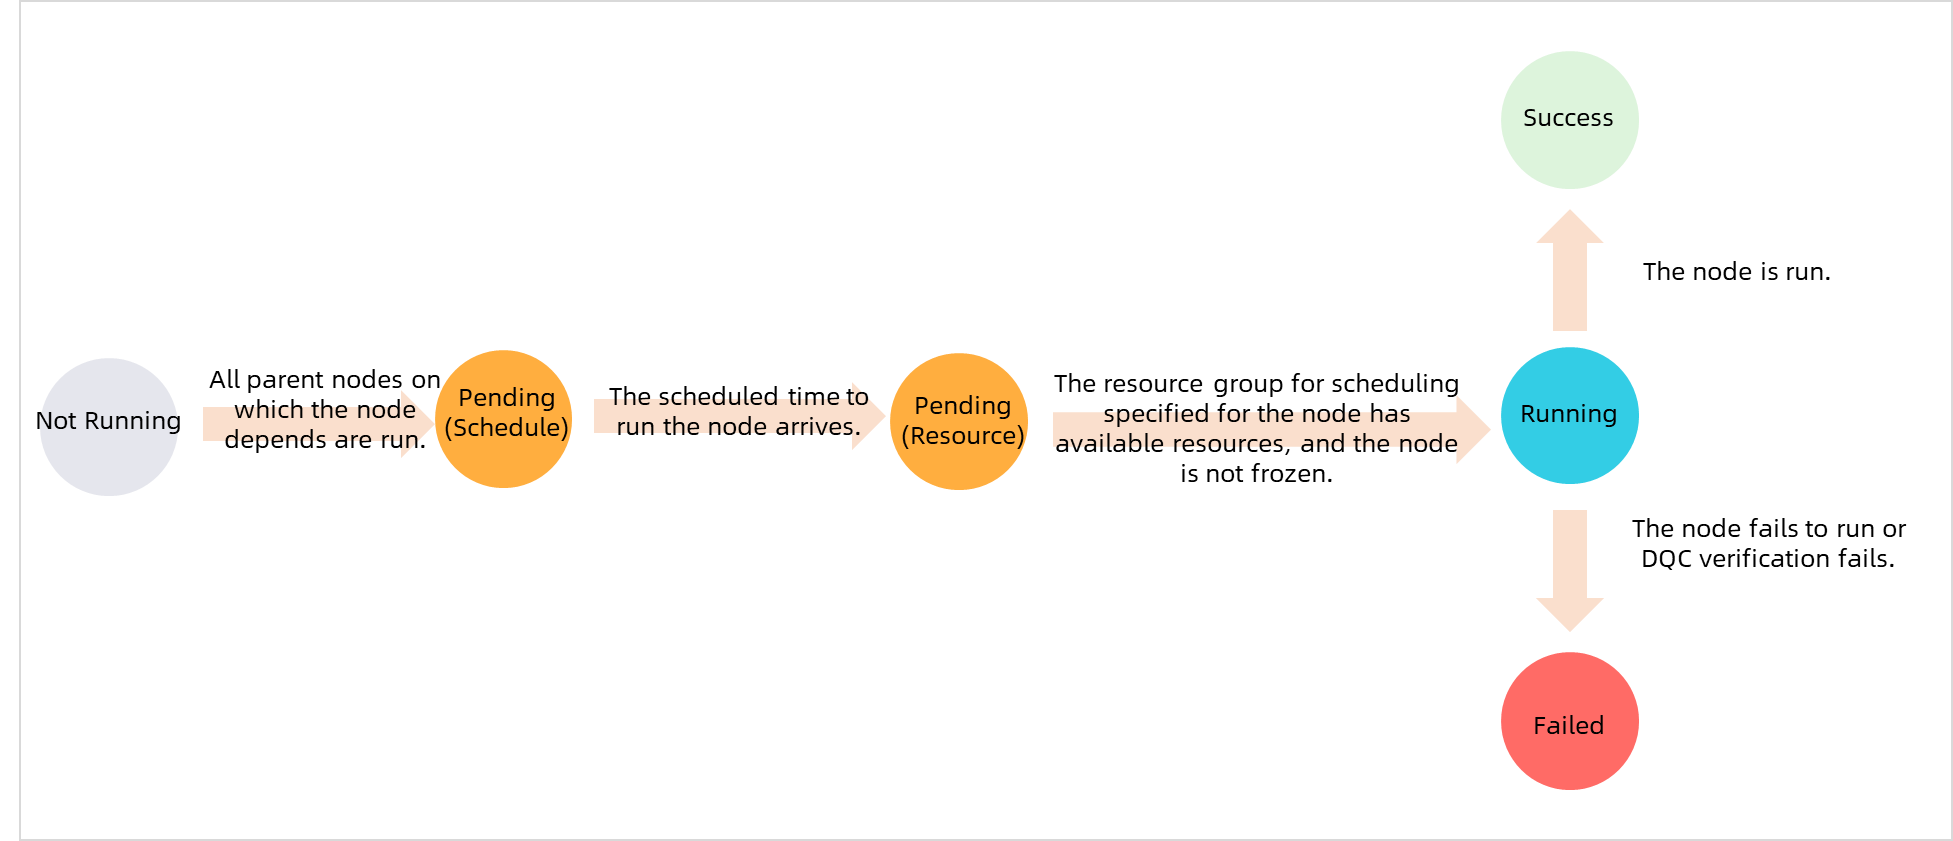
For more information, see Prerequisites for an auto triggered node to successfully run.
Troubleshoot a node that does not run after the scheduled time
Symptom: The scheduled run time arrives, but the node does not run.
Common causes:
-
An ancestor node is still running when the scheduled time arrives.
-
Scheduling resources are insufficient.
-
The node is frozen.
Solution: In the node's DAG, use the upstream analysis feature to identify which ancestor nodes are blocking execution. Then use intelligent diagnosis to diagnose failure causes for those ancestor nodes.
For reference, see:
Emergency operations
Remove a dependency: If an ancestor node is not running and blocks the current node, find the instance on the Cycle Instance page, open its DAG, right-click the instance, and choose Emergency Operations > Delete Dependencies. In the dialog box, enter the name of the blocking ancestor node to remove the dependency.
Before removing a dependency, verify that doing so does not affect the data output of the current node, based on its code and data lineage.
Force rerun: If data quality issues occur on multiple descendant nodes, find the instance on the Cycle Instance page, open its DAG, right-click the instance, and choose Emergency Operations > Force Rerun or Emergency Operations > Force Rerun Descendant Nodes. For more information, see Appendix: Forcefully rerun the descendant instances of an auto triggered instance.
Terminate MaxCompute tasks: In extreme cases such as a server power outage or primary/secondary switchover, DataWorks may not fully terminate MaxCompute task processes. Go to the corresponding MaxCompute project to terminate tasks manually.
Manage auto triggered nodes
Deploy auto triggered nodes
Before a node appears on the Cycle Task page in Operation Center, deploy it to the scheduling system in the production environment. For more information, see Deploy nodes (old-version DataStudio) or Node or workflow deployment (new-version Data Studio).
Stop a node from running: freeze, dry run, or undeploy
Use the following table to decide which option fits your situation.
Do not freeze the projectname_root node. This is the root node of your workspace, and all auto triggered node instances depend on it. Freezing it prevents all instances in the workspace from running.
| Option | Effect on current node | Effect on descendant nodes | Reversible? | When to use |
|---|---|---|---|---|
| Freeze node | All instances generated for this node are frozen and do not run. | Descendant instances cannot run. | Yes — unfreeze the node. | The node and its descendants don't need to run for a period. |
| Freeze instance | The current instance does not run. | Not affected. | Yes — unfreeze the instance. | A single instance does not need to run. Other instances on the same day and later are unaffected. |
| Set Recurrence to Dry Run | The node generates dry-run instances. The system does not run them, generate run logs, or display running duration. | Descendant nodes are not blocked and continue running normally. | Yes — change Recurrence back. | The node doesn't need to produce data, but you don't want to block downstream processing. |
| Undeploy | The node is removed from the scheduling system and moved to the recycle bin. | — | Yes — restore from recycle bin and redeploy. | The node is no longer needed. |
Additional notes on freezing:
-
To stop a node and all its descendants from running for a period, freeze the root node in the relevant workflow.
-
Setting Recurrence to Skip Execution on the DataStudio page has the same effect as freezing in Operation Center. Changes on DataStudio take effect only in the development environment — deploy to the production environment to propagate the change.
For details on the impacts of freezing and unfreezing, see Node freezing and unfreezing.
For information on undeploying nodes, see Undeploy nodes (old-version DataStudio) or Undeploy nodes (new-version Data Studio).
Manage node priorities
Use the baseline management feature to adjust the priority of a node in a baseline. Scheduling resources are allocated to higher-priority nodes first. For more information, see Manage baselines.
Configure monitoring and alerting
Find the node in the node list and configure the following types of monitoring:
-
Node status alerts: Configure a custom alert rule to monitor node status. See Manage custom alert rules.
-
Resource group alerts: Configure a custom alert rule to monitor the resource group used by the node, based on the number of instances waiting for resources or resource usage. See Manage custom alert rules.
-
Data quality monitoring: Configure a data quality monitoring rule to monitor table data generated when auto triggered, backfill, or test instances run. See Overview.
Change the resource group
Change the scheduling resource group or Data Integration resource group used to run a node. For more information, see Change the resource groups used by tasks.
To redefine other scheduling properties, go to DataStudio, open the node's configuration tab, and update the scheduling properties. For batch updates across multiple nodes, use Batch operations. For property details, see Configure basic properties.
Change the node owner
Before changing a node owner, turn on Change Node Owner by RAM User. After it is enabled, workspace administrators can change owners in both environments.
In DataStudio (development environment):
-
Single node: Update the owner in the General section of the Properties tab.
-
Multiple nodes: Use Batch operations.
-
Deploy the node to the production environment after making the change.
In Operation Center (production environment):
-
Single node: Find the node and choose More > Change Owner in the Actions column.
-
Multiple nodes: Select the nodes and click Change Owner at the bottom.
Changing the owner in the production environment also updates the owner in the development environment.
View operation records
| Entry point | What you can view |
|---|---|
| Operation Log tab on the DAG page of a node or instance | Operation records for the node or instance. |
| Versions tab on the DataStudio page | Compare an existing version with the production version to identify changes. See Deploy nodes (old-version DataStudio) or Node or workflow deployment (new-version Data Studio). |
| Operation History page in Operation Center | Operation records for a node, an instance, or a baseline. See View Operation Center operation records. |
FAQ
For common questions about auto triggered node operations, see FAQ about auto triggered nodes.