This topic describes how to troubleshoot a node that does not run as expected.
Limitations
Automatic scheduling is supported only in Operation Center for the DataWorks production environment. Ensure that the node has been published to the production environment. For more information, see Publish tasks.
Node run conditions
In Operation Center, instances are identified by different statuses.
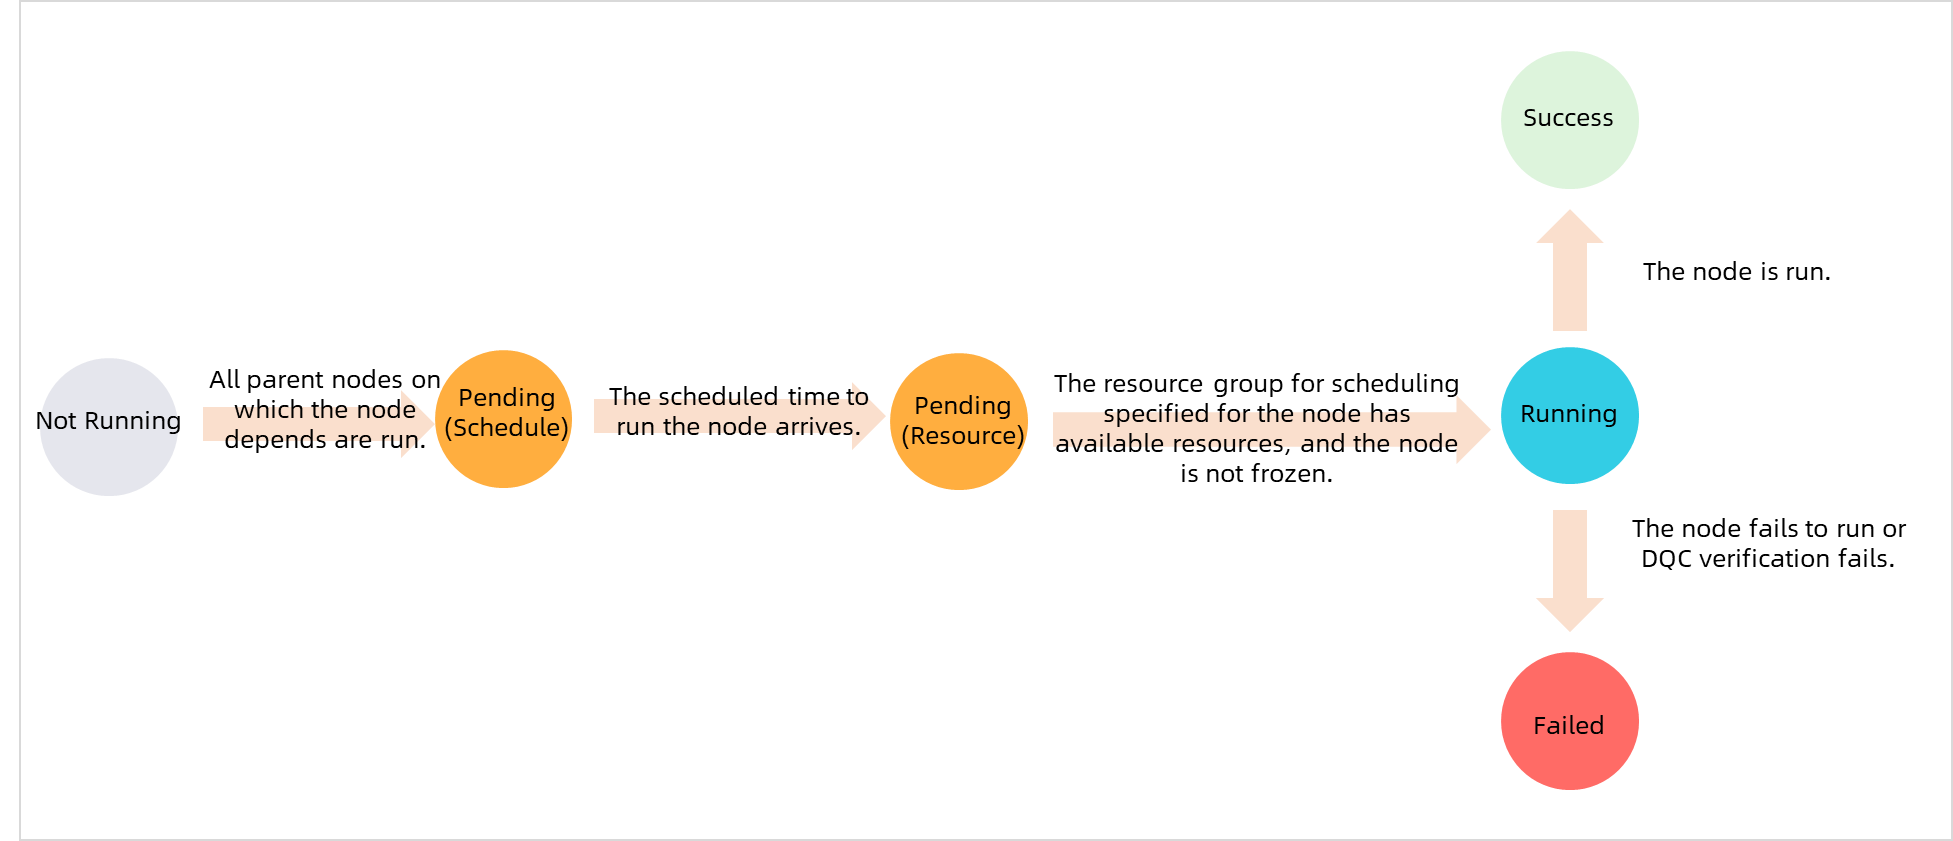
A scheduled node runs only if the following conditions are met: scheduling resources are available, the scheduling time has arrived, all ancestor nodes have run successfully, and the node's scheduling is not paused or frozen.
|
No. |
Status |
Icon |
Flowchart |
|
1 |
Run Successfully |
|
|
|
2 |
Not run |
|
|
|
3 |
Failed To Run |
|
|
|
4 |
Running |
|
|
|
5 |
Wait time |
|
|
|
6 |
Freeze |
|


- Purple (Frozen): The instance is frozen. The node will not run and will block its downstream nodes. You can click Show Details > Operation Logs to view related records.
- Yellow (Waiting): The node is waiting for its scheduling time. Click Show Details in the lower-right corner and check the Attribute tab for more information.Note
- If the status is Waiting for Resources, the number of running nodes in the current project has reached the upper limit. You can right-click the instance and check the scheduling resources section in the Instance Diagnose pane to see which nodes are consuming resources. For more information, see Waiting for resources.
- If the status is Waiting for Scheduling Time, the scheduling time of the instance has not yet arrived.
- Gray (Not run): Right-click the gray instance to check the status of its ancestor nodes. Use Run Diagnostics and Upstream Analysis.
- Blue (Running): The instance is running. If the node does not run successfully after a long period, see Waiting for resources.Note If no ancestor nodes are in any of the preceding states and the entire workflow is gray, the dependencies of the ancestor nodes may have changed, isolating the workflow. For more information, see Scenario: Isolated node.
Reasons for delayed execution
- Symptom
When an auto triggered instance runs, its scheduling time may not be the same as its actual start time. A node may not run even after its scheduling time has passed.
For example, for an ODPS SQL node instance, the scheduling time is2022-04-07 00:08:00, the time it starts waiting for resources is2022-04-07 00:59:50, and the start time is2022-04-07 01:21:02. The instance waited for resources for 21 minutes and 12 seconds, showing a significant time gap between the three timestamps. - TroubleshootingFirst, use the ancestor node analysis feature to locate the key instance that is blocking the current node. Then, use intelligent diagnosis to analyze why the node is blocked and quickly identify the issue.A node in DataWorks may not run for one of four common reasons. The following examples use a three-level dependency for illustration. The logic applies to more complex dependencies as well.
- Scenario 1: Not all ancestor nodes have run successfully (Node status: Gray Not Run).
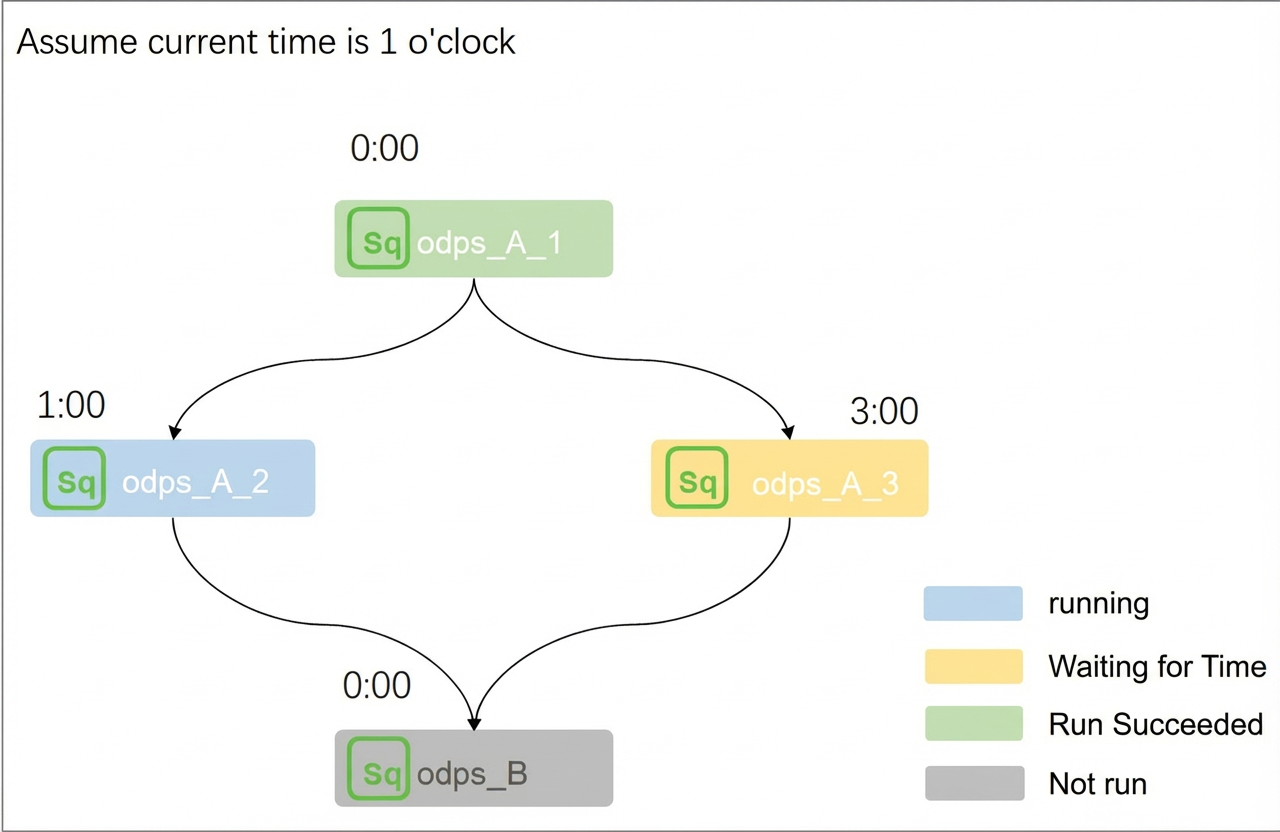
Scenario: Assume the current time is 01:00. Node A2 is scheduled for 01:00, Node A3 for 03:00, and Node B for 00:00. Node B depends on nodes A2 and A3.
Analysis: The scheduling time for Node B (00:00) has already passed. However, because its ancestor nodes have not yet reached their scheduling times, Node B must wait for both Node A2 and Node A3 to run and succeed. If either A2 or A3 fails, Node B will not run. Therefore, the current instance status of Node B is Not Run.
Conclusion: A node runs only after all its ancestor nodes have run successfully.
Note If an ancestor node remains in the running state for an extended period, refer to the following solutions.- If a non-batch synchronization node remains in the running state and you want to find the specific cause, get support on DingTalk. First, click this link to join the "Alibaba Cloud Big Data & AI Platform" group. Then, scan the QR code to join the DataWorks product group, where you can ask the intelligent assistant or on-duty staff for help.

- If a batch synchronization node remains in the running state, it may be waiting a long time for execution resources, or some logic may be processing slowly. For more information, see How to troubleshoot long-running batch synchronization nodes.
- If a non-batch synchronization node remains in the running state and you want to find the specific cause, get support on DingTalk. First, click this link to join the "Alibaba Cloud Big Data & AI Platform" group. Then, scan the QR code to join the DataWorks product group, where you can ask the intelligent assistant or on-duty staff for help.
- Scenario 2: The node's scheduling time has not arrived (Node status: Yellow Waiting for Scheduling Time).
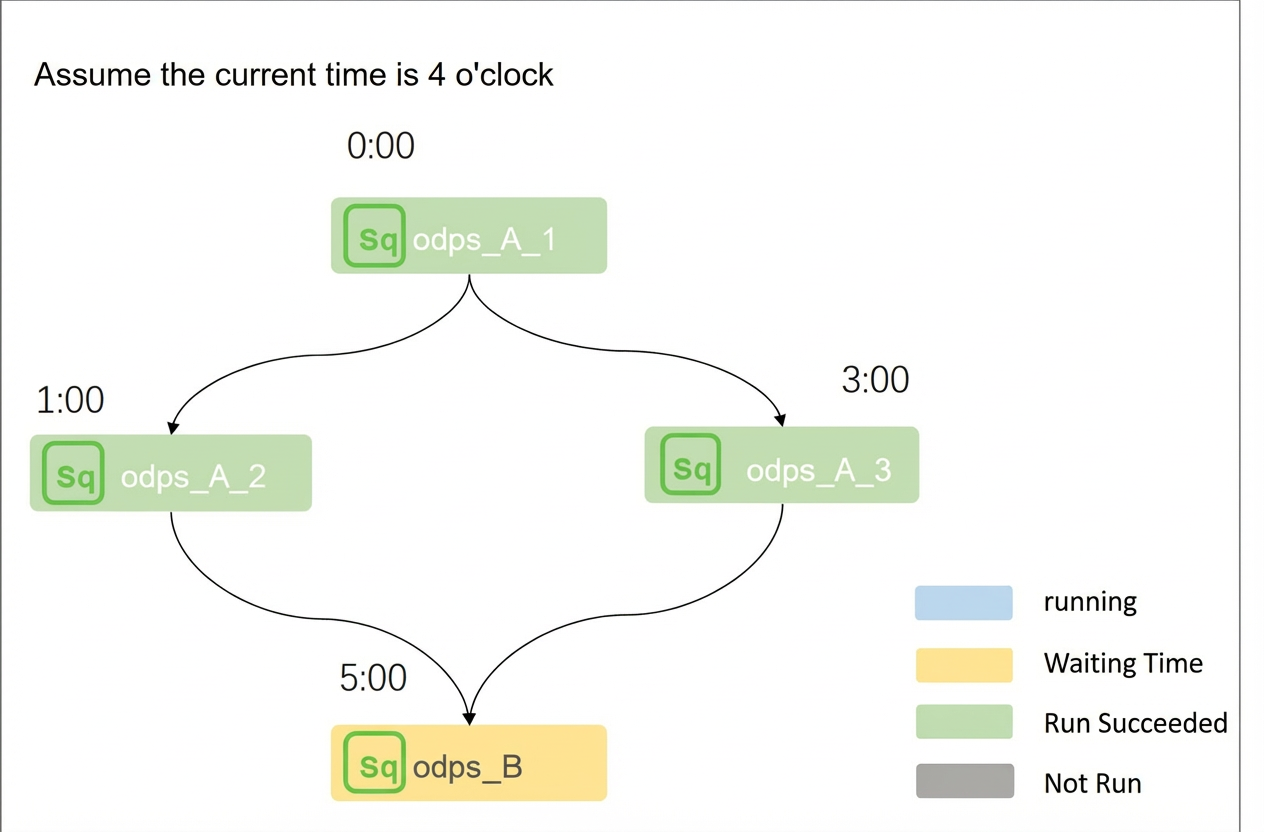
Scenario: Assume the current time is 04:00. Node A2 is scheduled for 01:00, Node A3 for 03:00, and Node B for 05:00. Node B depends on nodes A2 and A3.
Analysis: The ancestor nodes A2 and A3 have already run successfully. However, because Node B's scheduling time (05:00) has not yet arrived, its current instance status is Waiting for Scheduling Time.
Conclusion: A node runs only after its scheduling time has arrived.
- Scenario 3: Insufficient scheduling resources in the project (Node status: Yellow Waiting for Resources).
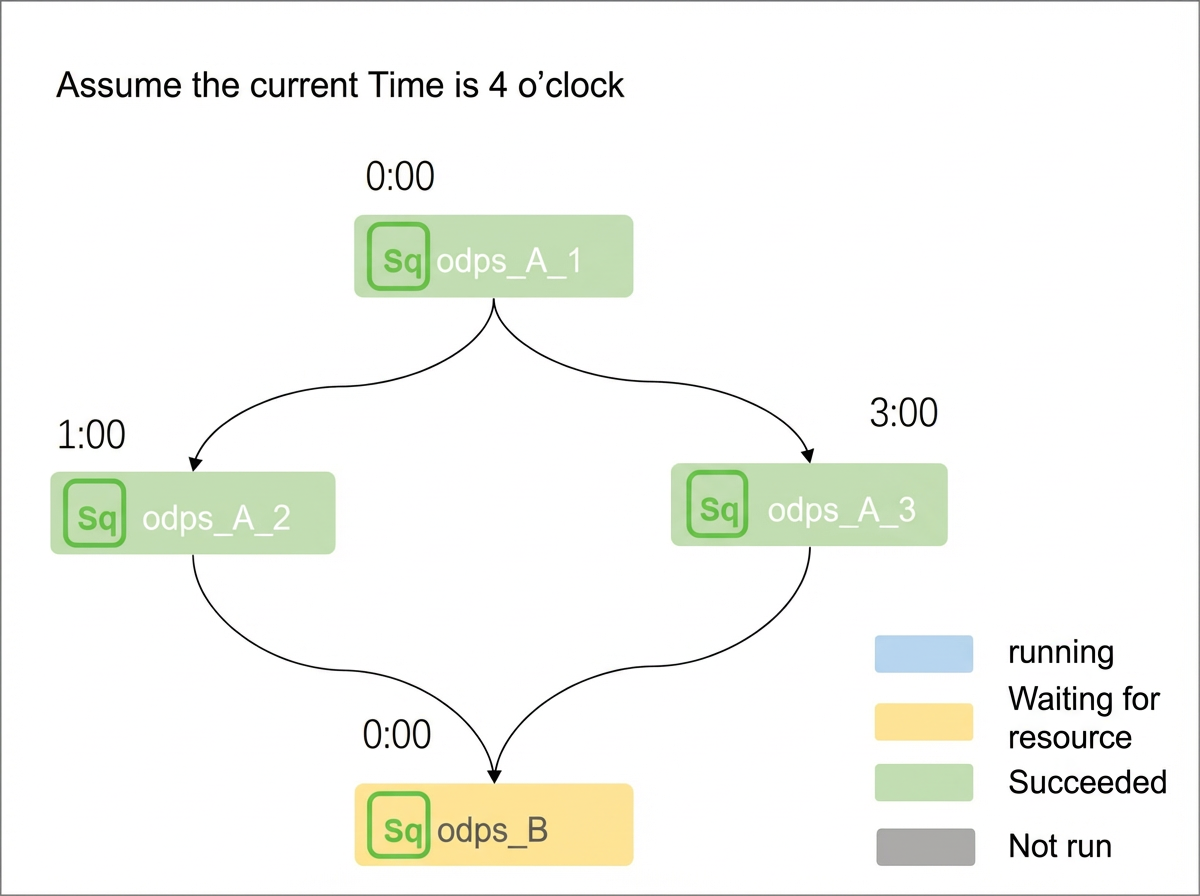
Scenario: Assume the current time is 04:00. Node A2 is scheduled for 01:00, Node A3 for 03:00, and Node B for 00:00. Node B depends on nodes A2 and A3.
Analysis: The scheduling time for Node B has passed, and its ancestor nodes A2 and A3 have run successfully. However, the node's resource group has insufficient resources, so the node cannot obtain scheduling resources to run. Therefore, its current instance status is Waiting for Resources.
Conclusion: A node runs only when sufficient scheduling resources are available. (When a node is in the waiting for resources state, the log indicates that the concurrency limit for nodes in the project has been reached and the node is waiting for gateway resources.)
Note If the node runs on an exclusive resource group, you can view the exclusive resource group in the DataWorks console. Check Resource Groups to view the running nodes and resource watermark. Alternatively, you can right-click the instance and use the intelligent diagnosis feature to see which nodes are consuming resources while the current node is waiting. For more information, see Waiting for resources. - Scenario 4: The node is frozen (Node status: Purple frozen).
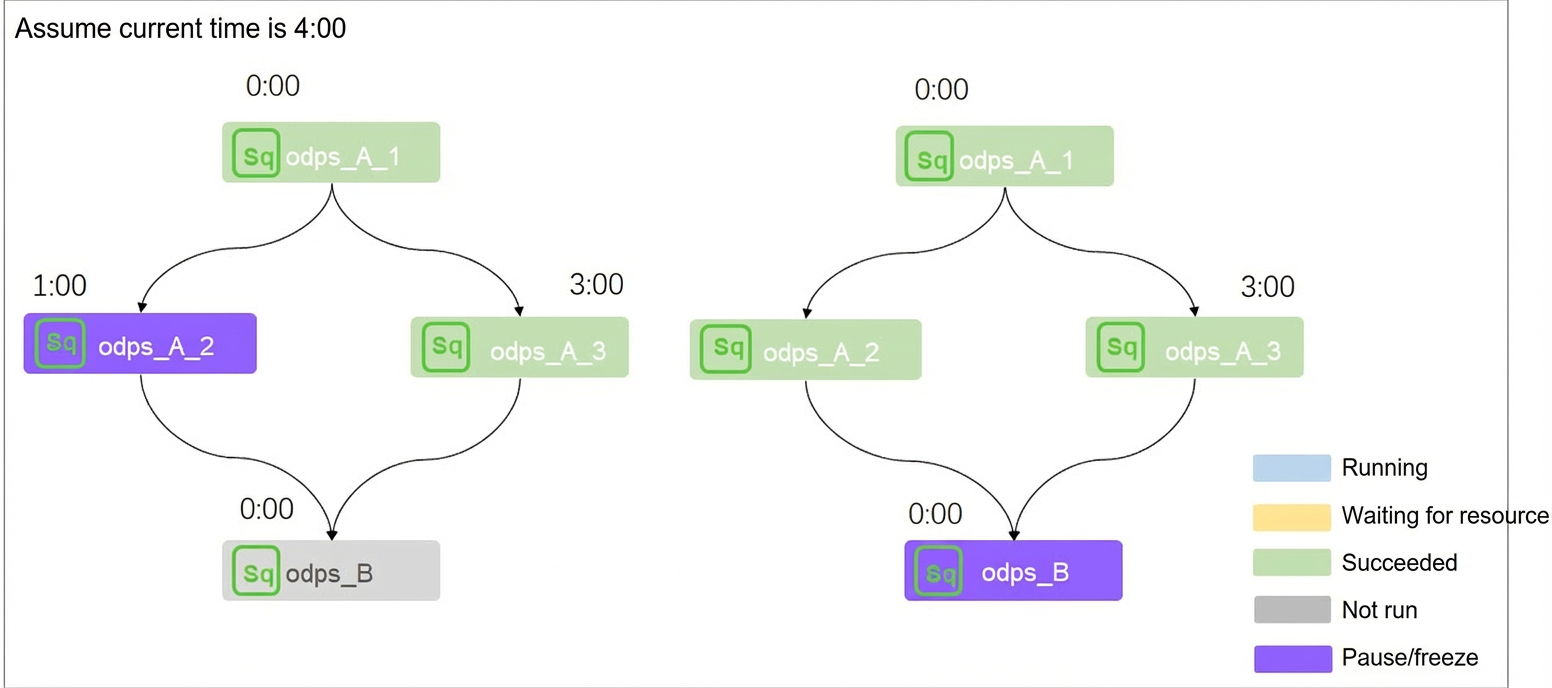
Scenario: Assume the current time is 04:00. Node A2, scheduled for 01:00, has its scheduling paused. Node A3 is scheduled for 03:00, and Node B is scheduled for 00:00. Node B depends on nodes A2 and A3.
Analysis: As explained in the first scenario, a node can run only after all its ancestor nodes have run successfully. In the left diagram, Node B will not run because its ancestor node A2 is frozen. In the right diagram, Node B will not run because it is frozen, even though its ancestor nodes have run successfully.
Conclusion: A node will not run if it or any of its ancestor nodes are frozen.
- Scenario 1: Not all ancestor nodes have run successfully (Node status: Gray Not Run).