A test instance is generated when you run a test on a scheduled task. On the test instance page, you can view the instance details in a list or a DAG.
Introduction
You can run a test on a scheduled task to verify that its scheduling and execution meet expectations in the production environment. This generates a test instance, letting you monitor its run status on the test instance page.
-
For more information about testing a scheduled task, see Manage scheduled tasks.
-
For more information about viewing test instance details in list view, see View the list of test instances.
-
For more information about viewing test instance details in a DAG, see Test instance DAG.
Running a test instance executes the actual code logic. Proceed with caution.
Limitations
-
Feature limitations:
-
DataWorks Professional Edition and higher provide the following advanced features to improve your development and O&M efficiency. For more information, see Editions and billing.
-
Run Diagnostics: Helps you quickly locate task run issues. This feature is available for a free trial. For more information, see intelligent diagnosis.
-
Advanced DAG analysis: Includes node aggregation, upstream analysis, and downstream analysis to help you gain insights into complex task lineage.
-
Export Query Results: Allows you to use data for external reports or further analysis.
-
-
Only users with O&M permissions can use some features. If a feature is grayed out or unavailable, go to the Management Center overview page. In the navigation pane on the left, click , and on the Workspace Members tab, verify that the target user has O&M permissions. For more information, see Manage permissions for workspace-level modules.
-
-
Log and instance limitations:
-
You cannot manually delete test instances. Instances are automatically deleted by the platform after they expire (approximately 30 days). If a task no longer needs to run, you can freeze the instance.
-
For shared resource groups for scheduling, instances are retained for one month (30 days) and logs are retained for one week (7 days).
-
For exclusive resource groups for scheduling, task instances and logs are retained for one month (30 days).
-
Logs of completed instances that exceed 3 MB are cleaned up on a daily basis.
-
-
After you configure the maximum number of concurrent instances for a task, test instances are also subject to this limit and share the concurrency quota with scheduled instances and backfill instances. When multiple types of instances are queued simultaneously, only backfill instances that are not for the current day have their priority downgraded (from 8 to 3).
Run a test and generate a test instance
-
Go to Operation Center.
Log on to the DataWorks console. In the top navigation bar, select the desired region. In the left-side navigation pane, choose . On the page that appears, select the desired workspace from the drop-down list and click Go to Operation Center.
-
Run a test on a scheduled task.
On the Operation Center page, in the left-side navigation pane, click . On the Auto Triggered Node page, you can run a test on a scheduled task by using one of the following methods.
-
Method 1: In the list view of scheduled tasks, click Test in the Actions column of the target task. If the current page is not in list view, click the
 icon in the middle of the page to return to list view.
 -
Method 2: In the DAG view, right-click the DAG of the target instance and click Test from the context menu. If the current page is not in DAG view, click DAG in the Actions column of the target instance to open the DAG of the task.
-
-
Configure the parameters in the Test dialog.
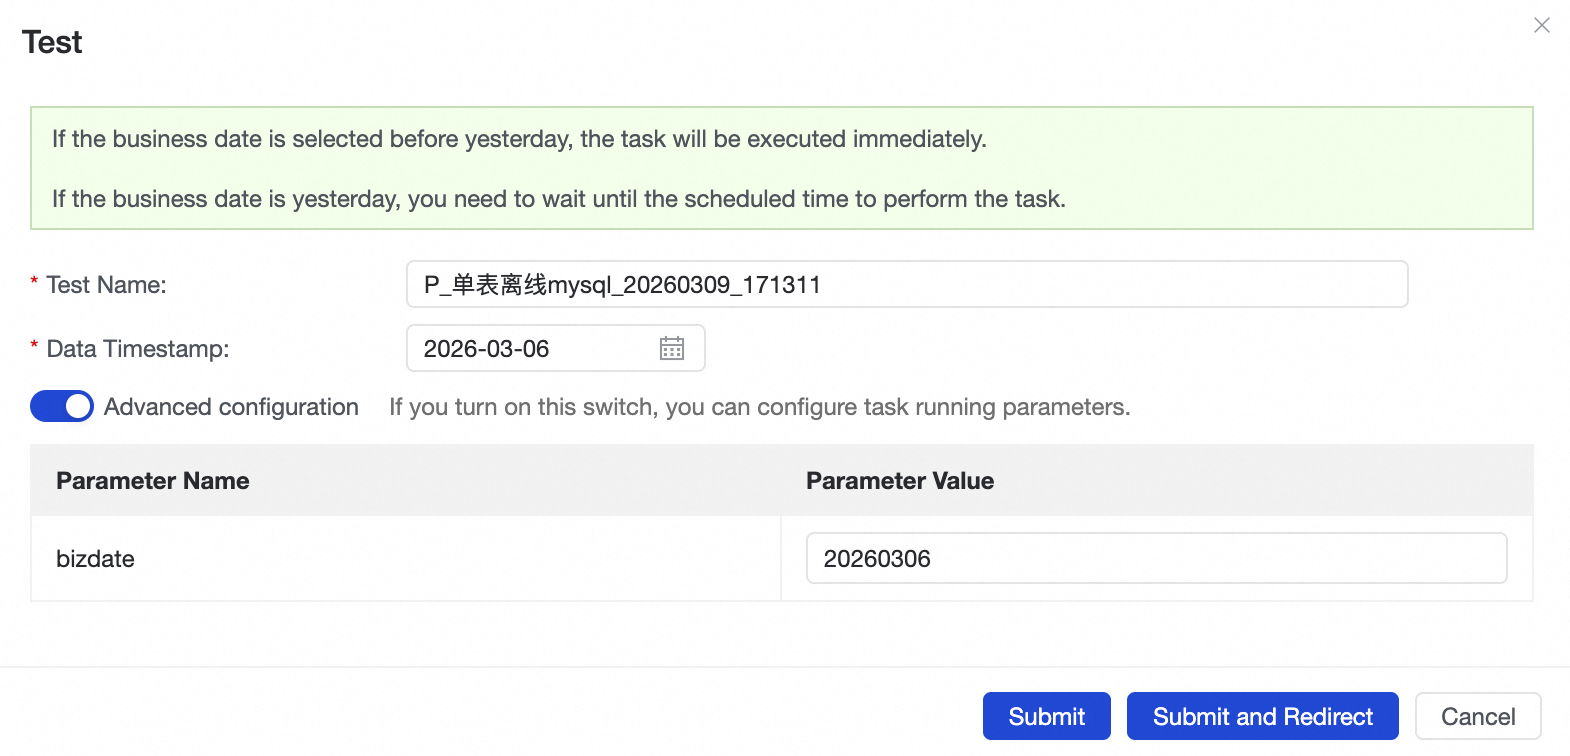
Parameter
Description
Test Name
You can enter a name for the smoke testing.
Data Timestamp
Select the business date for the test.
Note-
If you select a business date earlier than yesterday, the task runs immediately.
-
If you select yesterday as the business date, the task runs at the scheduled time.
Advanced configuration
After you enable advanced settings, you can assign values to scheduling parameters. The assigned values take effect only for the current test.
-
View the list of test instances
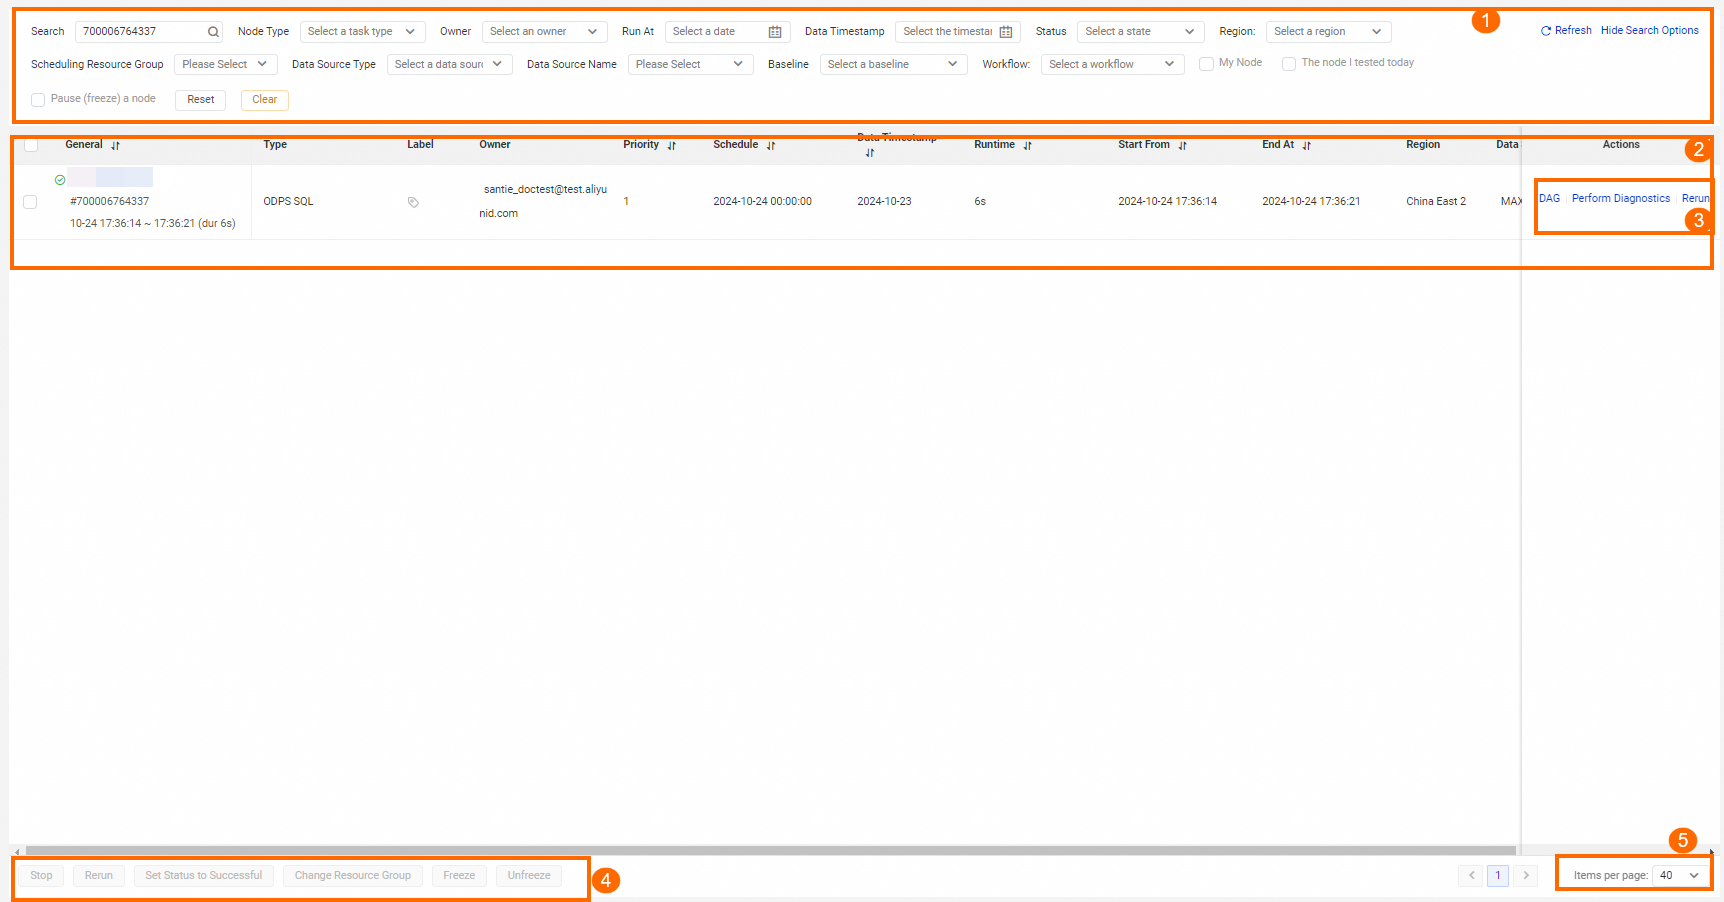
The test instance list displays test instances generated after you run tests on scheduled tasks. You can view the execution status of test instances and perform related operations on them.
|
Operation |
Description |
|
Filter |
In area 1 of the preceding figure, you can use filter conditions to filter out the instances you want to query. You can filter instances by Node Name, Node ID, Task type, Run At, Data Timestamp, Scheduling Resource Group, My Node, The node I tested today, and Pause (freeze) a node. Note The default business date for filtering is the day before the current date. |
|
Tasks |
In area 2 of the preceding figure, test instances that meet the filter conditions are displayed in a list. |
|
Actions |
In area 3 of the preceding figure, you can perform the following operations on test instances:
|
|
Batch operations |
In area 4 of the preceding figure, you can select multiple tasks in batches and perform operations such as Terminate, Rerun, Set to Successful, Change Resource Group, Freeze, Unfreeze, and Export Query Results. |
|
Items per page |
In area 5 of the preceding figure, you can change the number of items displayed per page. A maximum of 200 items can be displayed per page. |
Test instance DAG
In the list view, click the Test Instance name or click DAG in the Actions column to open the DAG of the instance. You can right-click an instance in the DAG to perform related operations. 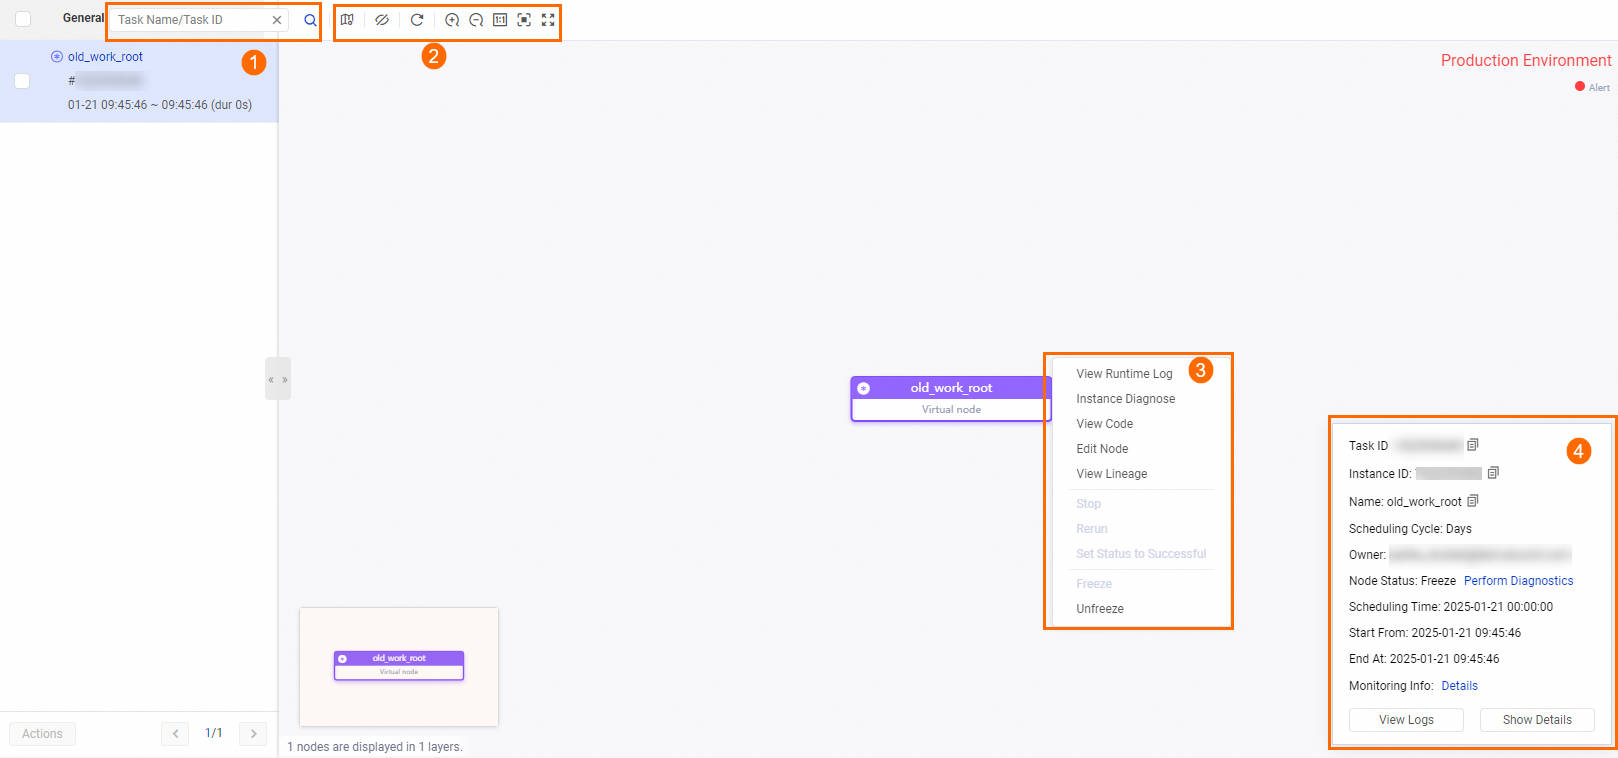
|
Feature |
Description |
|
DAG panel features |
Click DAG next to a task to open its DAG. You can perform the following operations in the DAG:
|
|
Single instance operations |
Right-click the target node to perform related operations.
Note For other operations, see View the list of test instances. |
|
Single instance details |
In area 4 of the preceding figure, you can perform the following operations:
|
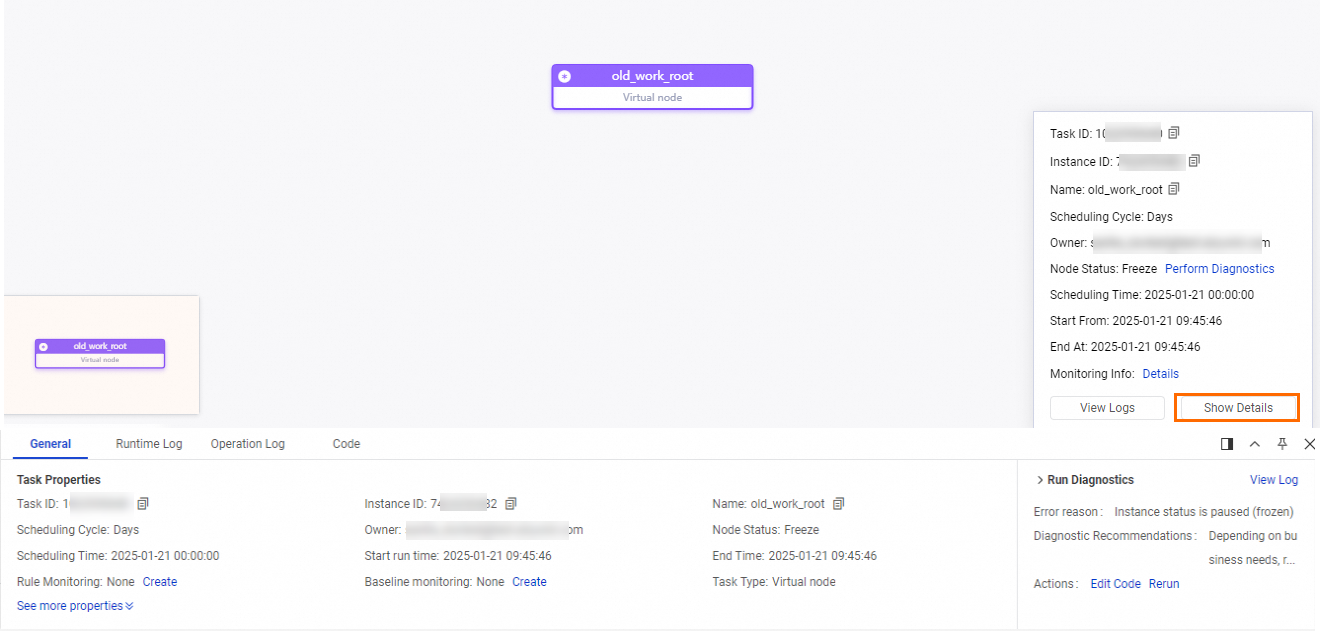
View instance details
In the DAG view, click the target instance. In the window that appears in the lower-right corner, click Show Details. The instance details page appears, where you can view detailed information about the current instance, including properties, context, runtime log, operation log, and code.
|
Feature |
Description |
|
General |
On this tab, you can view the scheduling properties of the task in the production environment. For descriptions of the parameters on the page, see Configure schedule settings.
|
|
Runtime Log |
After a task starts running, you can view its detailed execution process in the runtime log. For descriptions of key parameters in the logs, see Runtime log parameters. |
|
Operation Log |
Used to view the operation records of a task or instance, including the time, operator, and specific operation. |
|
Code |
Used to view the latest code of the current task in the production environment. If the code does not meet expectations, check whether the latest version of the task has been deployed successfully. For more information, see Deploy nodes. |
Troubleshoot task run issues
If a task does not run as expected, you can use the intelligent diagnosis feature to diagnose the reasons why the task did not run or identify issues.