The toolbar is located at the top of the canvas editor. It lets you switch between the canvas and blueprint, apply beautification effects and filters, search for layers, instructions, widgets, and design library assets, and refresh the canvas.
Preparations
Prerequisites
You have created a data dashboard. You can create a dashboard from a template, create a dashboard from a blank canvas.
Enter the canvas editor
Before you use the toolbar, enter the canvas editor.
Access the DataV console.
-
On the All Applications page, hover over the target data dashboard and click Edit to open the canvas editor.
Beautification toolbox
In the toolbar above the canvas, click Beautify to open the Beautification toolbox.
The Beautification toolbox provides two core features: Smart Theme and One-click Beautification. Smart Theme lets you switch the color scheme and text style of dashboard widgets with one click. It includes multiple professional color themes and supports custom themes. One-click Beautification lets you quickly adjust the layout of your data dashboard and enrich its content with built-in styles.
Filter configuration
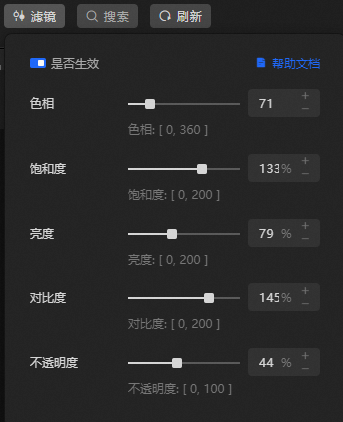
The filter configuration feature lets you adjust the colors of your data dashboard. You can fine-tune parameters such as hue, saturation, brightness, contrast, and opacity.
-
In the toolbar above the canvas, click Filter to open the Filter Configuration panel. Click any blank area to close the panel.
If the Enable switch is off, you can only view the configuration items in the Filter Configuration panel. You cannot modify them.
-
In the Filter Configuration panel, you can modify the widget's Hue, Saturation, Brightness, Contrast, and Opacity.
As you make changes, you can preview the filter effects on the widget in real time on the canvas.
-
When you are finished, click any area on the canvas outside the filter configuration panel to apply the changes.
Global search
In the toolbar above the canvas, click Search. You can then enter a symbol to search for content or view the performance statistics of the data dashboard.
The global search feature lets you search for and add widgets, layers, fonts, global variables, design library assets, and instructions. You can also view summary information for the widgets, variables, fonts, and data source requests in the current dashboard, and batch replace fonts across widgets.
|
Related operations |
Description |
|
Enter |
Search for widgets in the Widget Library. Click or drag a widget to add it to the canvas. |
|
Enter |
Search for layers in the current canvas. Click a layer to quickly locate it. |
|
Enter |
Search for fonts used in the current canvas. You can see the number of widgets that use each font. Click the Note
The |
|
Enter |
Search for global variables in the current canvas. Click a variable to quickly locate it. |
|
Enter |
Search for assets in the Design Library. Click or drag an asset to add it to the canvas. |
|
Enter |
View keyboard shortcuts for instructions, such as Refresh Canvas, Select All, Undo, and Save. Note
Some instructions take effect immediately when you click them. The actual interface determines the specific behavior. |
|
View performance statistics |
Click View Page Statistics to see statistics for the widgets, blueprint nodes, interactive connections, data requests, and fonts in the current dashboard. Click an underlined number to go to the corresponding search feature. |
Common management
The toolbar also provides editor switching, theme settings, and other management features.
Switch editors
In the toolbar above the canvas, click the  and
and  icons to switch between the Canvas and Blueprint pages.
Refresh the canvas
In the toolbar above the canvas, click the  icon to refresh the current canvas.
Show or hide the settings panel
Click the  icon in the toolbar above the canvas to open or close the right-side panel.
Theme settings
On the toolbar above the canvas, you can click the  icon or the
  icon to switch between the Dark Theme and the Light Theme.
Error message prompts
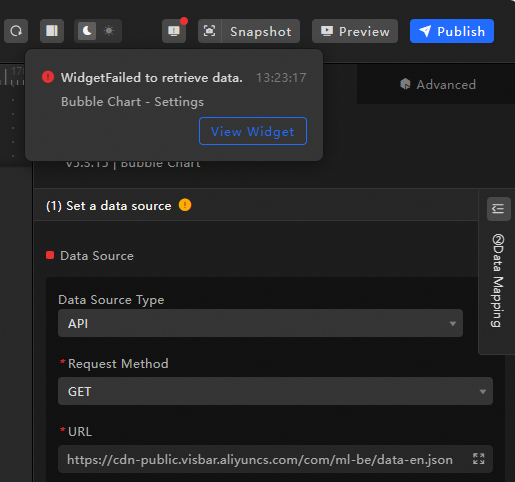
In the toolbar above the canvas, click the  icon to view error messages for the current canvas, such as Widget data retrieval failed and Filter execution error.
|
Error Type |
Description |
|
Widget data retrieval failed |
A widget's data source request failed. This can occur when the widget first loads, automatically updates, or when a global variable triggers an update. |
|
Filter execution error |
An error occurred while filtering data after the widget successfully received it from a data source. |

Preview and publish the data dashboard
Preview the dashboard
In the toolbar above the canvas, click Preview to preview the current data dashboard in a new page.
-
Normal Preview: Previews the data dashboard.
-
Debug Preview: Displays the main canvas connections, interaction logs, and widget logs to help you test the data dashboard.
Publish the dashboard
In the toolbar above the canvas, click Publish to publish the current data dashboard.