The dashboard test preview feature records interaction logs and error messages in real-time, including widget operation records and abnormal details. This topic comprehensively introduces the functions and usage standards of the test preview interface.
Background information
DataV supports two dashboard preview modes: General Preview and Debugging Preview.
General Preview
 : When you click General Preview under the icon in the upper-right corner of the canvas/blueprint editor, DataV does not record interaction logs or error messages during dashboard preview.
Debugging Preview
 : When you click Debugging Preview under the icon in the upper-right corner of the canvas/blueprint editor, DataV records interaction logs and error messages during dashboard preview.
The Debuggingt Preview feature is only available for PC dashboards. Mobile dashboards do not support Debugging Preview.
Prerequisites
You have created a dashboard. You can create a dashboard from a template, create a dashboard from a blank canvas.
You have added widgets and configured interaction events or actions in the blueprint.
Access the test preview page
Access the DataV console.
On the All Projects page, hover over the target dashboard and click Edit to access the canvas editor page.
On the dashboard editing page, click the
 icon in the top menu bar to access the blueprint editor.
Select the node you want to test, right-click and select Logging.
NoteEnabling the log recording feature allows you to trace operation behaviors. The connection line will be displayed in red. If a node does not need to be tested, you can click Disable Logging in the same operation interface.
- Click Debugging Preview under the icon in the upper-right corner to access the test preview page.Note
During testing, you can use the minimum granularity log recording mechanism to achieve end-to-end problem tracing. When a target widget does not produce the expected interaction effect, you can trace backward from its triggered action, verifying the accuracy of input data at each node level by level.
Page introduction
After entering the Debugging Preview interface, execute an interaction action to start the test status. The page features are shown below.
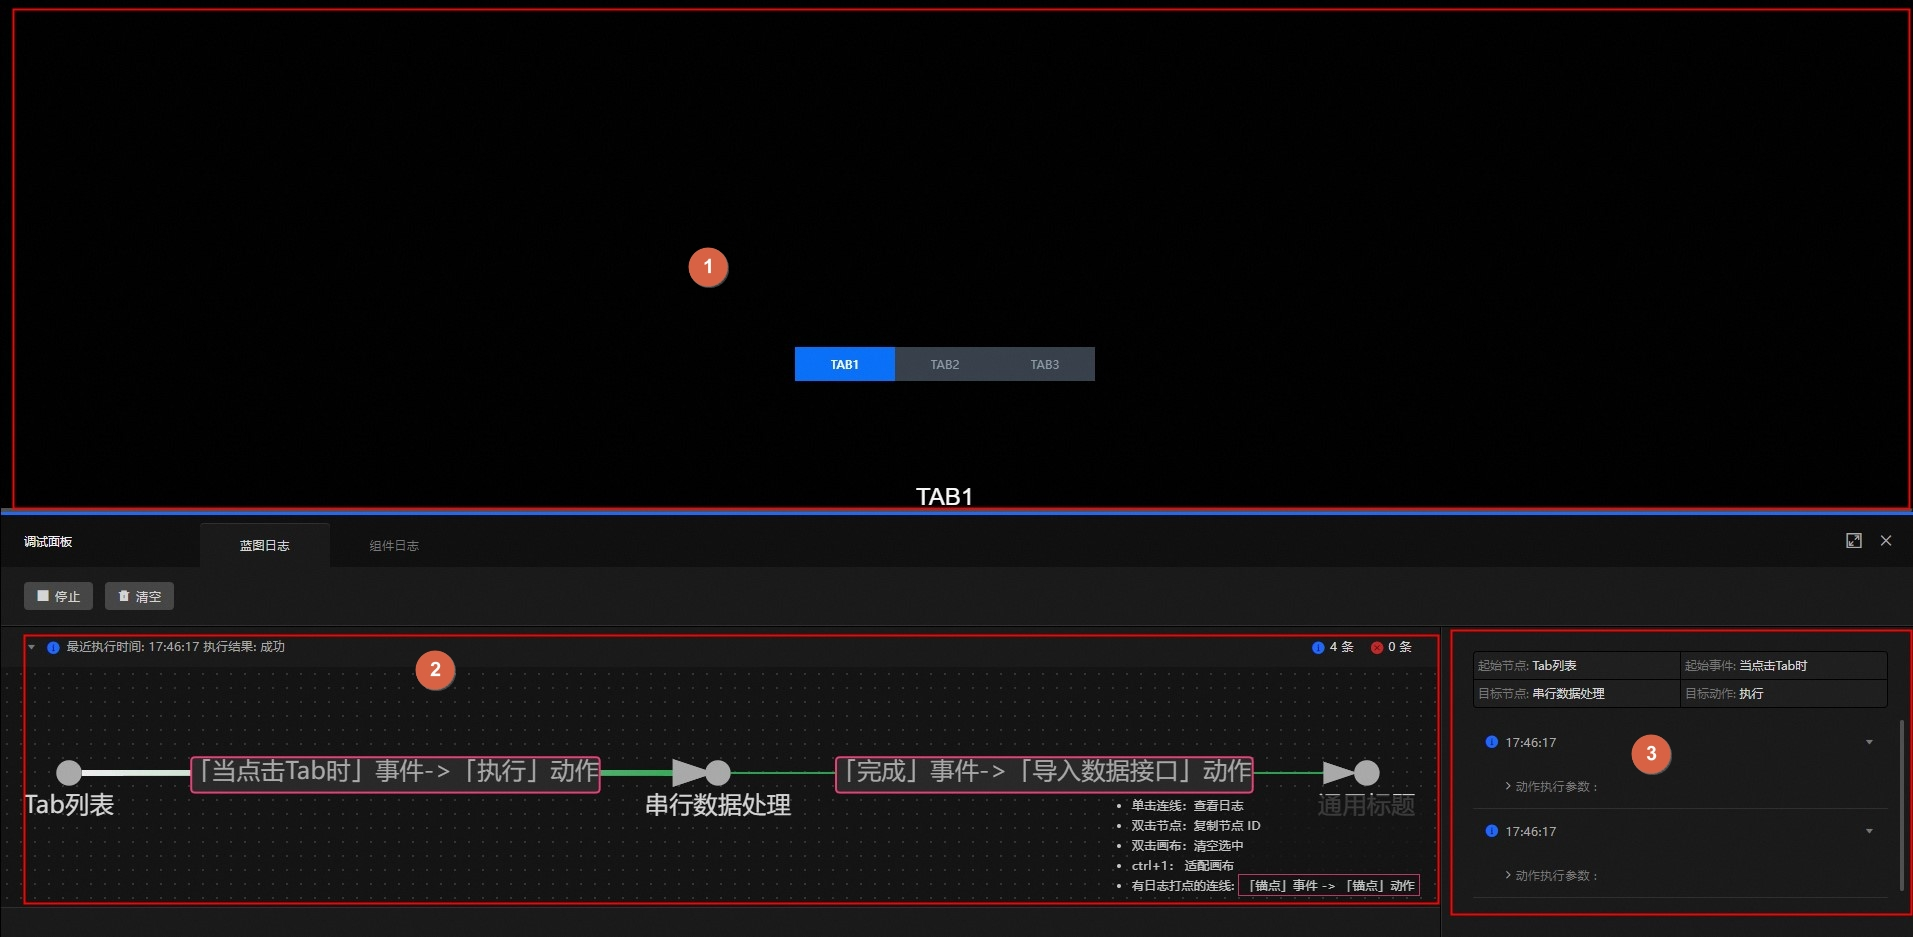
Number | Description |
1 | User interaction module. You can click to view the configured interaction effects. |
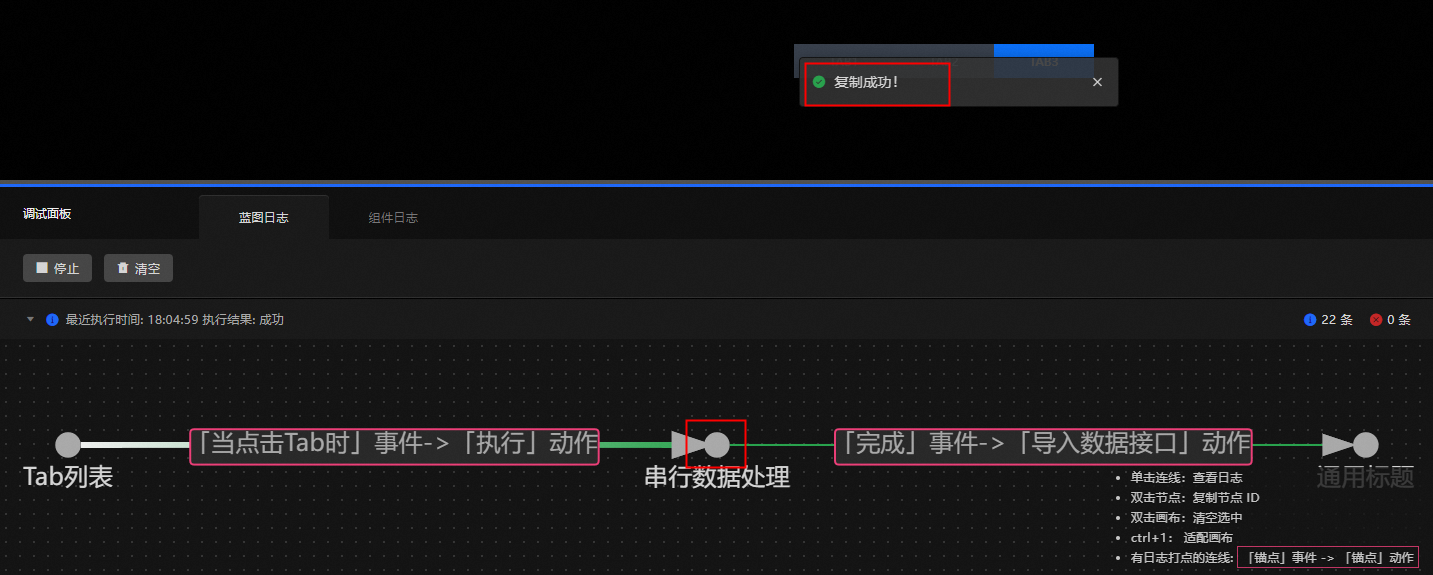
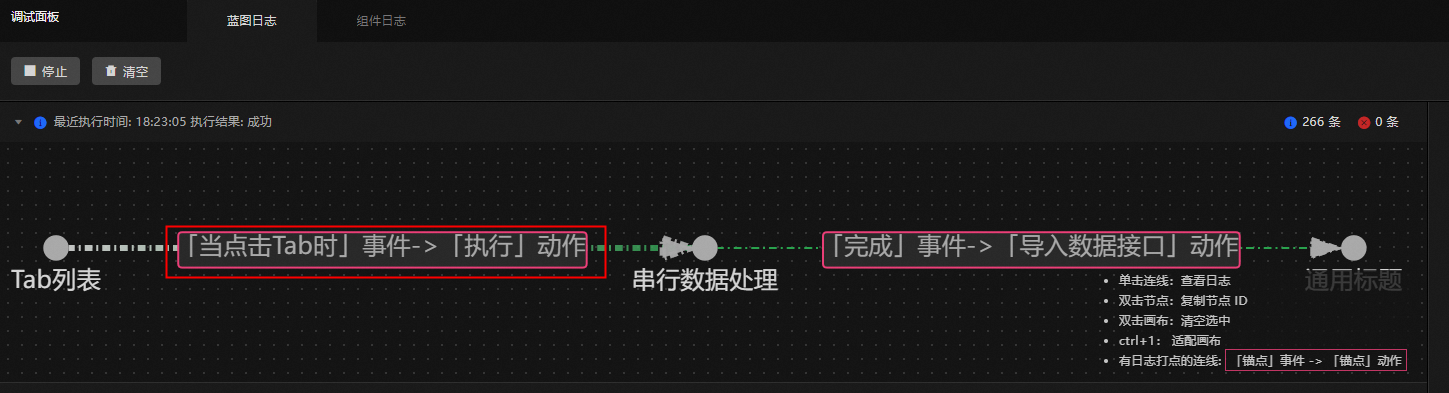
2 | Blueprint log logic module. This section displays the connection logic of nodes in the blueprint log page. You can view the logical details of blueprint nodes. |
3 | Blueprint log details module. You can click Record/Stop to enable and disable the listener function, or click Clear to clear the current blueprint logs. In this module, you can view the source node, target node, source event, and target action of the logs, and perform interaction log related operations. Note To prevent log refreshing from affecting dashboard performance, it is recommended to turn off automatic data updates or increase the automatic data update duration during test preview. |
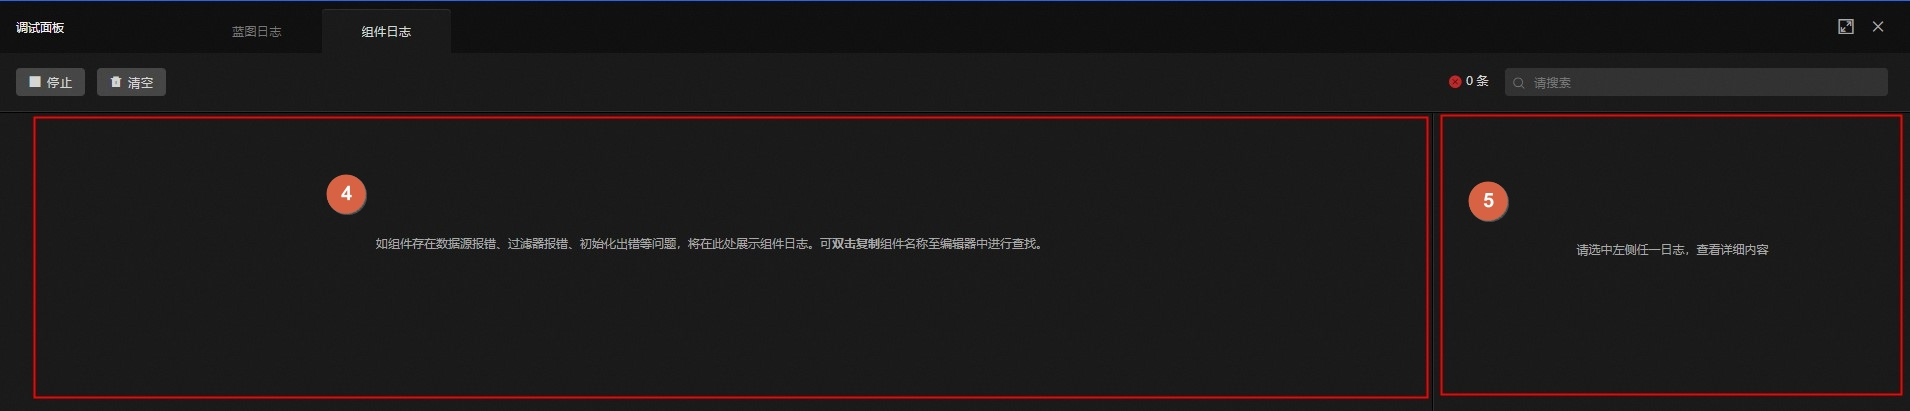
4 | Widget log module. If a widget has issues such as data source errors, filter errors, or initialization errors, the widget log will be displayed here. |
5 | Widget log details module. Click an error log on the left to view the widget log error details here. |
Log information
When performing interaction operations in the test preview interface, if an interaction connection line with log recording enabled is triggered, the system will automatically record the upstream and downstream node relationships of that connection and the data snapshot at the time of interaction triggering. Log information includes two types: interaction logs and widget logs. Interaction logs record the execution parameters and context information of widget actions in detail, while widget logs are specifically used to track and display abnormal errors during widget runtime.
Interaction logs
View log details: After each new interaction, a new record will be added at the top of the original log records. Click the
 icon on the left of the log record to view the action execution parameters.
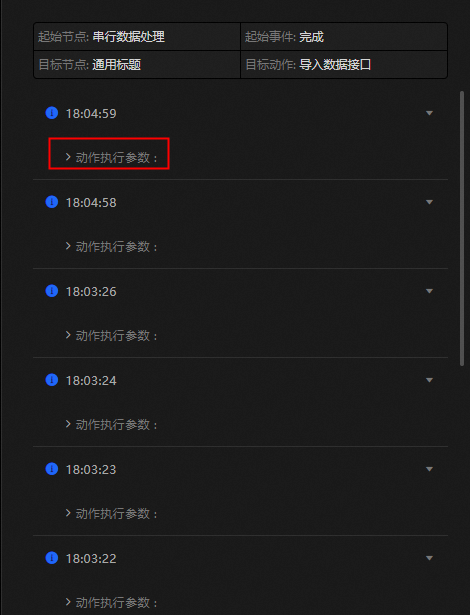
Copy node ID: Double-click a node in the blueprint log logic module to copy the node ID.
Repeat the previous operation: Double-click the event-action connection line in the blueprint log logic module to quickly execute the previous action.
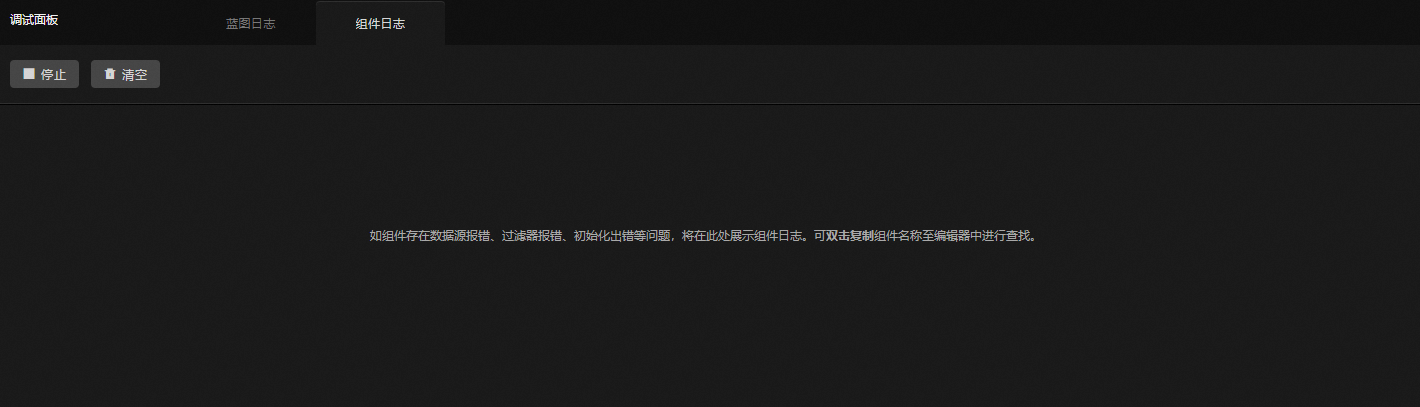
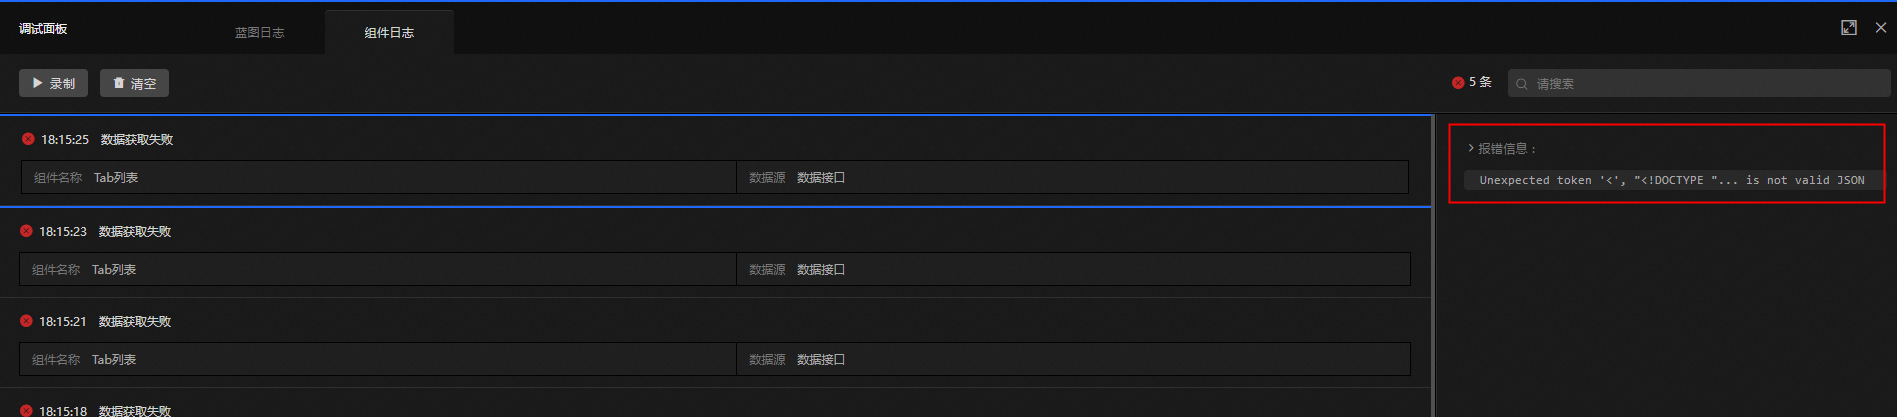
Widget logs
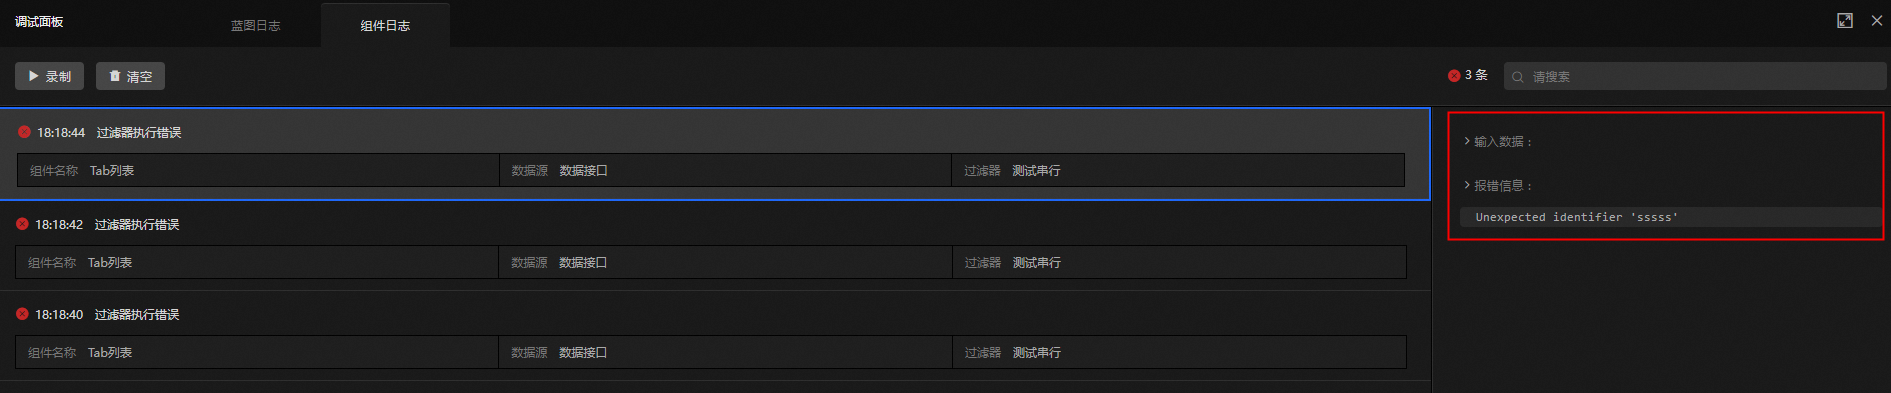
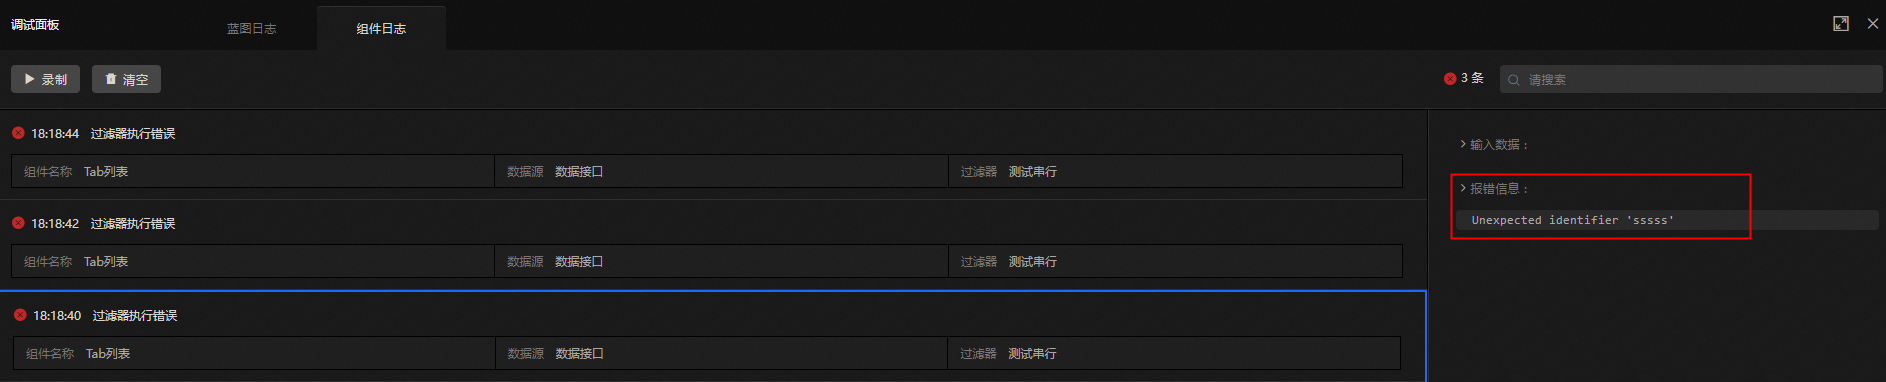
When a widget request encounters an error, a new error record will be added at the top of the panel. Click a log record to view the error details.

Common error types
Error type
Type description
Data Retrieval Failed
This error occurs when a widget encounters an error while requesting data from a data source. Data source requests may occur when a widget is first loaded, when a widget automatically updates, when a global variable triggers an update, or when a blueprint triggers a request data source action. It displays the occurrence time, widget name, data source, and error message.
Filter Execution Error
After a widget successfully retrieves data from a data source, if an error occurs during filter processing, it will be recorded as a filter error. It displays the occurrence time, widget name, data source, filter, input data, and error message.
Widget Internal Error
Errors that occur when rendering a widget or executing widget methods. It displays the widget ID and widget method.
Node Internal Error
Errors such as node initialization errors caused by issues in the blueprint node code.
NoteWarning messages will be generated when parameters for calling widget methods do not match the widget declaration.
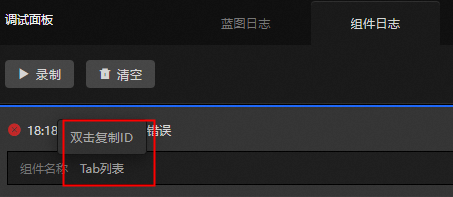
Copy widget ID: Double-click the widget name in the error record to copy the ID to the clipboard.
Search widget ID: Paste the copied widget ID into the editor search box to quickly locate the corresponding widget and modify its configuration based on the error message.
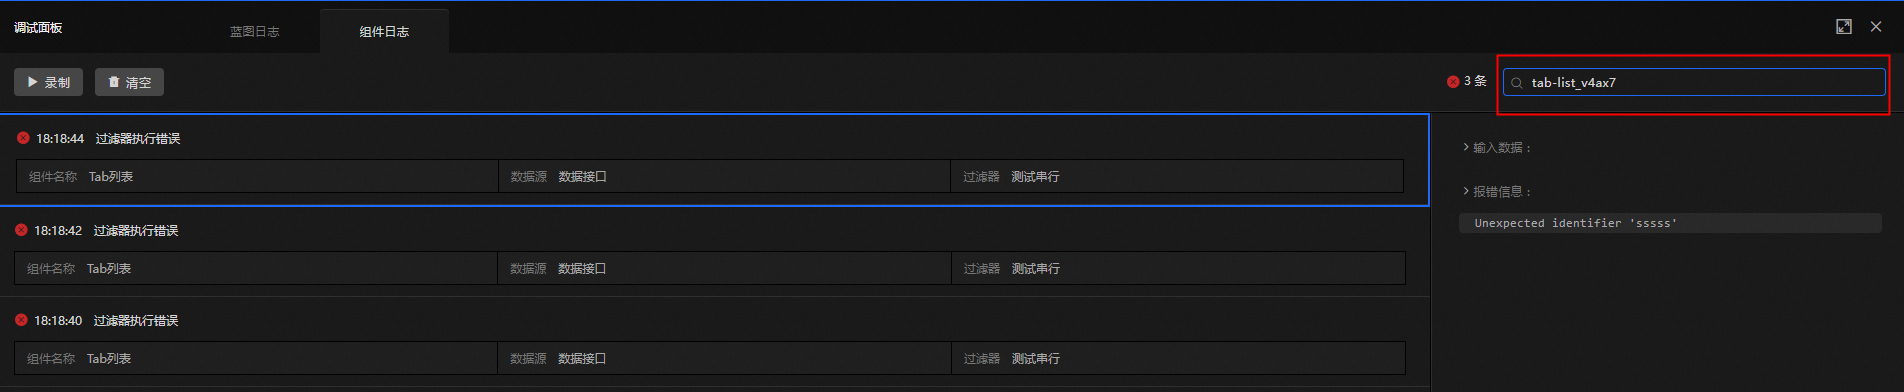
Filter widget error logs: Enter a widget name, widget ID, filter, or error message in the input box to quickly filter all error entries related to the input information in the current error panel.