Build a PC data dashboard in DataV-Board 7.0 from a blank canvas. This tutorial connects ApsaraDB RDS MySQL data and visualizes it with line charts, list carousels, and title widgets.
Overview
The example data is for demonstration only. Use your actual data in production.
Architecture description
After you complete this tutorial, your environment resembles the following architecture. Adjust the configuration to match your deployment needs.

Effect demonstration
The completed dashboard looks like this: 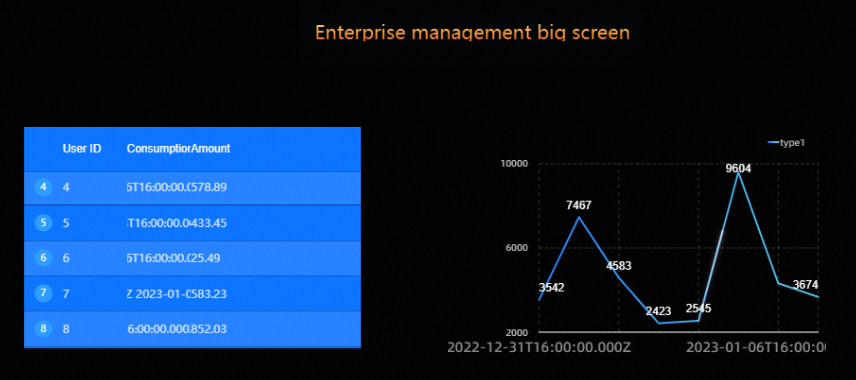
Your final dashboard will differ based on your configuration choices. This topic introduces the core features and workflow.
Preparations
On the ApsaraDB RDS MySQL side
In this example, the instance is in the China (Hangzhou) region and uses the platform-generated VPC and vSwitch.
Create a database account and database, then prepare example data.
This example uses:
Database account:
user_test.Database name:
mysqltest.Example data: Create a
Billtable in the mysqltest database with 100 simulated entries dated betweenJanuary 1, 2023andJanuary 10, 2023.
Configure a whitelist.
Add the DataV-Board IP address for your region to the RDS MySQL instance whitelist so DataV-Board can access the database.
The sample database is in the China (Hangzhou) region using VPC, so add
100.104.70.0/24to the whitelist.
You can adjust instance and database settings to match your business requirements.
On the DataV-Board 7.0 side
Create an RDS MySQL data source.
Configure the data source with these key parameters:
Parameter
Description
Type
Select RDS MySQL. For network type, select Internal of China (hangzhou).
Name
Enter a custom name. This example uses
mysql_data.VPC ID and Vpc-connected Instance ID
VPC ID: The VPC ID bound to the RDS MySQL instance.
VPC-connected instance ID: The RDS MySQL instance ID.
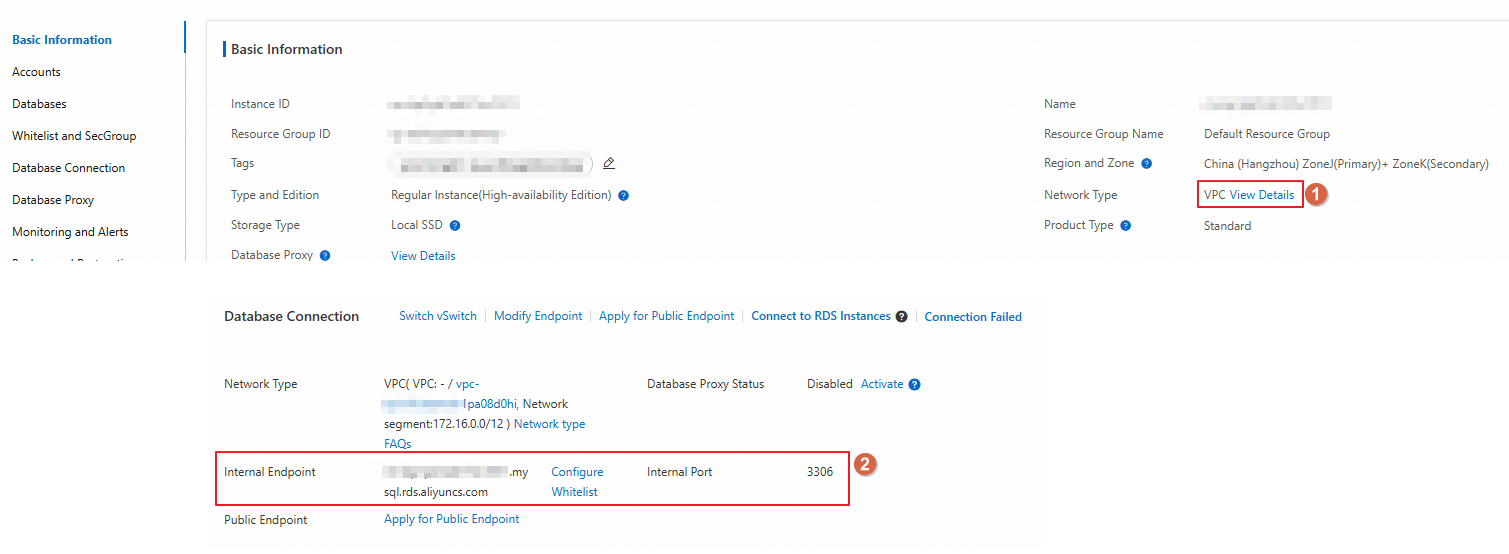
Find these values in the RDS instance list.

Domain Name and Port
Domain name: The VPC internal address of the RDS MySQL instance.
Port: The VPC internal port of the RDS MySQL instance.
Find these values in the RDS instance list. Click the instance name to view the details as shown below.
Username and Password
The database login account and password. This example uses
user_test.Database
Click Obtain Data List and select the database. This example uses
mysqltest.
Step 1: Create a data dashboard
Log on to the DataV-Board 7.0 console.
Create a data dashboard.
Click .
Click Create Dashboard on the blank dashboard.
Enter the dashboard name, use the default project group, and click Create Dashboard.
The example dashboard name is
mysql_display.
After creation, you are redirected to the canvas editor where you can connect data sources and configure the canvas.
The default canvas size is 1920×1080. Adjust it in Page Configuration on the right side of the canvas editor.
Step 2: Add and configure widgets
Select a widget, connect it to a data source, and configure its display style. This topic demonstrates data access using line chart, list carousel, and general title widgets.
Use a line chart to access data
A line chart shows data trends over time. This example displays the total bill amount in the Bill table on January 3, 2023 compared with January 2, 2023.
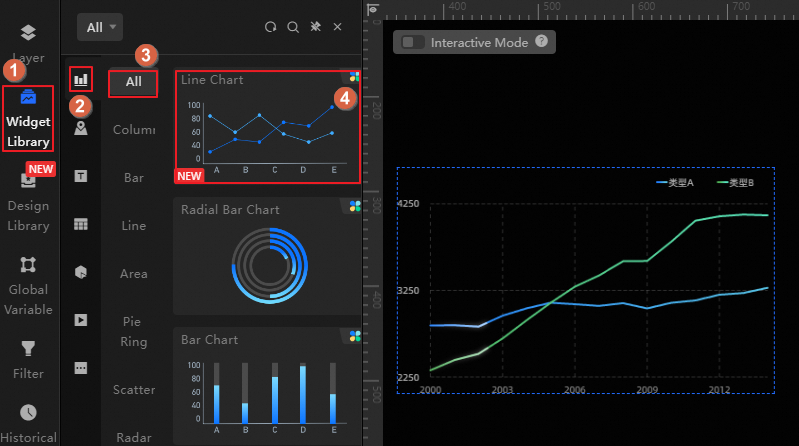
Add a line chart to the canvas.
On the dashboard editing page, add a line chart as shown below.
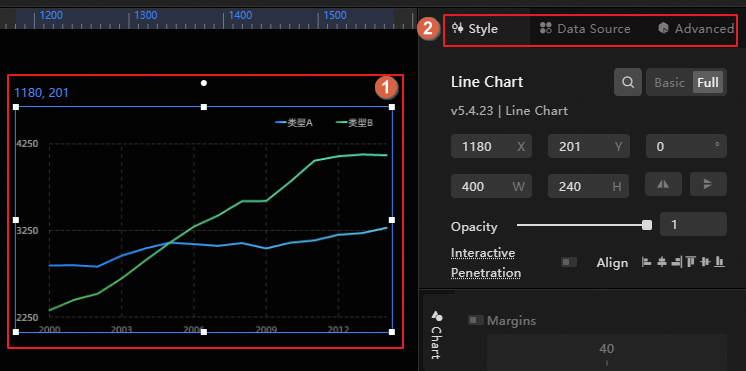
Click the line chart to configure its style, data source, and other settings in the editing area on the right.
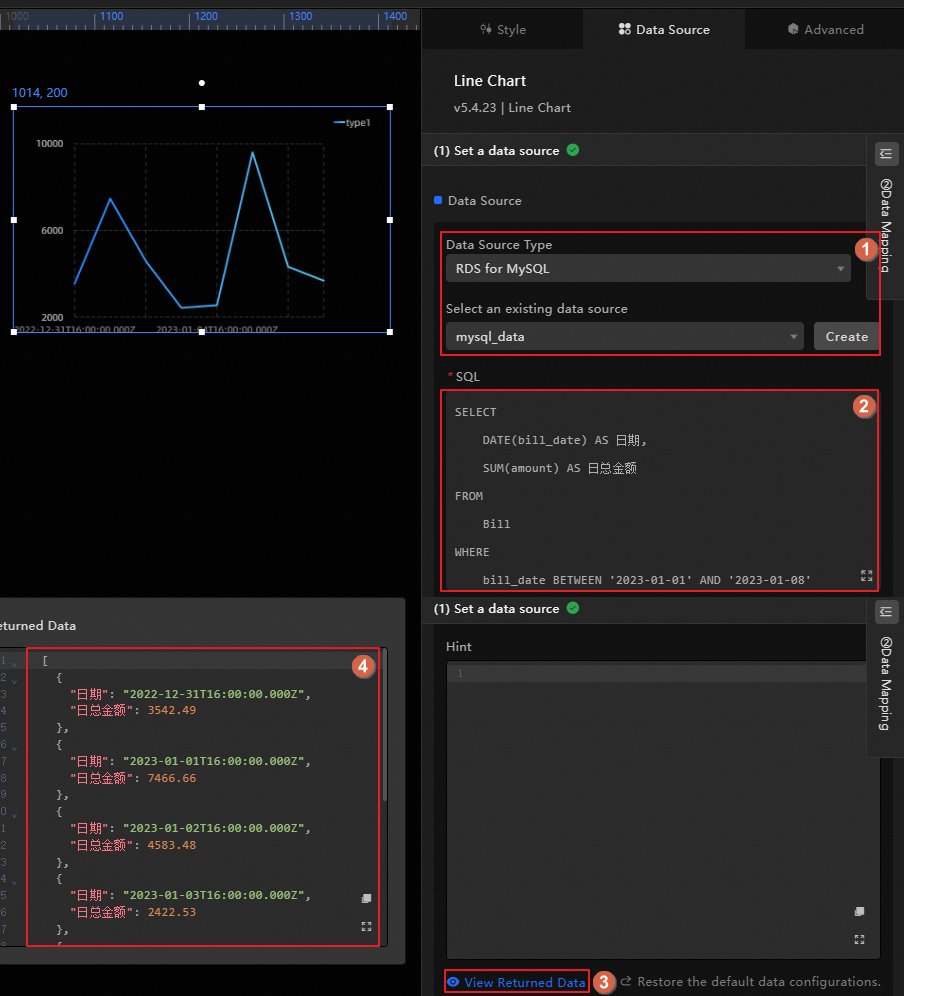
Access data source data.
Access the data source and view the data.
In the Data Source area, select the data source and view the data table fields through the query statement. Example configuration:
Data source type:
RDS for MySQLData source name:
mysql_dataQuery statement: Retrieve the daily total billing amounts from the
Billtable for the period ofJanuary 1, 2023throughJanuary 8, 2023.NoteBilling amounts are tallied the following day. Bills for
January 1, 2023toJanuary 8, 2023reflect charges fromDecember 31, 2022toJanuary 7, 2023.
Use a filter to adapt data source data.
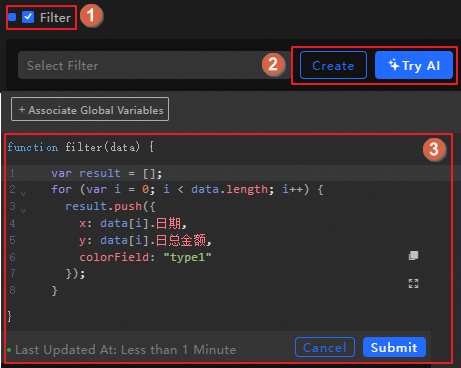
If your data table fields do not match the widget fields, use a filter to adapt the data.
Enable Filter and write filter code by Creating manually or using Artificial Intelligence Recommendation. Click Save.
Modify the widget style.
Set the X-axis and Y-axis font size to
15pxand enable Y-axis value display on the line chart.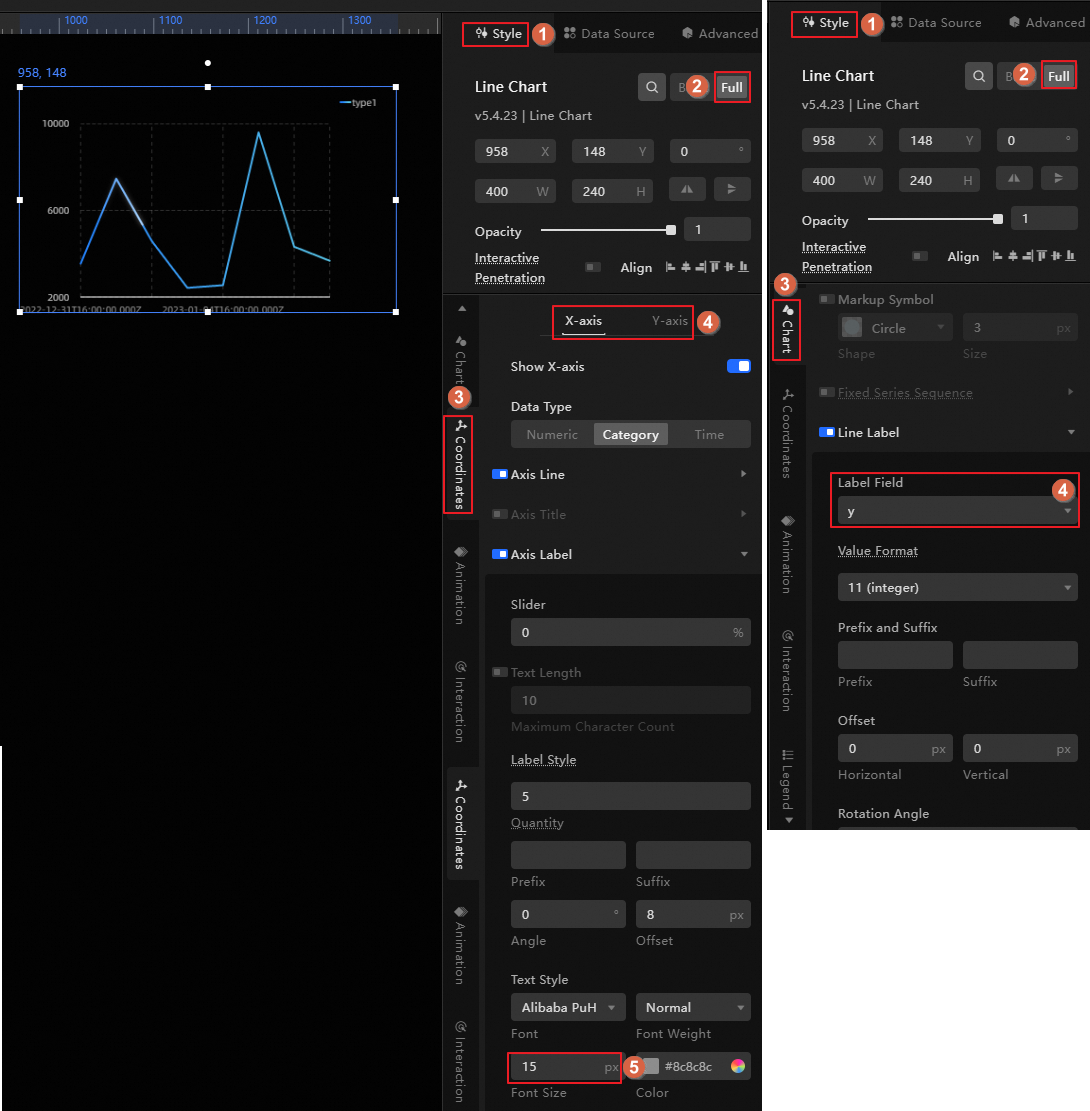
Use a list carousel to access data
A list carousel dynamically cycles through data table records. This example displays all bill entries in the Bill table.
Add a list carousel to the canvas.
On the dashboard editing page, add a list carousel as shown below.
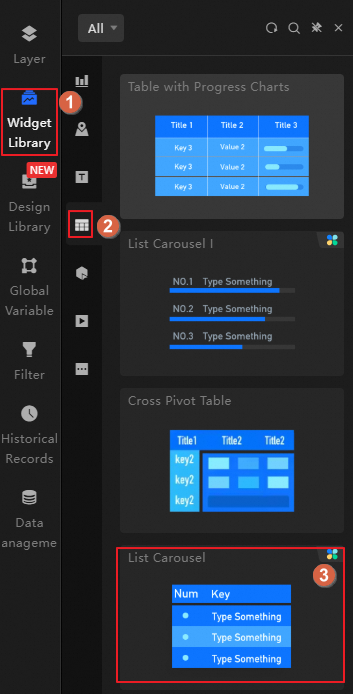
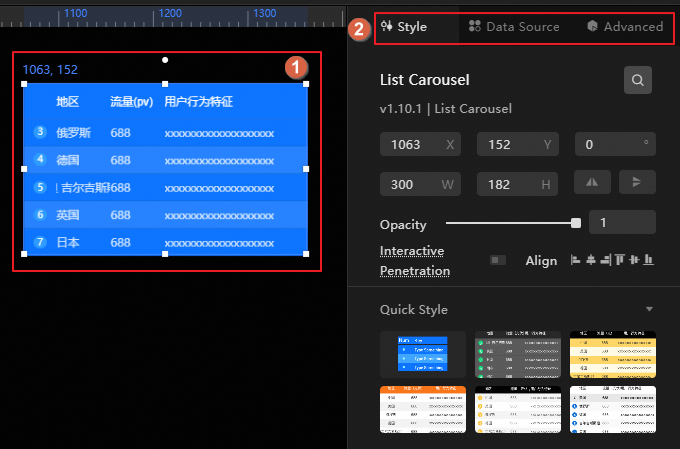
Click the list carousel to configure its style, data source, or other settings in the editing area on the right.
Click the list carousel to configure its style, data source, and other settings in the editing area on the right.
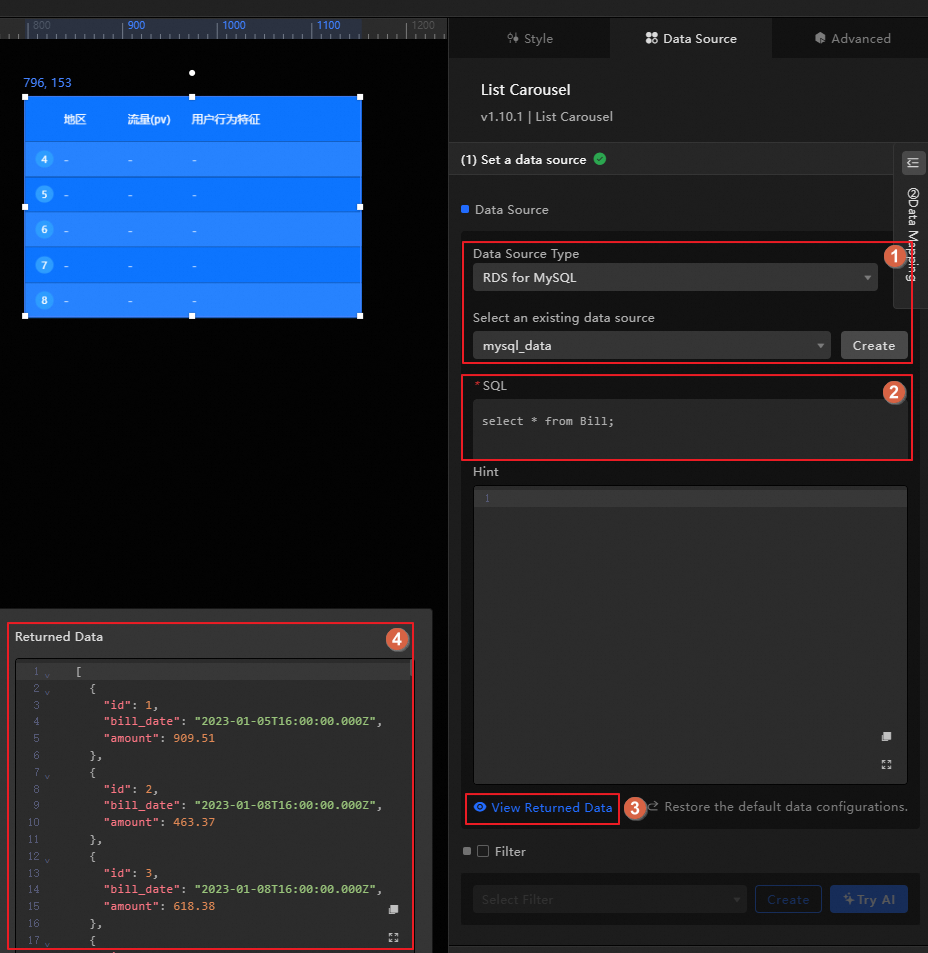
Access data source data.
In the Data Source area, select the data source and view the data table fields. Example configuration:
Data source type:
RDS for MySQLData source name:
mysql_dataQuery statement: View all bill records in the
Billtable. The statement is as follows.select * from Bill;
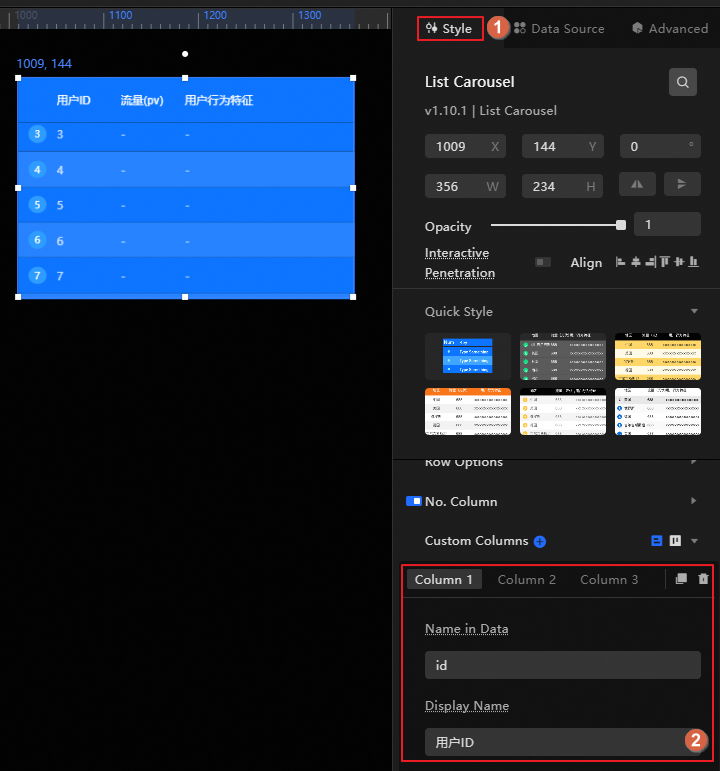
Modify the widget style.
The RDS MySQL table has three fields (id, bill_date, amount). Adjust the column headings accordingly:
Column field name: Map the RDS MySQL field names to each column. Set the three tags to "id, bill_date, amount".
Column display name: Set the display names to "User ID, Consumption Date, Amount".
Use a general title
Use a general title widget as the title bar for the dashboard.
On the dashboard editing page, add a general title as shown below.
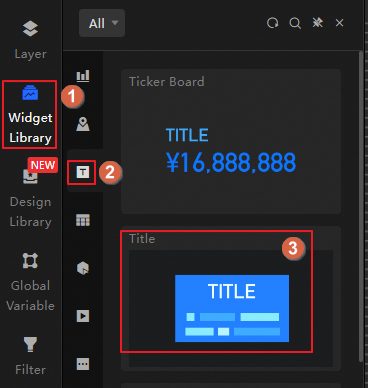
Click the title to configure its style and data in the editing area on the right.
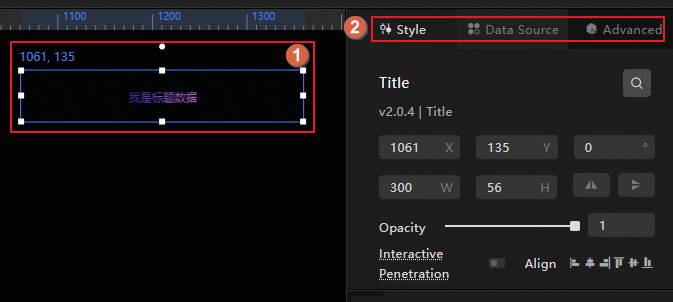
Example style configuration:
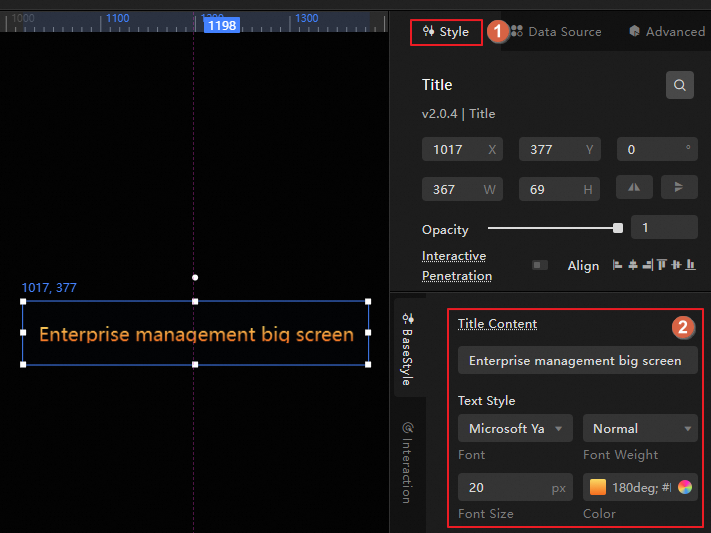
Step 3: Preview the data dashboard
Click Preview in the upper-right corner of the editing page to preview the dashboard. Drag and drop widgets to adjust their position and size.
Example dashboard:
Step 4: Publish and deploy the data dashboard
After the dashboard is ready, publish it online and deploy it to relevant devices.
Click Publish in the upper right corner of the dashboard editing page and select Publish Big Screen.
Get the access information and set access restrictions.
Click Published in the upper-right corner of the editing page to view access details and configure privileges.
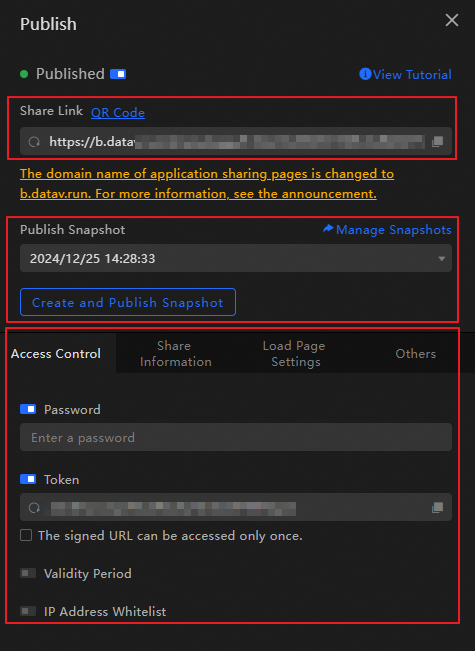
Access via QR code, link, or other methods.
Configure access privileges such as password or token authentication. Enable token authentication if you need to integrate with other systems.
View published versions in the publish snapshot area. Add new versions or revert to previous ones.
Use the access address to project the dashboard onto rendering hosts, PCs, mobile phones, or other devices.
Step 5: Project the data dashboard
After publishing, go to the visual application center to project the dashboard.
Navigate to the visual application center.
Log on to the DataV-Board 7.0 console.
In the top navigation bar, click Visual Application Center on the right.
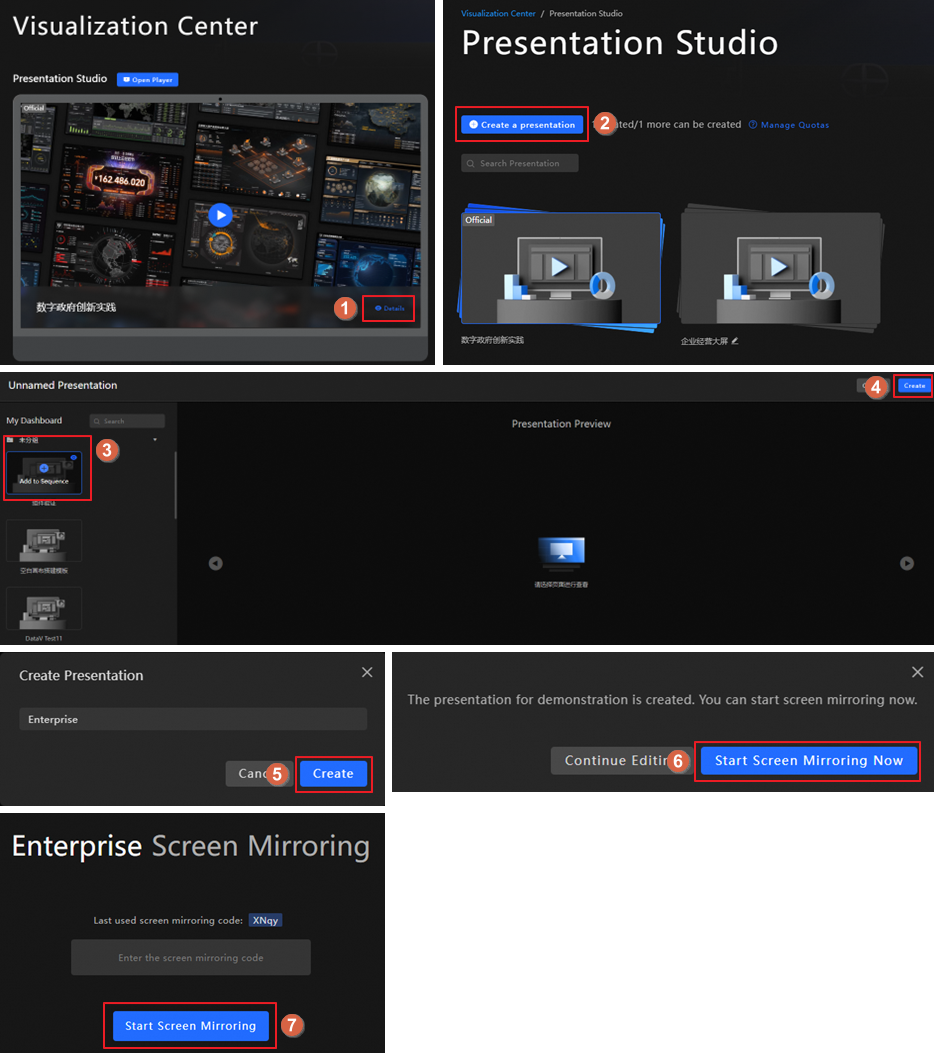
Create a demo plan and project it as shown below.
References
Other dashboard creation methods: how to create a PC dashboard using a template.
For widget setup, blueprint implementation, and global variable management, use the visual workbench.