This topic describes the layout and operation details of Blueprint Editor for DataV-Board 7.0 (Data Kanban) to help you quickly get started with configuring widget interaction in Blueprint Editor.
Go to Blueprint Editor
Log on to the DataV console.
On the All Applications page, move the pointer over the target dashboard and click Edit.
In the top navigation bar, click the
 icon to go to Blueprint Editor.
After a widget is added to Canvas Editor, the widget that is used in the current Kanban board is displayed in the section. If there is a business interaction between components, you can drag the required components to the main canvas of Blueprint Editor to configure the interaction behavior.
Before you configure widget interactions, you must understand the layout and operations of Blueprint Editor.
Interface Layout
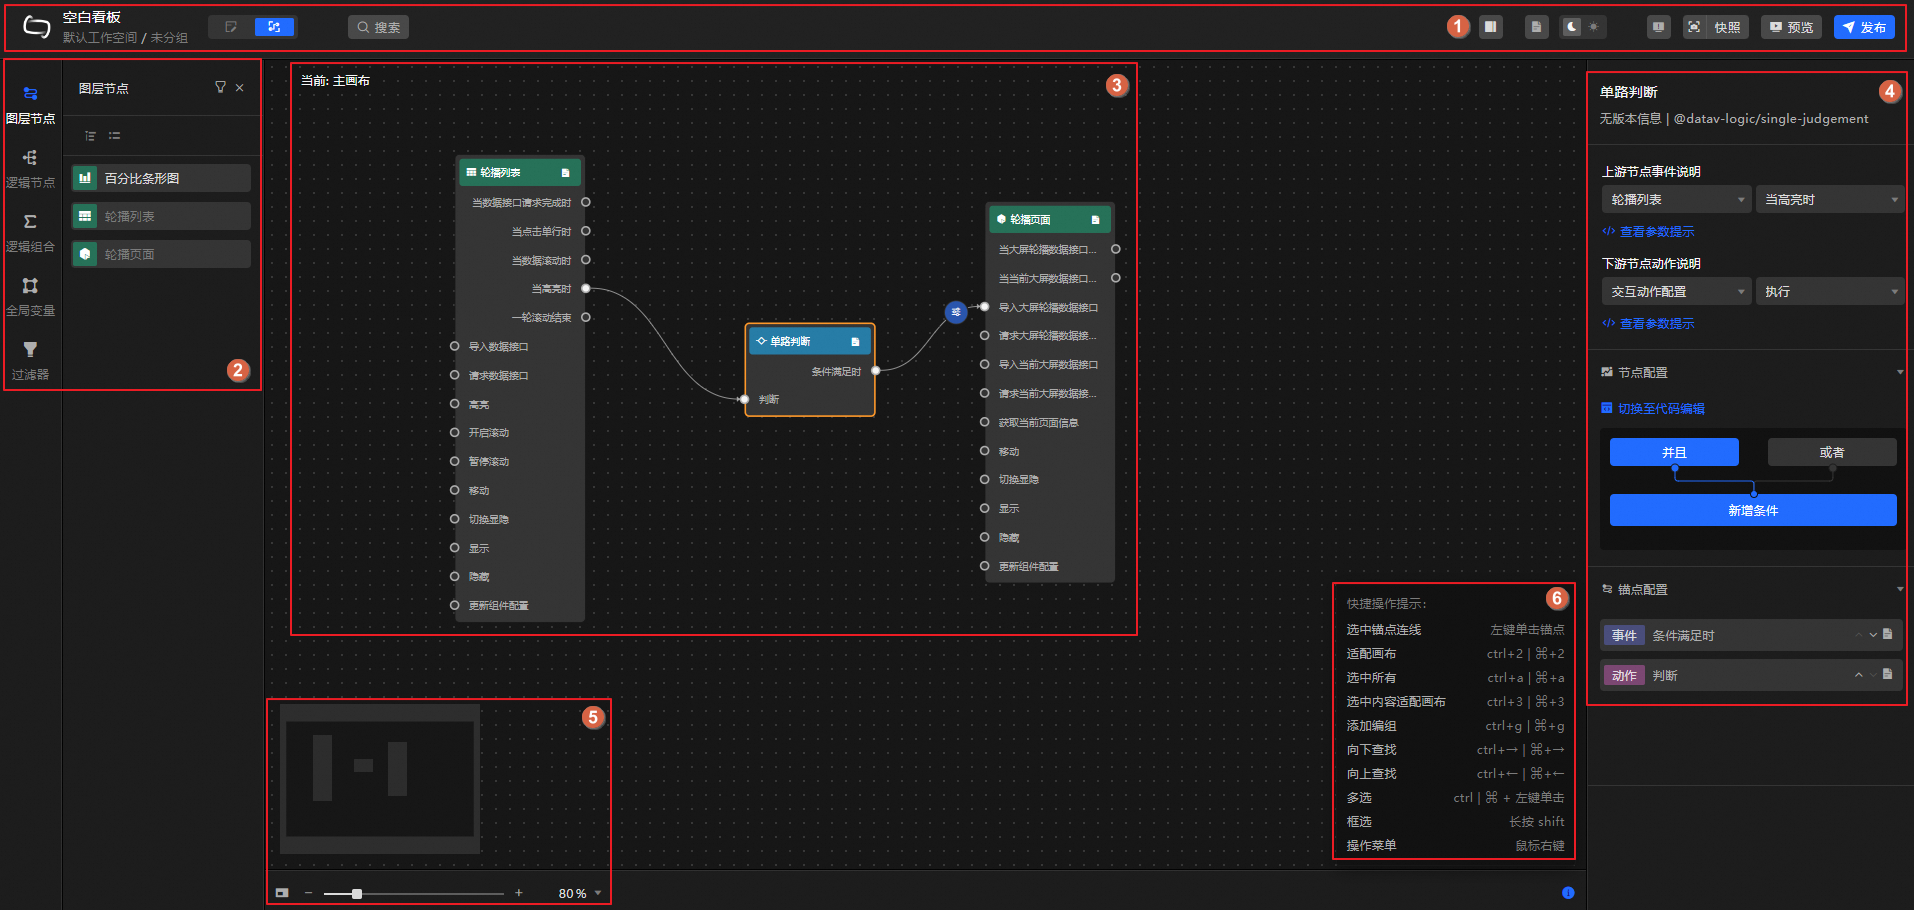
The layout of the Blueprint Editor interface of DataV-Board 7.0 is as follows.
 The following table describes the features of Blueprint Editor.
Number | Description | Operations |
1 | The toolbar is used to switch the canvas editor, search for nodes, control whether to display the right-side panel, enable parameter prompts, switch the background color of the interface, view error messages, add snapshots, preview, and publish kanban boards. | |
2 | The principal object used to configure interactive behaviors in Blueprint Editor. You can add the principal object to the main canvas for editing. The following information is included:
| |
3 | The main canvas. It is used to configure and display the interactions between widget components. You can drag and drop widget components and connect widget components to edit them. | |
4 | In the right-side panel, click the corresponding node to display the corresponding configuration panel and configure the parameters of related functions. Note The configuration items of different nodes or anchor points varies. For details, refer to the actual interface. | N/A |
5 | The thumbnail of the main canvas. You can zoom in or out of the main canvas or drag the mouse to move the rendering perspective of the main canvas. | N/A |
6 | The shortcut keys for related operations in Blueprint Editor can be viewed in the lower-right corner of the main canvas. Note Windows systems use | N/A |
Instructions
Node operations
In the left-side Nodes panel, you can perform the following operations:
Some of the icons in the following table are displayed only after you move the pointer over the node or anchor point. For more information, see the actual interface.
Type | Actions |
Layer Node | In the Layer Nodes panel, you can view all components imported from Canvas Editor. You can filter nodes, locate the current node in Canvas Editor, add nodes to the main canvas, and move the current node to the center of the main canvas. Click a layer node on the main canvas. You can configure the node information in the right-side pane. For more information, see Configure layer nodes. |
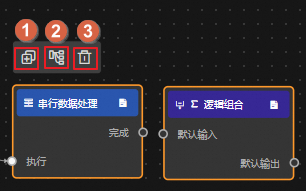
Logical Node | The Logical Nodes panel contains multiple logical processing nodes, such as global nodes, conditional judgment, and serial data processing. Move the pointer over a node and click the |
Logical combination | In the Logical Combinations panel, you can view the list of created logical combinations. You can create, edit, delete, and drill down a logical combination as needed, and add the current logical combination to the main canvas. On the main canvas, click the corresponding logical combination. You can configure the anchor information in the right-side panel. For more information, see Configure logical combinations. |
Global Variables | In the Global Variables panel, you can view the list of created global variables, and perform operations such as adding, configuring processing logic, editing name, copying, deleting, adding to canvas, copying across projects, and deleting global variables at a time. For more information, see Configure global variables and Use global variables. |
Configure a filter | In the Filter panel, you can view the list of created filters and perform operations on filters as needed, such as adding filters, configuring processing logic, editing names, deleting filters individually, searching, and deleting filters at a time. For more information, see Apply filters to blueprints. |
 icon to add the node to the main canvas. You can also drag nodes to the main canvas. After you add a node, click the node on the main canvas. You can configure the node information in the right-side pane. For more information, see
 Operations on the main canvas
In the main canvas of Blueprint Editor, you can perform the following operations on the canvas, nodes, and lines:
Type | Actions | Description |
Canvas | Move canvases | In radio mode, left-click a blank area on the canvas to move the canvas globally. |
Zoom In and Zoom Out | In the lower-left corner of the canvas, you can move the thumbnail to adjust the position of the node in the canvas. You can click the | |
Node | Mobile Node | Click a node with the left mouse button and drag it. |
Jump to the canvas and select | Right-click a node and select Go to Canvas to go back to Canvas Editor and edit the widget. Note This operation is supported only for layer nodes. | |
Fit selected content to canvas | Right-click a node and select Fit to Canvas to move the node to the center of the canvas. | |
Delete Selected | Right-click a node and select Delete Selected to remove the node from the blueprint canvas. Important When you remove a node, the selected connections are also removed and cannot be restored. Exercise caution when you remove the node. | |
Add Group | If the logic between nodes in a blueprint is complex, you can group nodes with similar logic for easy viewing and use. Right-click the target node and select Add Group to generate a group box. You can move the desired node inside the group box, and the system will automatically resize the group box after the move. Subsequent dragging of the group box moves all the nodes in the group box at the same time. Move the pointer over the group box to perform the following operations:
Important Ungrouping and deleting a node are irreversible operations. Exercise caution when you perform these operations. | |
Find Up /Find Down | Right-click the target node and select Search Up or Search Down to view the upstream and downstream nodes associated with the current node. | |
Select Associated Edges | Right-click the target node and select Select Associated Edges to view all lines associated with the current node. | |
Add Description /Delete Description | Right-click a node and select Add Description or Delete Description to add or delete a description for the node. | |
Batch operation node | You can select multiple nodes on the canvas or use the shortcut box to select nodes. For example, you can generate node groups, automatically lay out nodes, and delete nodes at a time. Important When you remove a node, the selected connections are also removed and cannot be restored. Exercise caution when you remove the node.
| |
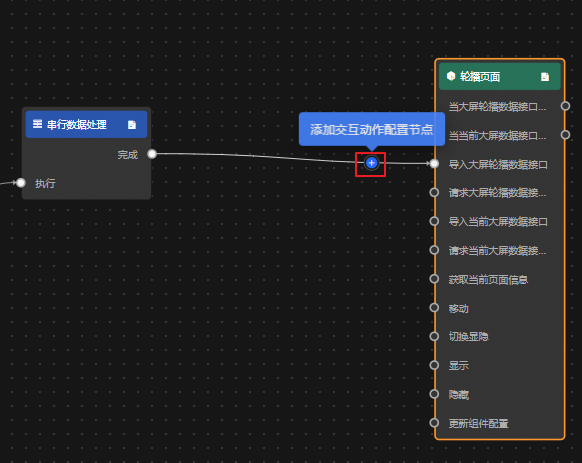
Connection | Connect | You can use a wire to trigger data interaction between two nodes. Click the anchor point of the source node and drag a line to connect to the anchor point of the target node. If the current node is not a data processing node, such as a serial data processing node, and downstream actions require parameter configuration, the system automatically inserts the Interactive Action Configuration Node. Note The event of the source node can only be thrown as the starting anchor point; the action of the target node can only be triggered as the target anchor point. |
Add an interactive action configuration node | You can move the pointer over a line and click the
| |
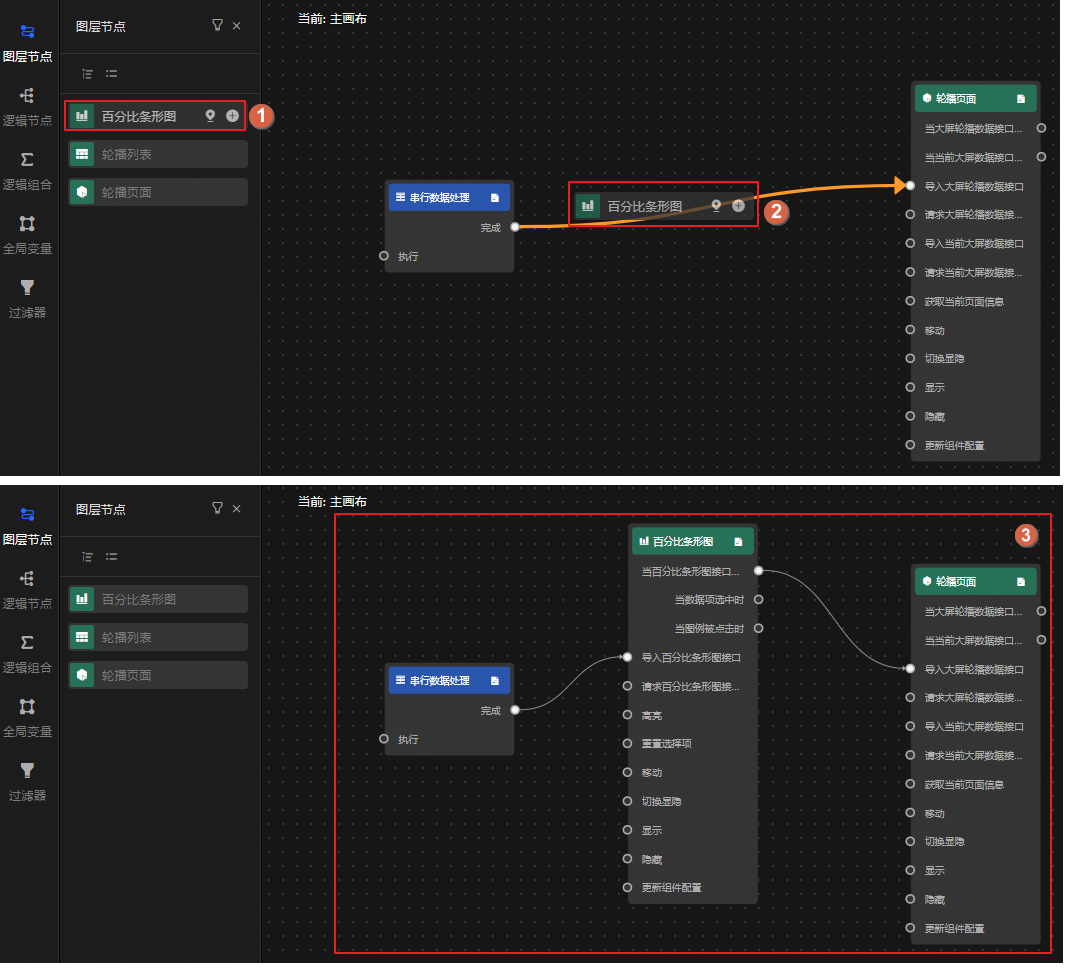
Insert a node on a wire | You can drag and drop nodes in the left-side panel to add them to the line. After the nodes are added, the system automatically adapts to the upstream and downstream relationships of the nodes. The following figure shows an example. | |
Automatically follow | Used to set the movement mode of the interaction configuration node on the wire:
| |
Auto layout | The system supports automatic layout of multiple selected nodes and lines (you can select them by box or group), that is, automatically calculates the position and presents the most reasonable position arrangement. | |
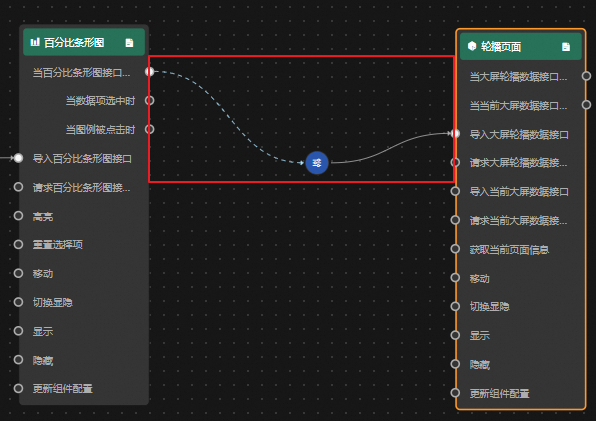
Enable/Disable | Right-click the target wire and select whether to enable the current wire. Only when the node data or execution logic is enabled, the node data or execution logic is transmitted between the upstream and downstream nodes based on the connection. If the connection is disabled, it changes to a dashed line. | |
Logging /Unlogging | Right-click the target line and select whether to record the log data of the current line. Log data is used to trace related operations. If logging is enabled, the line changes to red. | |
Delete Selected | Right-click the line and select Delete Selected to delete the line from the blueprint canvas. Important
|
 icon to show or hide the thumbnail. You can also adjust the display size of the node by using the scale bar or percentage.
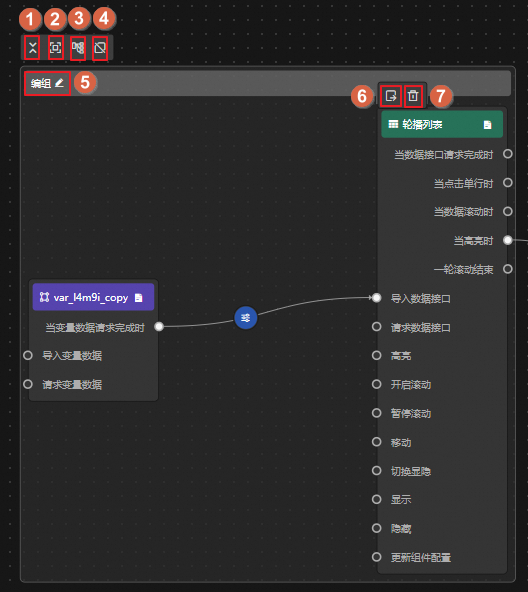
 icon to add an interaction configuration node, which is a serial data processing node. After the node is added, the connection changes to the
  icon. You can click the icon to configure the interaction behavior of the node in the right-side pane.