Filters dynamically filter and control visualization data. Learn how to configure, manage, and apply filters across multiple scenarios.
Background information
Principle introduction
Filters enable dynamic data interaction in visualizations. They apply user-defined condition rules — such as numerical intervals, text matching, and logical combinations — to filter raw data in real time and update the results across all associated visualization widgets.
Scenarios
Filters are widely used in data visualization to dynamically control displayed content. Typical scenarios include:
-
Displaying performance data for only a specific region in sales reports.
-
Filtering out abnormal values, such as temperature readings that exceed thresholds, in real-time monitoring dashboards.
-
Combining filters with dropdown menus or sliders to let users select a specific timestamp range.
Preparations
Prerequisites
You have created a data dashboard project.
Access the canvas editor
Before you configure filters, follow these steps to access the canvas editor:
Access the DataV console.
-
On the Workspace page, hover your mouse over the target project and click Edit to access the canvas editor page.
Create a filter
You can create a filter by using either of the following methods.
-
Create a filter in the panel
-
In the left navigation bar of the canvas editor page, click Filter to access the filter page.
-
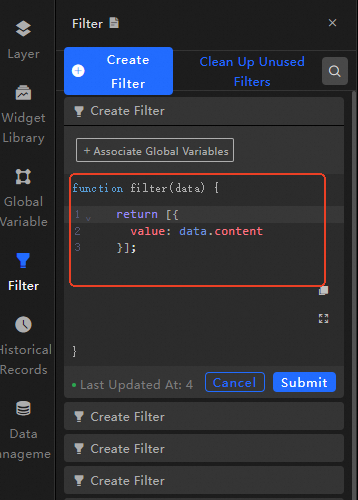
In the filter panel, click Create Filter.
-
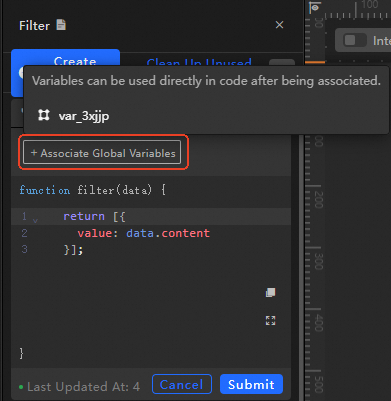
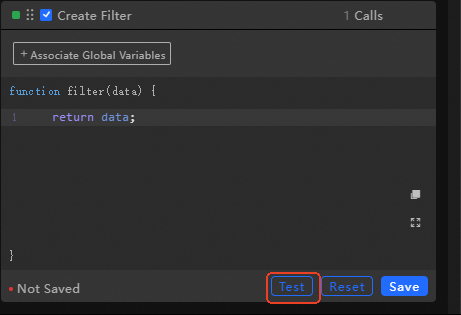
In the filter configuration area, enter the filter name and custom filter code, and then click Save.
-
(Optional) When editing a filter, you can click Associate Global Variable to associate an existing global variable with the current filter. After association, you can directly use this variable in the code.
The created filters appear in the filter list.
NoteCreated filters can be called by all widgets in the current data dashboard. The association between each widget and the filter is displayed after a filter is called.
-
-
Create a filter in a widget.
Widgets support manual configuration for filter creation.
-
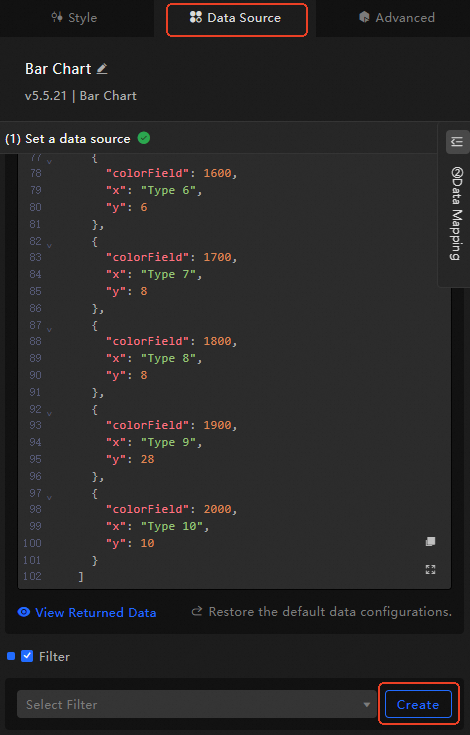
Add a widget to the current data dashboard (a column chart is used in this example), and click Data Source in the configuration panel on the right.
-
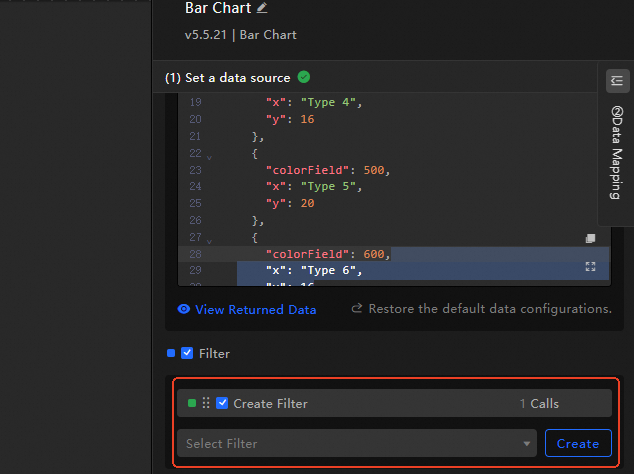
In the Data Source configuration panel, turn on the filter and click Create.
-
In the filter configuration area, enter the filter name and custom filter code, and then click Save.
-
The created filters appear in the filter list, showing the dependency between each filter and its associated widget.
-
Manage filters
Filter panel
In the Filter panel, you can centrally manage all filters in the dashboard. Any widget can use these filters. The number of calls is displayed on the right side of each filter.
When you modify a filter in the filter panel, all widgets that depend on this filter become unavailable. Confirm the scope of impact before saving.
Basic operations
-
Rename a filter: Hover your mouse over the target filter, click the
 icon, and enter the filter name.
 -
Delete a filter: Hover your mouse over the target filter and click the
 icon to delete the filter.Important
Deleting a filter may cause dependent widgets to become unavailable. Confirm before proceeding.
-
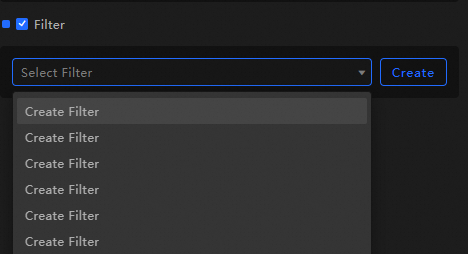
Add a filter: In the Data Source configuration panel of the widget, turn on the filter switch and select the target filter from the dropdown menu.
-
Clear unused filters: After adding multiple filters to a widget, you can click Clear Unused Filters in the filter panel to remove all unused filters with one click.
ImportantFilters cannot be recovered after being cleared. Proceed with caution.
Sort filters
After adding multiple filters to a widget, you can reorder them by dragging.
Filter order: When multiple filters are added to a widget's data source, data is processed sequentially from top to bottom. The first filter receives the original data source result, and each subsequent filter receives the output of the preceding filter. The final output reflects the cumulative processing of all filters.
-
If a filter in the middle returns an empty value, it is skipped, but processing continues. The system displays a prompt in the multi-filter configuration page.
-
If a filter execution fails, processing terminates and the result from the last successful execution is used.
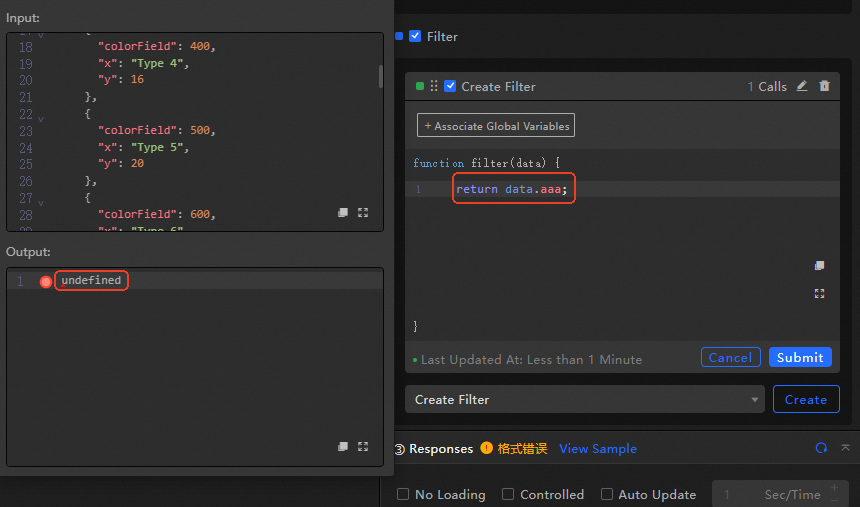
Debug filters
On the Data Source page, you can edit filter code for debugging. The left popup displays return results in real time.
Filter debugging verifies code correctness but is not suitable for large data volumes.
Use filters
The following examples demonstrate how to use filters in the canvas editor and blueprint editor, using a column chart widget as an example.
Use in canvas
-
Add a column chart widget in the canvas editor.
-
Select the current widget and click the Data Source tab in the configuration panel on the right.
-
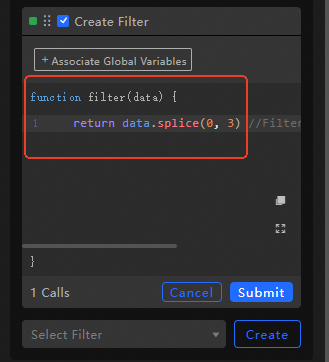
Select the filter check box and click Create to create a filter.
-
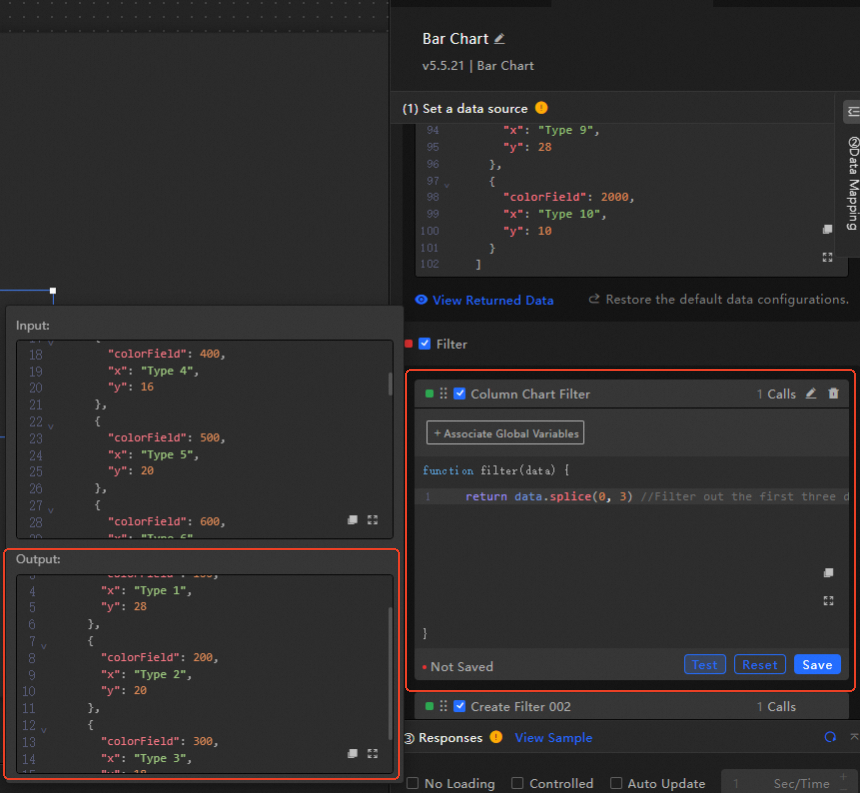
Change the filter name to
Column Chart Filterand replace the initial filter code with the following code.return data.splice(0,3)//Filter out the first three data items -
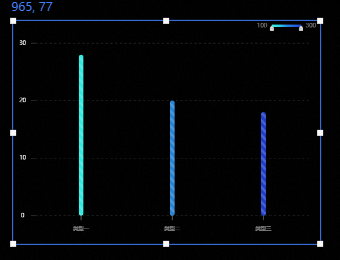
Click Test below the filter to view the output results. The following figure shows the effect after filtering.
-
After successful testing, click Save to complete the filter code editing. You can then view the filtered visualization chart in the canvas.
Use in blueprint
-
Add two column chart widgets in the canvas editor.
-
Click the
 icon in the upper left corner of the page to switch to the Blueprint page.
 -
In the Layer Node tab on the left, drag and add the two column chart nodes to the main blueprint canvas.
-
Click the Logic Node tab on the left and add a Serial Data Processing node.
-
Connect the column chart and serial data processing nodes in sequence, as shown in the figure.

-
Select the serial data processing node, and in the Node Configuration panel on the right, click Create in the Processing Method module to add a filter.
-
Change the filter name to Column Chart Serial Processing and replace the initial filter code with the following code.
return data.splice(0,3)//Filter out the first three data items -
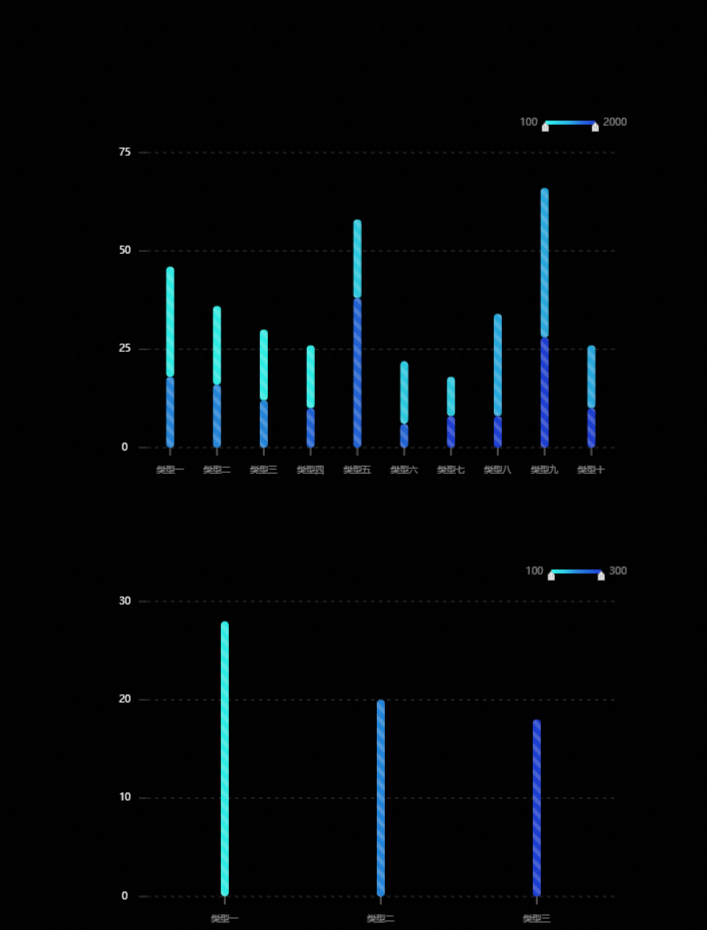
Click Save below the filter to complete the editing, and then click Preview in the upper right corner of the blueprint page to enter the preview page. After the widget loads, you can view the filtered chart results.
FAQ
-
Data Source Error: After you add a filter in the widget data panel and switch to another data source type, the system displays the following two error messages.
 Important
When a data source is abnormal, the filter in the data panel remains disabled (grayed out) even if the interface returns data. Because the data stream has an exception at the source, subsequent filtering has no practical effect.
-
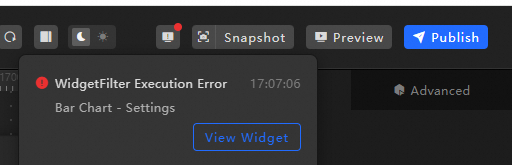
Filter Error: When a filter encounters a code error during execution (such as an undefined return field), the system displays an error prompt.
Related operations
For information about the getLocalValue and getCallbackValue methods used to reference global variables in filters, see Filter references.