The Custom Configuration tab lets you fine-tune probe behavior for your Golang application, including sampling policies, HTTP capture, trace propagation, slow-call thresholds, and profiling toggles.
To configure these settings programmatically, use the SaveTraceAppConfig API.
Prerequisites
Before you begin, ensure that you have:
An ARMS probe installed for your application. For details, see Application Monitoring overview
Open the custom configuration page
Log on to the ARMS console. In the left-side navigation pane, choose .
On the Application List page, select a region at the top, and then click the name of your application.
NoteThe icons in the Language column indicate the application type:
 : Java application integrated with Application Monitoring.
 : Golang application integrated with Application Monitoring.
 : Python application integrated with Application Monitoring.
- : Application integrated with Managed Service for OpenTelemetry.
In the top navigation bar, choose .
Configure the settings described in the following sections, and then click Save.
Sampling settings
Golang applications support fixed-rate sampling only. You can also configure full sampling by interface name, prefix, or suffix.

Probe toggle settings
Enable or disable Application Monitoring and toggle individual plugins.
Enabling or disabling Application Monitoring takes effect immediately -- no restart required. If you pause Application Monitoring, ARMS stops monitoring your application. Proceed with caution.
Toggling individual plugins requires an application restart to take effect.
Runtime toggle settings
Enable or disable Runtime monitoring. For details, see Runtime monitoring.
Changes take effect dynamically -- no restart required. If you disable Runtime monitoring, ARMS stops collecting Runtime metrics. Proceed with caution.

Application log association
Associate log sources with your application to inject SpanId and TraceId into your logs. For details, see Associate Golang application business logs with TraceId.
You can customize the keys used for trace_id and span_id in logs.
URL convergence settings
Group similar URLs into a single entry. For example, all URLs that start with /service/demo/ appear as one combined entry.
| Setting | Description |
|---|---|
| URL convergence | Enable or disable URL grouping. |
| Convergence threshold | Minimum number of matching URLs before convergence occurs. For example, if the threshold is 100, ARMS groups URLs only when at least 100 URLs match the specified regular expression. |
| Convergence rules | Regular expression patterns for URL matching. |
For details, see ARMS convergence mechanism.

Continuous profiling settings
Enable or disable the global profiling toggle, CPU hotspots, memory hotspots, and code hotspots. For details, see Continuous profiling for Golang applications.
API call configuration
Configure slow-call detection, HTTP status code handling, request/response capture, and API filtering.
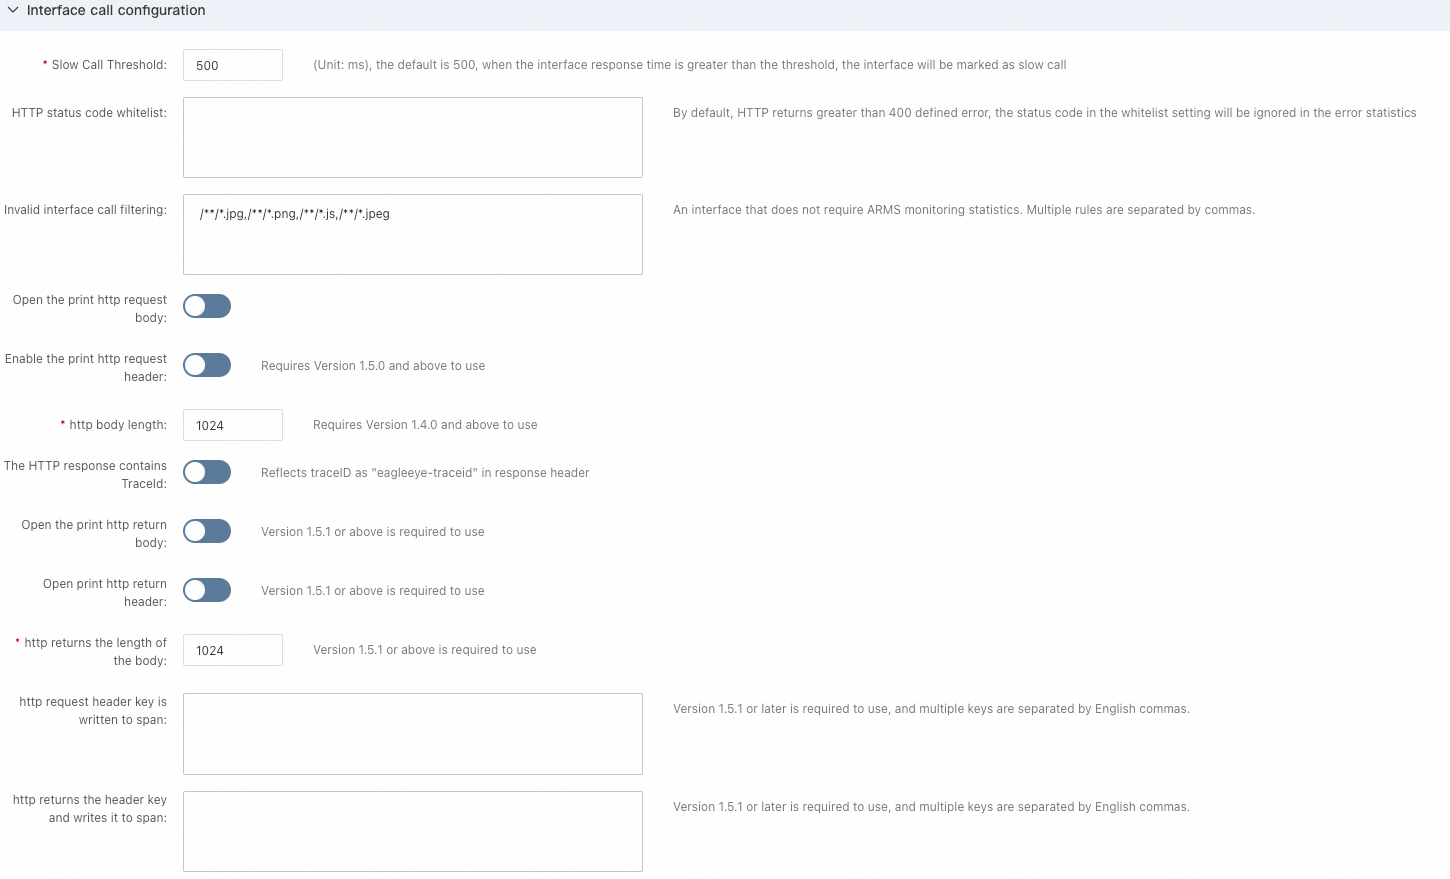
Slow call threshold
| Setting | Value |
|---|---|
| Default | 500 |
| Behavior | If an interface's response time exceeds this value, ARMS marks it as a slow call. |
HTTP status code whitelist
By default, HTTP status codes greater than 400 are classified as errors. Add specific status codes to the whitelist to prevent them from being classified as errors.
This setting applies only to HTTP frameworks supported by Application Monitoring. For supported frameworks, see Supported HTTP frameworks.
| Setting | Value |
|---|---|
| Default | Empty |
| Format | Enter individual status codes separated by commas (,). Fuzzy matching is not supported. |
| Example | 403,502 |
Impact on metrics: Error counts for HTTP servers and clients (arms_http_requests_error_count, arms_http_client_requests_error_count, and arms_app_requests_error_count) and Span status.
Impact on features: Error counts on the Application Overview, Provided Services, and Dependent Services tabs. Span status and error count alerts on the Trace Analysis page.
Invalid API call filtering
Hide specific API calls from the Provided Services tab. The probe stops reporting telemetry data for filtered APIs, so they do not appear in the API call view.
| Setting | Value |
|---|---|
| Default | /**/*.jpg,/**/*.png,/**/*.js,/**/*.jpeg,/**/*.pdf,/**/*.xlsx,/**/*.txt,/**/*.docs,/**/*.gif,/**/*.csv |
| Format | Use a string or AntPath expression to match the full API name. Separate multiple rules with commas (,). |
| Example | /api/test/*,/api/playground/create |
The default AntPath expressions are included for backward compatibility with historical data. Do not delete them. Add new rules after the existing ones.
Impact on metrics: All metrics and Spans for the specified APIs are ignored.
Impact on features: All metrics on the Application Overview, Provided Services, and Dependent Services tabs. Span count, call count, error count, and slow-call alerts on the Trace Analysis page.
HTTP request and response capture
| Setting | Description |
|---|---|
| Enable HTTP request body logging | Captures the request body and adds the http.request.body field to HTTP client Spans. |
| Enable HTTP request header logging | Captures request headers and adds the http.request.header field to HTTP client Spans. |
| HTTP request body length | Maximum length of the captured HTTP request body. The default length is 1024 characters. |
| Include TraceId in HTTP response headers | Adds the TraceId to response headers with the key Eagleeye-TraceId. |
| Enable HTTP response body logging | Captures the response body and adds the http.response.body field to HTTP server Spans. |
| Enable HTTP response header logging | Captures response headers and adds the http.response.header field to HTTP server Spans. |
| HTTP response body length | Maximum length of the captured HTTP response body. The default length is 1024 characters. |
| HTTP request header keys to include in Spans | Specify header keys (comma-separated) to add as http.request.header.key in HTTP client Spans. |
| HTTP response header keys to include in Spans | Specify header keys (comma-separated) to add as http.response.header.key in HTTP server Spans. |
Advanced exception filtering configuration
| Setting | Description |
|---|---|
| Collection plugin abnormality | Indicates whether the collection plugin is abnormal. |
| Exception filter whitelist | Hide specific exceptions from the Exception Analysis tab. Enter the exception names to exclude from exception statistics. |
Database call configuration
Configure slow SQL detection and SQL statement display options.

| Setting | Description | Restart required |
|---|---|---|
| Slow SQL threshold | If a SQL query's response time exceeds this value, ARMS marks it as a slow SQL call. | No |
| Maximum SQL length | Maximum length of captured SQL statements. | No |
| Display bound variable values in SQL | Captures variable values bound to PreparedStatement parameters. | No |
| Display constant values in SQL | Truncates SQL statements only, with no additional processing. | No |
Trace propagation protocol settings
Select the trace propagation protocol that meets your needs. W3C is the default protocol. You can also choose Zipkin, Jaeger, or EagleEye.
Probe collection configuration
Set the maximum number of traces collected per second and the probe log level.
| Setting | Description |
|---|---|
| Maximum traces per second | The maximum number of traces the probe collects each second. |
| Probe log level | The logging level for the probe. |
| Custom metric collection | Controls whether the probe collects metrics defined in your code using the OpenTelemetry SDK. |
| Enable Span reporting | Enabled by default. If disabled, no Spans are reported. |
| Span Reporting Name | The name of the Span to report after shutdown. |
| Custom metric collection configuration | Configure the metric scope name. If not configured, all custom metrics are collected by default. |
Default metric collection filtering
Filter the types of metrics that the probe reports. Select one or more of the following types:
| Type | Metrics covered |
|---|---|
custom_entry | Custom metrics for method monitoring |
http | HTTP server metrics |
http_client | HTTP client metrics |
rpc | RPC server call metrics |
rpc_client | RPC client call metrics |
sql | Database access metrics |
nosql | NoSQL service access metrics |
cache | Cache service access metrics |
producer | Message publishing metrics |
consumer | Message consumption metrics |
schedule | Scheduling service metrics |
Advanced settings
Configure percentile calculations, slow call and error sampling, and the maximum stack trace length for exceptions.

Copy settings to other applications
Apply the same configuration to other applications.
Copy a single setting
In the section for the setting, click Save and bulk copy to other applications.
If the Current settings not saved dialog box appears, click OK to save the setting for the current application, and then click Save and bulk copy to other applications again.
Select the target applications and click OK.
Copy all settings
At the bottom of the page, click Save and bulk copy to other applications.
If the Current settings not saved dialog box appears, click OK to save the settings for the current application, and then click Save and bulk copy to other applications again.
Select the target applications and click OK.
Save as global defaults
Save the current configuration as the global default. All new applications use these settings automatically.
At the bottom of the page, click Save current app settings as global default configuration.
If the Current settings not saved dialog box appears, click OK to save the settings for the current application, and then click Save current app settings as global default configuration again.
In the confirmation dialog box, click Confirm.