High CPU utilization on a Tair (and Redis Open-Source Edition) instance is typically caused by three main factors. First, services with high concurrency and high throughput consume significant CPU resources. This is considered normal if the CPU resources have not reached a bottleneck. Second, the service load exceeds expectations, and the CPU resources of the Redis Open-Source Edition instance are insufficient for your business demands. You can resolve this resource bottleneck by increasing the number of shards or replicas, or by upgrading to Tair (Enterprise Edition). Third, improper use, such as executing high-consumption commands or accessing hot keys or large keys, causes abnormally high CPU utilization. If the average CPU utilization exceeds 70% or the average peak CPU utilization within a continuous 5-minute period exceeds 90%, you should promptly investigate and resolve the issue to ensure your application runs stably.
What causes abnormally high CPU utilization
High-consumption commands: These are commands with a time complexity of O(N), where N is a large value. Examples include KEYS, HGETALL, or using MGET, MSET, HMSET, and HMGET to operate on many keys at once.
Because Redis is single-threaded, running high-consumption commands on an instance can cause other commands to queue, which slows down the application response. In extreme cases, this can block the entire instance, causing application timeouts or traffic to bypass the cache layer and hit the backend database directly, which can trigger an avalanche effect.
NoteFor more information about the time complexity of each command, see Commands.
Hot keys: A hot key exists when the number of access requests for one or more keys significantly exceeds that of other keys. Hot keys consume a large amount of the instance's CPU resources, which affects the access latency for other keys. In a cluster architecture, if hot keys are concentrated on a few data shards, it can lead to CPU utilization skew, where the CPU utilization of some shards is much higher than that of others.
Large keys: Large keys occupy more memory. Accessing large keys also significantly increases the instance's CPU load and network traffic. Large keys are more likely to become hot spots, which causes high CPU utilization. If large keys are concentrated on a few data shards, it can lead to skew in CPU utilization, bandwidth usage, and memory usage.
Short-lived connections: Frequent connection establishment and termination consumes a large amount of the instance's resources for connection handling.
AOF: The instance has append-only file (AOF) enabled by default. When the instance is under a high load, the AOF disk-writing behavior increases CPU utilization and the overall response latency of the instance.
Classification of abnormally high CPU utilization scenarios
High CPU utilization typically occurs in one of the following three scenarios:
During a specific time period, CPU utilization suddenly increases, sometimes reaching 100%. For troubleshooting and solutions, see Sudden increase in CPU utilization.
The CPU utilization of one data node is high, while the CPU utilization of other data nodes is low. For troubleshooting and solutions, see Inconsistent CPU utilization across data nodes.
The CPU utilization of one proxy node is high, while the CPU utilization of other proxy nodes is low. For troubleshooting and solutions, see Inconsistent CPU utilization across proxy nodes.
Take measures to reduce CPU utilization based on your specific scenario.
Sudden increase in CPU utilization
If the global CPU utilization of the instance increases suddenly, follow these steps to troubleshoot and optimize it.
Find and disable high-consumption commands
Troubleshooting steps
Use the performance monitoring feature to identify the specific time period when CPU utilization is high. For more information, see View performance monitoring data.
Use the following methods to find high-consumption commands:
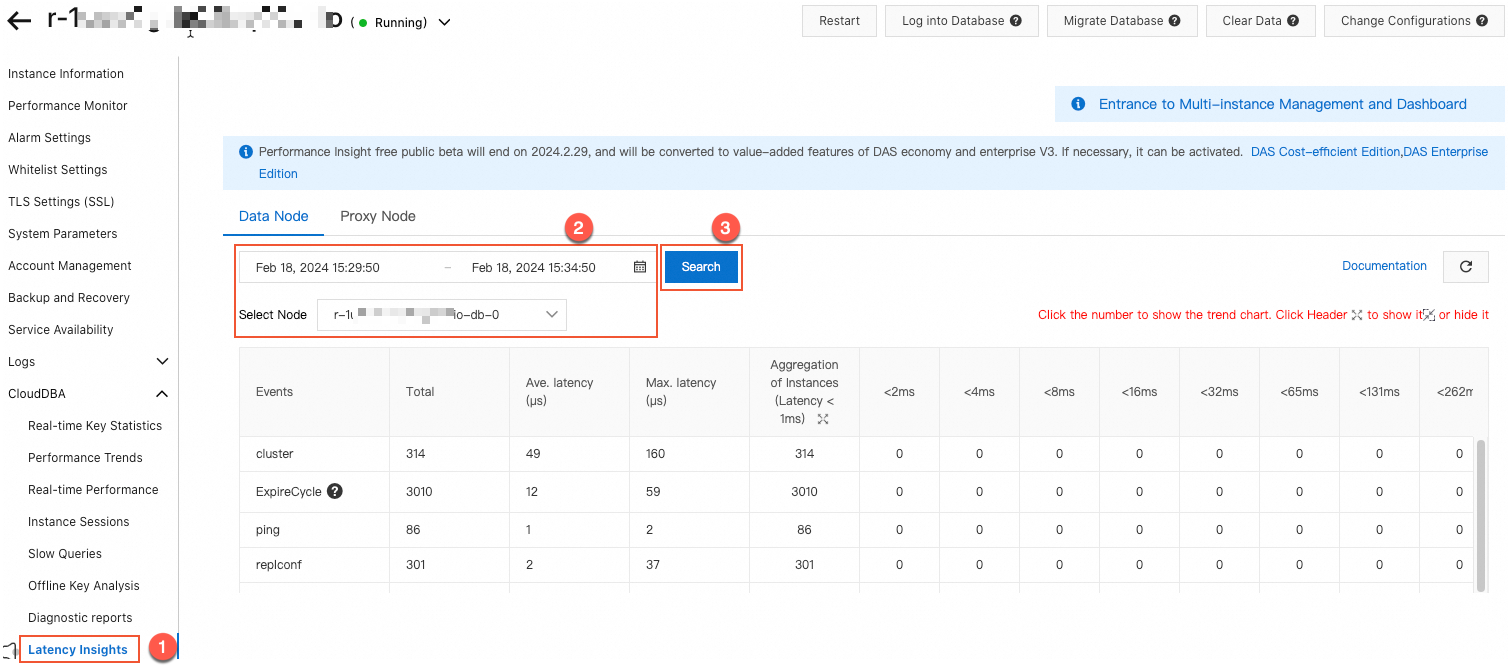
The Latency Insight feature records the latency of all commands and custom events for the instance. You can use the latency information for a specified time period and node to find high-consumption commands with long latencies.
Figure 1. Latency Insight example
The slow query log feature records commands that run longer than a specified threshold (20 ms by default). You can use the slow query statements and running times for a specified time period and node to find high-consumption commands with long running times.
Solutions
Evaluate and disable high-risk and high-consumption commands, such as FLUSHALL, KEYS, and HGETALL. For more information, see Disable high-risk commands.
Optional: Adjust the instance using one of the following methods based on your business needs:
Change the instance to a read/write splitting architecture to offload high-consumption commands or applications.
Change the instance to a Tair memory-optimized type to use its multi-threaded feature to reduce CPU utilization.
NoteFor more information about how to change the architecture and type of an instance, see Change the configuration of an instance.
Find and optimize short-lived connections
Troubleshooting steps
Use the performance monitoring feature to identify the specific time period when CPU utilization is high. For more information, see View performance monitoring data.
On the performance monitoring page, check if CPU utilization and the number of connections are high, but the queries per second (QPS) is lower than expected. If so, short-lived connections may exist. Refer to the solutions below.
Solutions
You can change short-lived connections to persistent connections, for example, using a JedisPool connection pool. For more information, see Client connection tutorials.
You can change the instance to a Tair memory-optimized type. Tair memory-optimized instances have a short-lived connection optimization feature.
Disable AOF
The instance has AOF enabled by default. When the instance is under a high load, frequent AOF operations can increase CPU utilization.
If your business logic allows, you can consider disabling persistence. You can also schedule the instance's data backup to a low-traffic period or a maintenance time window to reduce the impact.
If your instance is a Tair memory-optimized type, disabling AOF prevents you from restoring data from AOF files. This means the data flashback feature is unavailable. You can only restore data to a new instance from a backup set. Proceed with caution.
Evaluate service capacity
After troubleshooting and optimizing with the steps above, if the overall instance load is still frequently high (average CPU utilization above 70%) during normal operation, a performance bottleneck may exist.
First, check for abnormal business access, such as abnormal commands or unusual access from a specific application host. These issues require optimization at the application level. If all access is normal, the high load is a normal result of your business behavior. To ensure stable operation, you can upgrade the instance specifications, or upgrade it to a cluster architecture or a read/write splitting architecture. For more information about how to upgrade an instance, see Change the configuration of an instance.
To ensure normal business operation, before you upgrade the instance, purchase a pay-as-you-go instance to complete load and compatibility testing. You can release the instance after the testing is complete.
Inconsistent CPU utilization across data nodes
If the instance uses a cluster architecture or a read/write splitting architecture, and you find that some data shard nodes have high CPU utilization while others have low CPU utilization, you can follow these steps to troubleshoot and optimize.
Find and optimize hot keys
Troubleshooting steps
Use the performance monitoring feature to identify the specific time period when CPU utilization is high. For more information, see View performance monitoring data.
On the history page of Top Key Statistics, select the data node with high CPU utilization. Then, based on the time period identified in Step 1, select the time filter and click View. You can see which hot keys existed during this period.
Solutions
Split hot keys based on business logic, such as by user ID or time range.
If the hot keys are generated by read requests, you can change the instance to a read/write splitting architecture to reduce the read request pressure on each data shard.
NoteIn scenarios with extremely high request volumes, a read/write splitting architecture has unavoidable replication latency, which can lead to reading dirty data. Therefore, this architecture is not the optimal solution for scenarios with high read and write pressure and strict requirements for data consistency.
Find and disable high-consumption commands
Troubleshooting steps
Use the performance monitoring feature to identify the specific time period when CPU utilization is high. For more information, see View performance monitoring data.
Use the following methods to find high-consumption commands:
The Latency Insight feature records the latency of all commands and custom events for the instance. You can use the latency information for a specified time period and node to find high-consumption commands with long latencies.
Figure 1. Latency Insight example
The slow query log feature records commands that run longer than a specified threshold (20 ms by default). You can use the slow query statements and running times for a specified time period and node to find high-consumption commands with long running times.
Solution
Evaluate and disable high-risk and high-consumption commands, such as FLUSHALL, KEYS, and HGETALL. For more information, see Disable high-risk commands.
Find and optimize large keys
Troubleshooting steps
Use the performance monitoring feature to identify the specific time period when CPU utilization is high. For more information, see View performance monitoring data.
On the Offline Full Key Analysis page, click Analyze Now. Select the data node with high CPU utilization and click OK. You can see which large keys existed during this period.
Solution
Based on your business needs, you can split large keys into smaller keys to distribute the request pressure.
Inconsistent CPU utilization across proxy nodes
If the instance uses a cluster architecture or a read/write splitting architecture, and you find that some proxy nodes have high CPU utilization while other proxy nodes have low CPU utilization, you can follow these steps to troubleshoot and optimize.
Troubleshooting steps
On the Proxy Nodes page of Performance Trend, check whether the Connections usage is balanced.
Solutions
Take the following measures based on whether the connection usage is balanced:
If the connection usage is balanced: Restart the client of the service or the proxy node to reallocate connections. To restart a proxy node, see Restart or rebuild a proxy node.
If the connection usage is unbalanced: This is usually caused by oversized pipeline or batch operations. You can reduce the scale of these operations, for example, by splitting them into multiple smaller operations.