Insufficient memory in Tair (Redis OSS-compatible) can cause key evictions, increased response time, and unstable queries per second (QPS)—all of which interrupt your workloads. This topic covers three distinct high-memory scenarios, how to identify which one you're facing, and how to resolve it.
Jump to your scenario:
Identify your scenario
High memory usage falls into one of three patterns:
Consistently high — Memory usage remains elevated for an extended period. If it exceeds 95%, act immediately.
Sudden spike — Memory usage is normally low but spikes sharply, sometimes reaching 100%.
Data node skew — Overall instance memory is low, but a specific data node approaches 100%.
Solutions to consistently high memory usage
Remove unnecessary keys. Audit existing keys against your business requirements and delete any that are no longer needed.
Analyze key distribution with offline key analysis. Use the offline key analysis feature to inspect two dimensions:
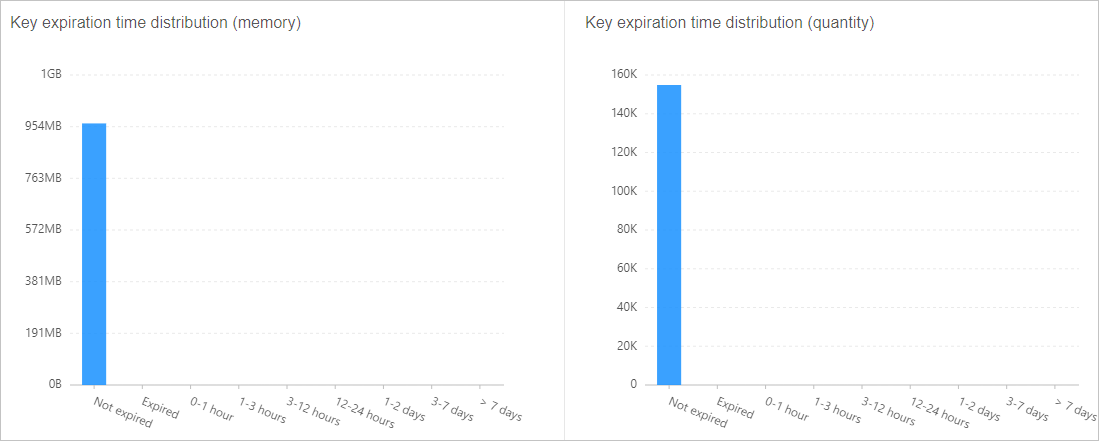
TTL distribution — Identify keys with no expiration set and configure appropriate time-to-live (TTL) values on the client side. Figure 4. Key TTL distribution example
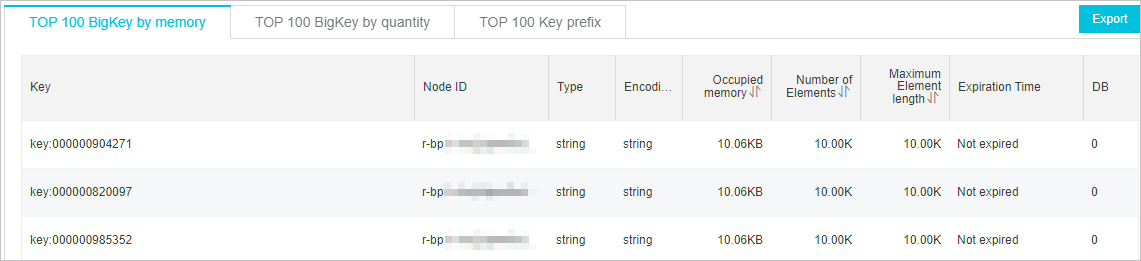
Large key analysis — Identify oversized keys and split them on the client. Figure 5. Large key analysis example
Set an eviction policy. Configure the
maxmemory-policyparameter based on your access patterns. The default policy isvolatile-lru. For guidance on eviction behavior, see How does Tair (Redis OSS-compatible) evict data by default? For configuration steps, see Configure instance parameters.Tune the background task frequency. Set
hzto a value below 100. Higher values increase CPU utilization. For instances running major version 5.0 or later, enable dynamic frequency control instead. See Adjust the frequency of background tasks and Enable dynamic frequency control for background tasks.Upgrade the instance. If memory usage remains high after completing the previous steps, increase the instance's memory capacity. Before upgrading, purchase a pay-as-you-go instance to validate that the target specifications meet your workload requirements, then release it after testing. See Change the configurations of an instance and Release pay-as-you-go instances.
Solutions to a sudden spike in memory usage
Causes
A sudden memory spike typically stems from one of four causes:
A large volume of new data written in a short period
A large number of new connections established simultaneously
A traffic burst exceeding network bandwidth, causing a backlog in input and output buffers
Client-side processing lag causing a backlog in the output buffer
Work through each cause below to identify the root cause and apply the appropriate fix.
Check whether a large data write caused the spike
How to identify: On the Performance Monitor page, compare inbound traffic and write QPS trends against memory usage. If all three rise together, the spike is write-driven.
Fix:
Set TTL values on keys to auto-expire data that is no longer needed, or delete stale keys manually.
Increase the memory capacity by upgrading the instance. See Change the configurations of an instance.
If the instance is a standard instance and memory pressure persists after increasing capacity, upgrade to a cluster instance. This distributes data across multiple shards, reducing per-shard memory pressure. See Change the configurations of an instance.
Check whether a connection surge caused the spike
How to identify: On the Performance Monitor page, check the number of connections. If the connection count rises in step with memory usage, the spike is connection-driven.
Fix:
Check for connection leaks in your application.
Configure connection timeouts to close idle connections automatically. See Specify a timeout period for client connections.
Check whether a traffic burst is filling the input and output buffers
How to identify:
Check whether inbound and outbound traffic usage reaches 100% on the Performance Monitor page.
In redis-cli, run
MEMORY STATSand check the value ofclients.normal.Noteclients.normalreflects the total memory consumed by the input and output buffers across all normal client connections. This value grows when clients run range-based operations or send and receive large keys at low throughput. Asclients.normalgrows, available memory for data storage shrinks, which can trigger out-of-memory (OOM) errors.
Fix:
Identify and address the root cause of the traffic burst.
Increase the instance's network bandwidth. See Manually increase the bandwidth of an instance and Enable bandwidth auto scaling.
Upgrade the instance specifications to give the input and output buffers sufficient headroom. See Change the configurations of an instance.
Check whether a client-side bottleneck is filling the output buffer
How to identify: In redis-cli, run MEMORY DOCTOR. If big_client_buf is set to 1, at least one client has an oversized output buffer consuming significant memory.
Fix: Run CLIENT LIST to identify which client has a large omem value, then investigate whether that client application has a performance bottleneck.
Solutions to memory skew on a data node
Symptoms
For cluster instances, memory skew may appear through any of these signals:
A CloudMonitor alert indicates that the memory usage of a specific data node exceeds the configured threshold.
The instance diagnostic report flags memory usage skew.
On the Performance Monitor page, overall instance memory is low, but a specific data node shows high memory usage.
Memory skew occurs when overall instance memory is low but one or more individual data nodes are near capacity.
Fix large keys
Identify large keys using the offline key analysis feature or follow the guidance in Identify and handle large keys and hot keys.
Split large keys on the client. For example, split a hash with tens of thousands of members into multiple smaller hashes with an appropriate member count. In a cluster instance, distributing those smaller hashes across different slots evens out memory pressure across shards.
Fix uneven hash tag distribution
If your keys use hash tags, consider splitting a single hash tag into multiple hash tags so that data distributes more evenly across data nodes.
Upgrade instance specifications
Increasing the memory allocated to each shard can relieve skew as a short-term measure. See Change the configurations of an instance.
The system runs a data skew precheck when you change instance specifications. If the selected instance type cannot handle the existing skew, the system returns an error. Select a higher-specification instance type and try again.
After upgrading, memory skew may be alleviated, but skew may shift to bandwidth or CPU resources.
Appendix: Check memory usage with Redis commands
MEMORY STATS
MEMORY DOCTOR
Run MEMORY DOCTOR in redis-cli to get memory diagnostic suggestions.
Figure 3. Diagnostic result example 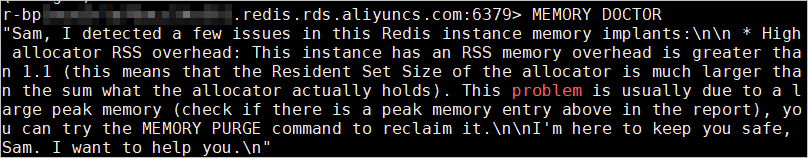
The command evaluates the following diagnostic flags:
int empty = 0;          /* Instance is empty or almost empty. */
int big_peak = 0;       /* Memory peak is much larger than used memory. */
int high_frag = 0;      /* High fragmentation. */
int high_alloc_frag = 0;/* High allocator fragmentation. */
int high_proc_rss = 0;  /* High process RSS overhead. */
int high_alloc_rss = 0; /* High RSS overhead. */
int big_slave_buf = 0;  /* Replica buffers are too large. */
int big_client_buf = 0; /* Client buffers are too large. */
int many_scripts = 0;   /* Script cache holds too many scripts. */
MEMORY USAGE
How memory is allocated in Tair (Redis OSS-compatible)
Instance memory breaks down into three parts:
| Component | Description |
|---|---|
| Link-related operations | Input buffer, output buffer, JIT overhead, Fake Lua Link, and cached Lua scripts. Consumption changes dynamically. Run INFO and check the Clients section for current values. Input and output buffer usage grows when clients run range-based operations or send and receive large keys at low throughput, which reduces available data storage and can cause OOM errors. |
| Data storage | Memory consumed by your stored field values. This is the primary area to analyze when diagnosing high memory usage. |
| Management overhead | Hash tables, replication buffer, and AOF buffer. This component stays stable in the range of 32 MB to 64 MB under normal conditions. A very large number of keys—on the order of hundreds of millions—can push this component higher. |
Most OOM issues stem from inefficient management of dynamically allocated memory. For example, request backlogs caused by throttling can cause dynamically acquired memory to grow rapidly. Complex or poorly written Lua scripts can also trigger OOM. Tair (Enterprise Edition) includes enhanced memory management for dynamically allocated and freed memory. For details, see Overview.