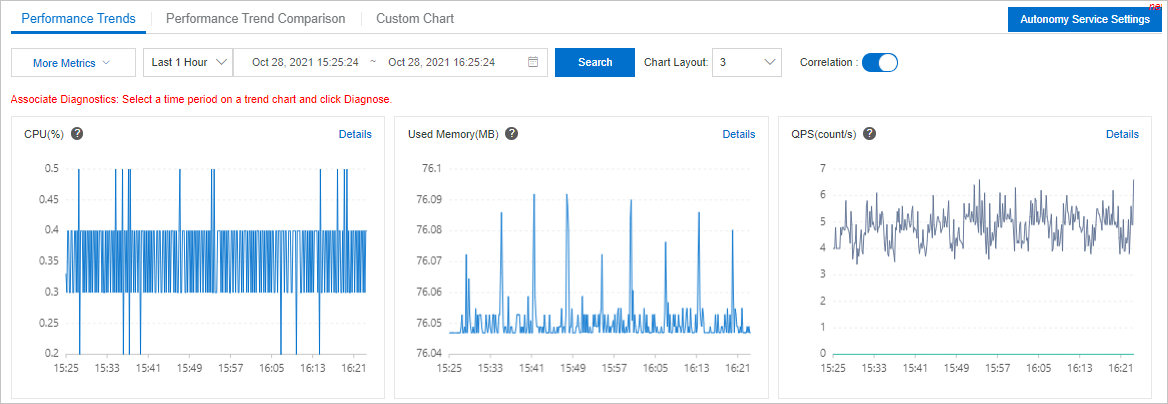
When a Tair (Redis OSS-compatible) instance shows latency spikes or unexpected resource consumption, CloudDBA's performance trends feature lets you pinpoint the issue by visualizing key metrics over a time range you choose. You can also compare two time periods side by side to identify regressions after a configuration change or traffic shift.
Prerequisites
Before you begin, ensure that you have:
A Tair (Redis OSS-compatible) instance
Access to the Alibaba Cloud console
View performance trends
Log on to the console and go to the Instances page. In the top navigation bar, select the region where the instance is deployed, then click the instance ID.
In the left-side navigation pane, choose CloudDBA > Performance Trends.
Use one of the following methods to view performance data.

Performance Trends tab
On the Performance Trends tab, specify a time range, select the metrics to display, and click Search.
The available metrics are:
| Metric | What it tells you |
|---|---|
| CPU utilization | Whether the instance is CPU-bound; sustained high CPU often precedes latency increases |
| Memory usage | How close the instance is to its memory limit; high usage can trigger evictions |
| Queries per second (QPS) | Request throughput; useful for correlating traffic spikes with performance changes |
| Total number of connections | Client connection count; unexpectedly high values may indicate connection leaks |
| Response time | End-to-end latency for client requests |
| Network traffic | Inbound and outbound bandwidth consumption |
| Key hit ratio | Cache effectiveness; a declining ratio means more requests are hitting the backend |
For read/write splitting or cluster instances, select a specific node to view node-level metrics.
By default, Correlation is enabled — moving the pointer over one chart (for example, the CPU chart) causes all other charts to display metrics for the same point in time.
To view the definition of a metric, click the
 icon in the upper-left corner of the metric chart. To open a larger view of a chart, click Details in the upper-right corner.
Performance Trend Comparison tab
To compare performance across two time periods, click the Performance Trend Comparison tab, specify two time ranges, select the metrics to compare, and click Search.
This method is useful for confirming whether a configuration change or deployment improved or degraded instance performance.
Custom Charts
The Performance Trends and Performance Trend Comparison tabs display the basic performance metrics of an instance. To create a view that shows only a subset of metrics, configure custom performance trend charts. For more information, see Add a custom performance trend chart.