This topic describes the diagnostics procedure for nodes and how to troubleshoot node exceptions. This topic also provides answers to some frequently asked questions (FAQ) about nodes.
Table of contents
Category | Content |
Diagnostics procedure | |
Common troubleshooting methods | |
Common issues and solutions |
|
Diagnostics procedure

Check whether a node is abnormal. For more information, see the Check node status section of this topic.
If a node is in the NotReady state, perform the following steps to troubleshoot the issue:
Check whether the values of the following node conditions are True: PIDPressure, DiskPressure, and MemoryPressure. If one of the node conditions is True, troubleshoot the issue based on the keyword of the node condition. For more information, see the dockerd exceptions - RuntimeOffline, Insufficient memory resources - MemoryPressure, or Insufficient inodes - InodesPressure section of this topic.
Check the key components and logs of nodes.
kubelet
Check the status, logs, and configurations of kubelet. For more information, see the Check the key components of nodes section of this topic.
If an exception occurs in kubelet, troubleshoot the exception. For more information, see the kubelet exceptions section of this topic.
dockerd
Check the status, logs, and configurations of dockerd. For more information, see the Check the key components of nodes section of this topic.
If an exception occurs in dockerd, troubleshoot the exception. For more information, see the dockerd exceptions - RuntimeOffline section of this topic.
containerd
Check the status, logs, and configurations of containerd. For more information, see the Check the key components of nodes section of this topic.
If an exception occurs in containerd, troubleshoot the exception. For more information, see the containerd exceptions - RuntimeOffline section of this topic.
NTP
Check the status, logs, and configurations of the Network Time Protocol (NTP) service. For more information, see the Check the key components of nodes section of this topic.
If an exception occurs in the NTP service, troubleshoot the exception. For more information, see the NTP exceptions - NTPProblem section of this topic.
Collect and check the diagnostics log of the node. For more information, see the Collect the diagnostics logs of nodes section of this topic.
Check the monitoring data of the node, including the usage of CPU, memory, and network resources. For more information, see the Check the monitoring data of nodes section of this topic. If the resource usage is abnormal, troubleshoot the exception. For more information, see the Insufficient CPU resources or Insufficient memory resources - MemoryPressure section of this topic.
If the node is in the Unknown state, perform the following steps to troubleshoot the issue:
Check whether the Elastic Compute Service (ECS) instance that hosts the node is in the Running state.
Check the key components of the node.
kubelet
Check the status, logs, and configurations of kubelet. For more information, see the Check the key components of nodes section of this topic.
If an exception occurs in kubelet, troubleshoot the exception. For more information, see the kubelet exceptions section of this topic.
dockerd
Check the status, logs, and configurations of dockerd. For more information, see the Check the key components of nodes section of this topic.
If an exception occurs in dockerd, troubleshoot the exception. For more information, see the dockerd exceptions - RuntimeOffline section of this topic.
containerd
Check the status, logs, and configurations of containerd. For more information, see the Check the key components of nodes section of this topic.
If an exception occurs in containerd, troubleshoot the exception. For more information, see the containerd exceptions - RuntimeOffline section of this topic.
NTP
Check the status, logs, and configurations of the NTP service. For more information, see the Check the key components of nodes section of this topic.
If an exception occurs in the NTP service, troubleshoot the exception. For more information, see the NTP exceptions - NTPProblem section of this topic.
Check the network connectivity of the node. For more information, see the Check the security groups of nodes section of this topic. If a network exception occurs, troubleshoot the exception. For more information, see the Network exceptions section of this topic.
Collect and check the diagnostics log of the node. For more information, see the Collect the diagnostics logs of nodes section of this topic.
Check the monitoring data of the node, including the usage of CPU, memory, and network resources. For more information, see the Check the monitoring data of nodes section of this topic. If the resource usage is abnormal, troubleshoot the exception. For more information, see the Insufficient CPU resources or Insufficient memory resources - MemoryPressure section of this topic.
If the issue persists after you perform the preceding operations, use the diagnostics feature provided by Container Service for Kubernetes (ACK) to troubleshoot the issue. For more information, see the Use the node diagnosis feature section of this topic.
Common troubleshooting methods
Use the node diagnosis feature
If an exception occurs on a node, you can use the diagnostics feature provided by ACK to troubleshoot the exception.
Log on to the ACK console. In the navigation pane on the left, click Clusters.
On the Clusters page, click the name of the one you want to change. In the navigation pane on the left, choose .
On the Nodes page, find the target node and choose in the Actions column.
In the panel that appears, click Create diagnosis, then view diagnostics results and corresponding remediation suggestions in the console page.
Check node details
Log on to the ACK console. In the navigation pane on the left, click Clusters.
On the Clusters page, click the name of the one you want to change. In the navigation pane on the left, choose .
On the Nodes page, find the node you want to check and click the name of the node or click Details in the Actions column.
Check node status
Log on to the ACK console. In the navigation pane on the left, click Clusters.
On the Clusters page, click the name of the one you want to change. In the navigation pane on the left, choose .
On the Nodes page, view the status of each node.
If a node is in the Ready state, the node is running as expected.
If a node is not in the Ready state, you can click the name of the node or click Details in the Actions column of the node to view the node details.
NoteIf you want to collect information about node conditions such as InodesPressure, DockerOffline, and RuntimeOffline, you must install node-problem-detector in your cluster and create an event center. The event center feature is automatically enabled when you create the cluster. For more information, see Create and use an event center.
Check node events
Log on to the ACK console. In the navigation pane on the left, click Clusters.
On the Clusters page, click the name of the one you want to change. In the navigation pane on the left, choose .
On the Nodes page, find the target node and click the node name or click Details in the Actions column.
In the lower part of the node details page, you can view the events that are related to the node.
Collect the diagnostics logs of nodes
Use the node diagnosis feature provided by the Container Intelligence Service in the console to collect diagnostics logs. For more information, see Node diagnostics.
Use a script to collect diagnostics logs. For more information, see the How do I collect the diagnostic data of an ACK cluster? section of the "FAQ about cluster management" topic.
Check the key components of nodes
kubelet:
Check the status of kubelet
Log on to the node on which kubelet runs and run the following command to query the status of the kubelet process:
systemctl status kubeletExpected output:

Check the logs of kubelet
Log on to the node on which kubelet runs and run the following command to print the logs of kubelet: For more information about how to check the logs of kubelet, see the Collect the diagnostics logs of nodes section of this topic.
journalctl -u kubeletCheck the configurations of kubelet
Log on to the node on which kubelet runs and run the following command to check the configurations of kubelet:
cat /etc/systemd/system/kubelet.service.d/10-kubeadm.conf
Runtime:
Check dockerd
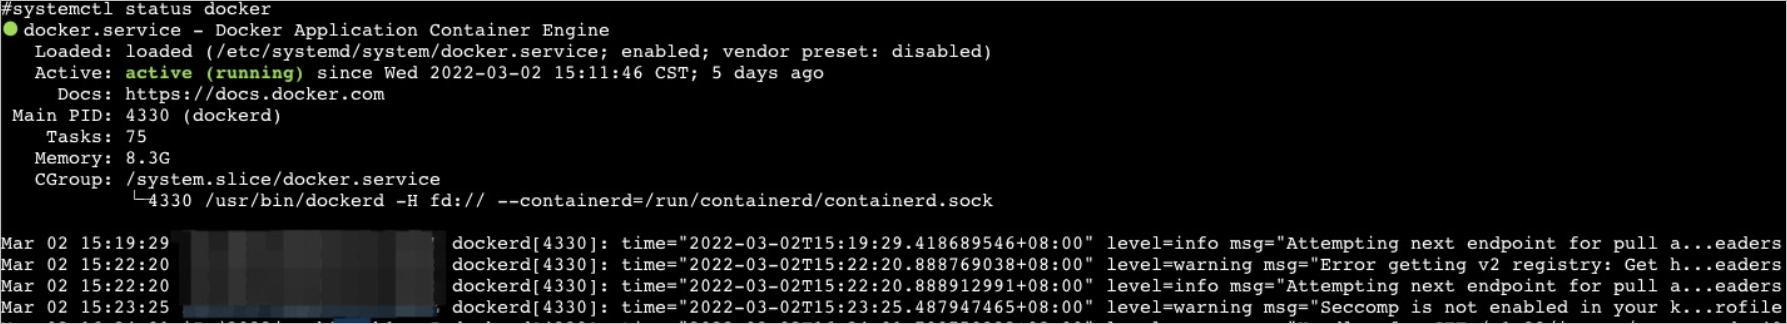
Check the status of dockerd
Log on to the node on which dockerd runs and run the following command to query the status of the dockerd process:
systemctl status dockerExpected output:
Check the logs of dockerd
Log on to the node on which dockerd runs and run the following command to print the logs of dockerd: For more information about how to check the logs of dockerd, see the Collect the diagnostics logs of nodes section of this topic.
journalctl -u dockerCheck the configurations of dockerd
Log on to the node on which dockerd runs and run the following command to query the configurations of dockerd:
cat /etc/docker/daemon.json
Check containerd
Check the status of containerd
Log on to the node on which containerd runs and run the following command to query the status of the containerd process:
systemctl status containerdExpected output:

Check the logs of containerd
Log on to the node on which containerd runs and run the following command to print the logs of containerd: For more information about how to check the logs of containerd, see the Collect the diagnostics logs of nodes section of this topic.
journalctl -u containerd
NTP:
Check the status of the NTP service
Log on to the node on which the NTP service runs and run the following command to query the status of the chronyd process:
systemctl status chronydExpected output:

Check the logs of the NTP service
Log on to the node on which the NTP service runs and run the following command to print the logs of the NTP service:
journalctl -u chronyd
Check the monitoring data of nodes
CloudMonitor
ACK is integrated with CloudMonitor. You can log on to the CloudMonitor console to view the monitoring data of the ECS instances that are deployed in your ACK cluster. For more information about how to monitor nodes, see Monitor nodes.
Managed Service for Prometheus
Log on to the ACK console. In the navigation pane on the left, click Clusters.
On the Clusters page, find the cluster you want and click its name. In the left-side pane, choose .
On the Prometheus Monitoring page, click the Node Monitoring tab, and click the Nodes tab.
On the Nodes tab, select a node from the drop-down list to view the monitoring data of the node, such as the CPU, memory, and disk resources.
Check the security groups of nodes
For more information, see Overview and Configure security groups for clusters.
kubelet exceptions
Cause
Kubelet exceptions are typically caused by issues with the kubelet process itself, the container runtime, or invalid kubelet configurations.
Issue
The status of kubelet is inactive.
Solution
Run the following command to restart kubelet. The restart operation does not affect the containers that are running.
systemctl restart kubeletAfter kubelet restarts, log on to the node on which kubelet runs and run the following command to check whether the status of kubelet is normal:
systemctl status kubeletIf the status of kubelet is abnormal, run the following command on the node to print the logs of kubelet:
journalctl -u kubeletIf you find an exception in the kubelet logs, troubleshoot the exception based on the keyword.
If the kubelet configuration is invalid, run the following command to modify the configuration:
vi /etc/systemd/system/kubelet.service.d/10-kubeadm.conf   #Modify the configurations of kubelet.
systemctl daemon-reload;systemctl restart kubelet         #Reload the configurations and restart kubelet.
dockerd exceptions - RuntimeOffline
Cause
In most cases, a dockerd exception occurs because the dockerd configuration is invalid, the dockerd process is overloaded, or the node is overloaded.
Issues
The status of dockerd is inactive.
The status of dockerd is active (running) but dockerd does not run as expected. As a result, an exception occurs on the node. In this case, you may fail to run the
docker psordocker execcommand.The value of the node condition RuntimeOffline is True.
If you enabled the alerting feature for cluster nodes, you can receive alerts when an exception occurs on the node on which dockerd runs. For more information about how to configure alert rules, see Alert management.
Solution
Run the following command to restart dockerd:
systemctl restart dockerAfter dockerd restarts, log on to the node and run the following command to check whether the status of dockerd is normal:
systemctl status dockerIf the status of dockerd is abnormal, run the following command on the node to print the logs of dockerd:
journalctl -u docker
containerd exceptions - RuntimeOffline
Cause
In most cases, a containerd exception occurs because the containerd configuration is invalid, the containerd process is overloaded, or the node is overloaded.
The status of containerd is inactive.
The value of the node condition RuntimeOffline is True.
If you enabled the alerting feature for cluster nodes, you can receive alerts when an exception occurs on the node on which containerd runs. For more information about how to configure alert rules, see Alert management.
Solution
Run the following command to restart containerd:
systemctl restart containerdAfter containerd restarts, log on to the node and run the following command to check whether the status of containerd is normal:
systemctl status containerdIf the status of containerd is abnormal, run the following command on the node to print the logs of containerd:
journalctl -u containerd
NTP exceptions - NTPProblem
Cause
In most cases, an NTP exception occurs because the status of the NTP process is abnormal.
Issues
The status of chronyd is inactive.
The value of the node condition NTPProblem is True.
If you enabled the alerting feature for cluster nodes, you can receive alerts when an exception occurs on the node on which the NTP service runs. For more information about how to configure alert rules, see Alert management.
Solution
Run the following command to restart chronyd:
systemctl restart chronydAfter chronyd restarts, log on to the node and run the following command to check whether the status of chronyd is normal:
systemctl status chronydIf the status of chronyd is abnormal, run the following command on the node to print the logs of chronyd:
journalctl -u chronyd
PLEG exceptions - PLEG is not healthy
Cause
The Pod Lifecycle Event Generator (PLEG) records all events that occur throughout the lifecycle of pods, such as events that are related to container startups or terminations. In most cases, the PLEG is not healthy exception occurs because the container runtime on the node is abnormal or the node uses an earlier systemd version.
Issues
The status of the node is NotReady.
The following content exists in the logs of kubelet:
I0729 11:20:59.245243 9575 kubelet.go:1823] skipping pod synchronization - PLEG is not healthy: pleg was last seen active 3m57.138893648s ago; threshold is 3m0s.If you enabled the alerting feature for cluster nodes, you can receive alerts when a PLEG exception occurs. For more information about how to configure alert rules, see Alert management.
Solution
Restart the following key components on the node in sequence: dockerd/containerd and kubelet. Then, check whether the status of the node is normal.
If the node does not recover after restarting its key components, try restarting the entire node instance. For more information, see Restart an instance.
WarningThe restart operation also restarts the pods on the node. Proceed with caution.
If the abnormal node runs CentOS 7.6, troubleshoot the exception by referring to What Can I Do if the Logs of the kubelet Contain the "Reason:KubeletNotReady Message:PLEG is not healthy:" error When CentOS 7.6 Is Used.
Insufficient node resources for scheduling
Cause
This issue typically occurs when the nodes in the cluster have insufficient resources to meet the scheduling demands of new pods.
Issues
If resources provided by the nodes in your cluster are insufficient, pod scheduling fails and one of the following errors is returned:
Insufficient CPU resources: 0/2 nodes are available: 2 Insufficient cpu
Insufficient memory resources: 0/2 nodes are available: 2 Insufficient memory
Insufficient temporary storage resources: 0/2 nodes are available: 2 Insufficient ephemeral-storage
The scheduler determines whether the resources provided by a node are insufficient based on the following rules:
Insufficient CPU: Pod's requested CPU > (Node's allocatable CPU - Node's already allocated CPU)
Insufficient memory: Pod's requested memory > (Node's allocatable memory - Node's already allocated memory)
Insufficient ephemeral storage: Pod's requested ephemeral storage > (Node's allocatable ephemeral storage - Node's already allocated ephemeral storage)
If the amount of resources requested by a pod is greater than the difference between the total amount of allocatable resources provided by a node and the amount of resources allocated from the node, the pod is not scheduled to the node.
Run the following command to query information about the resource allocation on the node:
kubectl describe node [$nodeName]Expected output:
Allocatable:
  cpu:                3900m
  ephemeral-storage:  114022843818
  hugepages-1Gi:      0
  hugepages-2Mi:      0
  memory:             12601Mi
  pods:               60
Allocated resources:
  (Total limits may be over 100 percent, i.e., overcommitted.)
  Resource           Requests    Limits
  --------           --------    ------
  cpu                725m (18%)  6600m (169%)
  memory             977Mi (7%)  16640Mi (132%)
  ephemeral-storage  0 (0%)      0 (0%)
  hugepages-1Gi      0 (0%)      0 (0%)
  hugepages-2Mi      0 (0%)      0 (0%)
Parameters:
Allocatable: the amount of allocatable CPU, memory, or temporaryl storage resources provided by the node.
Allocated resources: the amount of CPU, memory, or temporary storage resources allocated from the node.
Solution
If the resources provided by the nodes are insufficient, you can use one of the following methods to reduce the loads of the nodes:
Delete the pods that you no longer require. For more information, see Manage pods.
Modify the resource configurations for the pods based on your business requirements. For more information, see the Modify the upper and lower limits of CPU and memory resources for a pod section of the "Manage pods" topic.
The resource profiling feature can provide resource specification recommendations for containers based on the historical data of resource usage. This greatly simplifies the configuration of resource requests and limits for containers. For more information, see Resource profiling.
Add nodes to the cluster. For more information, see Create and manage a node pool.
Upgrade the nodes in the cluster. For more information, see Upgrade or downgrade the configurations of a worker node.
For more information, see the Insufficient CPU resources, Insufficient memory resources - MemoryPressure, and Insufficient disk space - DiskPressure sections of this topic.
Insufficient CPU resources
Cause
In most cases, the CPU resources provided by a node become insufficient because the containers on the node have occupied an excessive amount of CPU resources.
Issues
When a node does not have sufficient CPU resources, the status of the node may become abnormal.
If you enabled the alerting feature for cluster nodes, you can receive alerts when the CPU usage of the node reaches or exceeds 85%. For more information about how to configure alert rules, see Alert management.
Solution
Check the CPU usage curve on the Node Monitoring tab of the console and identify the point in time at which the CPU usage spiked. Then, check whether the processes that run on the node have occupied an excessive amount of CPU resources. For more information, see the Check the monitoring data of nodes section of this topic.
For more information about how to reduce the loads of the node, see the Insufficient node resources for scheduling section of this topic.
Restart the node. For more information, see Restart an instance.
WarningThe restart operation also restarts the pods on the node. Proceed with caution.
Insufficient memory resources - MemoryPressure
Cause
In most cases, the memory resources provided by a node become insufficient because the containers on the node have occupied an excessive amount of memory resources.
Issues
If the amount of available memory resources on the node drops below the
memory.availablethreshold, the value of the node condition MemoryPressure changes to True. Containers are evicted from the node. For more information about container eviction, see Node-pressure Eviction.If the node does not have sufficient memory resources, the following issues occur:
The value of the node condition MemoryPressure changes to True.
Containers are evicted from the node:
You can find the The node was low on resource: memory information in the events of the containers that are evicted.
You can find the attempting to reclaim memory information in the event of the node.
An out of memory (OOM) error may occur. When an OOM error occurs, you can find the System OOM information in the event of the node.
If you enabled the alerting feature for cluster nodes, you can receive alerts when the memory usage of the node reaches or exceeds 85%. For more information about how to configure alert rules, see Alert management.
Solution
Check the memory usage curve on the Node Monitoring tab of the console and identify the point in time at which the memory usage spiked. Then, check whether memory leaks occur in the processes that run on the node. For more information, see the Check the monitoring data of nodes section of this topic.
For more information about how to reduce the loads of the node, see the Insufficient node resources for scheduling section of this topic.
Restart the node. For more information, see Restart an instance.
WarningThe restart operation also restarts the pods on the node. Proceed with caution.
Insufficient inodes - InodesPressure
Cause
In most cases, the inodes provided by a node become insufficient because the containers on the node have occupied an excessive number of inodes.
Issues
If the number of available inodes on the node drops below the
inodesFreethreshold, the value of the node condition InodesPressure changes to True. Containers are evicted from the node. For more information about container eviction, see Node-pressure Eviction.If the inodes provided by a node become insufficient, the following issues occur:
The value of the node condition InodesPressure changes to True.
Containers are evicted from the node:
You can find the The node was low on resource: inodes information in the events of the containers that are evicted.
You can find the attempting to reclaim inodes information in the event of the node.
If you enabled the alerting feature for cluster nodes, you can receive alerts when the node does not have sufficient inodes. For more information about how to configure alert rules, see Alert management.
Solution
Check the inode usage curve on the Node Monitoring tab of the console and identify the time point at which the inode usage spiked. Then, check whether the processes that run on the node have occupied an excessive number of inodes. For more information, see the Check the monitoring data of nodes section of this topic.
For more information about how to troubleshoot other issues, see Resolve the issue of insufficient disk space on a Linux instance.
Insufficient PIDs - NodePIDPressure
Cause
In most cases, the process IDs (PIDs) provided by a node become insufficient because the containers on the node have occupied an excessive number of PIDs.
Issues
If the number of available PIDs on the node drops below the
pid.availablethreshold, the value of the node condition NodePIDPressure changes to True. Containers are evicted from the node. For more information about container eviction, see Node-pressure Eviction.If you enabled the alerting feature for cluster nodes, you can receive alerts when the node does not have sufficient PIDs. For more information about how to configure alert rules, see Alert management.
Solution
Run the following commands to query the maximum number of PIDs and the greatest PID value on the node.
sysctl kernel.pid_max  #Query the maximum number of PIDs.
ps -eLf|awk '{print $2}' | sort -rn| head -n 1   #Query the greatest PID value.
Run the following command to query the top five processes that occupied the most number of PIDs:
ps -elT | awk '{print $4}' | sort | uniq -c | sort -k1 -g | tail -5Expected output:
#The first column displays the numbers of PIDs that are occupied by the processes. The second column displays the IDs of the processes.
73 9743
75 9316
76 2812
77 5726
93 5691
You can use the process IDs to find the corresponding processes and pods, diagnose the issue, and optimize the code.
Reduce the loads of the node. For more information, see the Insufficient node resources for scheduling section of this topic.
Restart the node. For more information, see Restart an instance.
WarningThe restart operation also restarts the pods on the node. Proceed with caution.
Insufficient disk space - DiskPressure
Cause
In most cases, the disk space provided by a node becomes insufficient because the containers on the node have occupied an excessive amount of disk space or the size of the container image is excessively large.
Issues
If the amount of available disk space on the node drops below the
imagefs.availablethreshold, the value of the node condition DiskPressure changes to True.If the amount of available disk space drops below the
nodefs.availablethreshold, all containers on the node are evicted. For more information about container eviction, see Node-pressure Eviction.If the disk space of a node becomes insufficient, the following issues occur:
The value of the node condition DiskPressure changes to True.
If the amount of available disk space remains lower than the health threshold after the image reclaim policy is triggered, you can find the failed to garbage collect required amount of images information in the event of the node. The default value of the health threshold is 80%.
Containers are evicted from the node:
You can find the The node was low on resource: [DiskPressure] information in the events of the containers that are evicted.
You can find the attempting to reclaim ephemeral-storage or attempting to reclaim nodefs information in the event of the node.
If you enabled the alerting feature for cluster nodes, you can receive alerts when the disk usage of the node reaches or exceeds 85%. For more information about how to configure alert rules, see Alert management.
Solution
Check the disk usage curve on the Node Monitoring tab of the console and identify the time point at which the disk usage spiked. Then, check whether the processes that run on the node have occupied an excessive amount of disk space. For more information, see the Check the monitoring data of nodes section of this topic.
If a large number of files have occupied the disk space, delete the files that you no longer need. For more information, see Resolve the issue of insufficient disk space on a Linux instance.
Limit the
temporary storagethat is allocated to the pods on the node. For more information, see the Modify the upper and lower limits of CPU and memory resources for a pod section of the "Manage pods" topic.We recommend that you use the storage services provided by Alibaba Cloud and do not use hostPath volumes. For more information, see Storage.
Resize the disk of the node.
Reduce the loads of the node. For more information, see the Insufficient node resources for scheduling section of this topic.
Insufficient IP addresses - InvalidVSwitchId.IpNotEnough
Cause
In most cases, the IP addresses provided by a node become insufficient because the containers on the node have occupied an excessive number of IP addresses.
Issues
Pods fail to be started. The status of these pods is ContainerCreating. You can find the InvalidVSwitchId.IpNotEnough information in the logs of the pods. For more information about how to check the logs of a pod, see the Pod troubleshooting section of the "Pod troubleshooting" topic.
time="2020-03-17T07:03:40Z" level=warning msg="Assign private ip address failed: Aliyun API Error: RequestId: 2095E971-E473-4BA0-853F-0C41CF52651D Status Code: 403 Code: InvalidVSwitchId.IpNotEnough Message: The specified VSwitch \"vsw-AAA\" has not enough IpAddress., retrying"If you enabled the alerting feature for cluster nodes, you can receive alerts when the node cannot provide sufficient IP addresses. For more information about how to configure alert rules, see Alert management.
Solution
Reduce the number of containers on the node. For more information, see the Insufficient node resources for scheduling section of this topic. For more information about other relevant operations, see What Can I Do if Insufficient IP Addresses are Provided by a vSwitch in a Cluster that Uses Terway? and What do I do if the IP address of a newly created pod does not fall within the vSwitch CIDR block after I add a vSwitch in Terway mode?
Network exceptions
Cause
In most cases, a network exception occurs because the status of the node is abnormal, the configurations of the security groups of the node are invalid, or the network is overloaded.
Issues
You failed to log on to the node.
The status of the node is Unknown.
If you enabled the alerting feature for cluster nodes, you can receive alerts when the outbound Internet bandwidth usage of the node reaches or exceeds 85%. For more information about how to configure alert rules, see Alert management.
Solution
If you failed to log on to the node, perform the following steps to troubleshoot the issue:
Check whether the node is in the Running state.
Check the configurations of the security groups of the node. For more information, see the Check the security groups of nodes section of this topic.
If the network of the node is overloaded, perform the following steps to troubleshoot the issue:
Check the network performance curve of the node on the Node Monitoring tab of the console and look for bandwidth usage spikes. For more information, see the Check the monitoring data of nodes section of this topic.
Use network policies to throttle pod traffic. For more information, see Use network policies in ACK clusters.
Unexpected node restarts
Cause
In most cases, a node unexpectedly restarts because the node is overloaded.
Issues
During the restart process of the node, the status of the node is NotReady.
If you enabled the alerting feature for cluster nodes, you can receive alerts when the node unexpectedly restarts. For more information about how to configure alert rules, see Alert management.
Solution
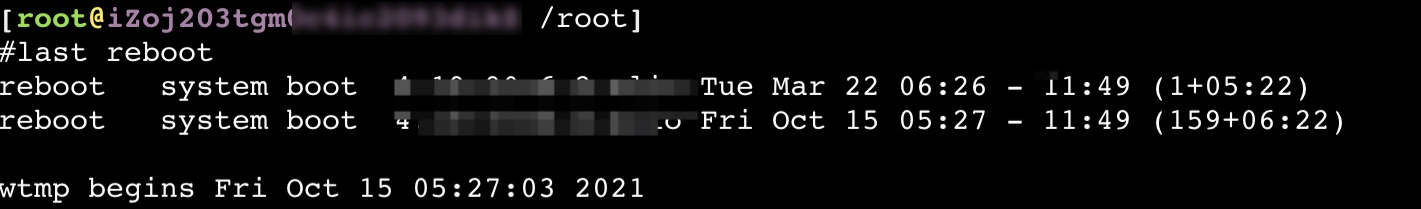
Run the following command to query the point in time at which the node restarted:
last rebootExpected output:
Check the monitoring data of the node and troubleshoot abnormal resource usage based on the point in time at which the node restarted. For more information, see the Check the monitoring data of nodes section of this topic.
Check the kernel logs of the node and troubleshoot exceptions based on the point in time at which the node restarted. For more information, see the Collect the diagnostics logs of nodes section of this topic.
How do I resolve the high disk I/O caused by auditd or the following error message appears in the system log: audit: backlog limit exceeded?
Cause
Some existing nodes in the cluster are configured with audit rules of auditd for Docker by default. If the nodes run Docker, the system generates audit logs for Docker based on the audit rules of auditd. A large number of audit logs may be generated when a large number of containers repetitively restart at the same time, a large amount of data is written into a container, or kernel bugs occur. In these cases, the disk I/O utilization of the auditd process may be high and the following error message may appear in the system log: audit: backlog limit exceeded.
Issues
This issue affects only nodes that run Docker. You may observe the following issues on the node:
After you run the iotop -o -d 1 command, the results indicate that the value of
DISK WRITEremains at 1MB/s or higher.After you run the dmesg -d command, the results include a log that contains the following keyword:
audit_printk_skb. Example:audit_printk_skb: 100 callbacks suppressed.After you run the dmesg -d command, the results contain the following keyword:
audit: backlog limit exceeded.
Solution
Perform the following operations to check whether the preceding issue is caused by the audit rules of auditd:
Log on to the node.
Run the following command to query auditd rules:
sudo auditctl -l | grep -- ' -k docker'If the following output is returned, the preceding issue is caused by the audit rules of auditd.
-w /var/lib/docker -k docker
To resolve this issue, use one of the following solutions:
Upgrade the cluster
Upgrade the Kubernetes version of the cluster. For more information, see Manually upgrade a cluster.
Change the container runtime to containerd
If the Kubernetes version of the cluster cannot be updated, you can change the container runtime to containerd to prevent this issue. Perform the following operations on the node pools that use Docker as the container runtime:
Create new node pools by cloning the node pools that run Docker. The new node pools use containerd as the container runtime. Make sure that the configurations of the new node pools are the same as the configurations of the cloned node pools except for the container runtime.
Drain nodes one by one from the node pools that run Docker during off-peak hours until all the application pods are evicted from the node pools.
Update the configurations of auditd
If the preceding solutions are not applicable, you can manually update the configurations of auditd on the node to resolve this issue. Perform the following operations on the nodes that use Docker as the container runtime:
Log on to the node.
Run the following command to delete the auditd rules for Docker:
sudo test -f /etc/audit/rules.d/audit.rules && sudo sed -i.bak '/ -k docker/d' /etc/audit/rules.d/audit.rules
sudo test -f /etc/audit/audit.rules && sudo sed -i.bak '/ -k docker/d' /etc/audit/audit.rules
Run the following command to apply new auditd rules:
if service auditd status |grep running || systemctl status auditd |grep running; then
    sudo service auditd restart || sudo systemctl restart auditd
    sudo service auditd status || sudo systemctl status auditd
fi