When you need to efficiently create multiple charts for visualization analysis, we recommend using dashboards. This topic describes how to view chart data, configure chart features, and arrange chart layouts.
Go to the Instances Page
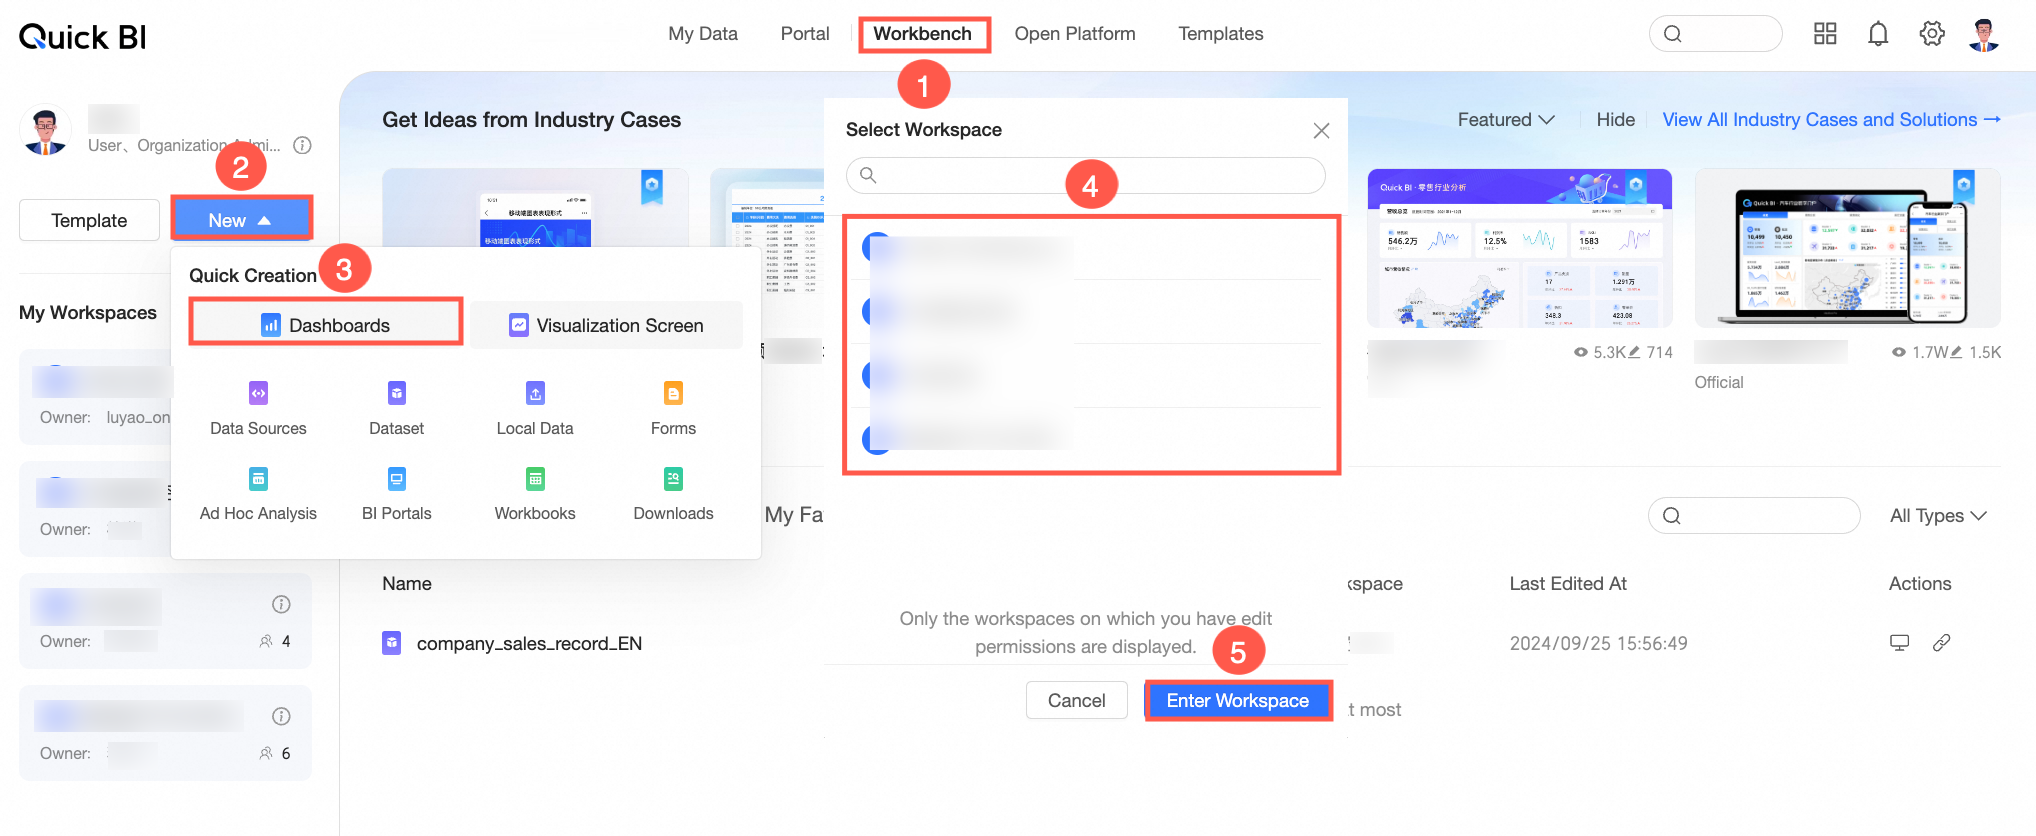
Log on to the Quick BI console and use one of the following methods to navigate to the dashboard creation page.
Method 1: Create an ad hoc query from Quick Start on the Workbench tab outside a workspace
Method 2: Create an ad hoc query in the left-side navigation pane of the Workbench tab within a workspace
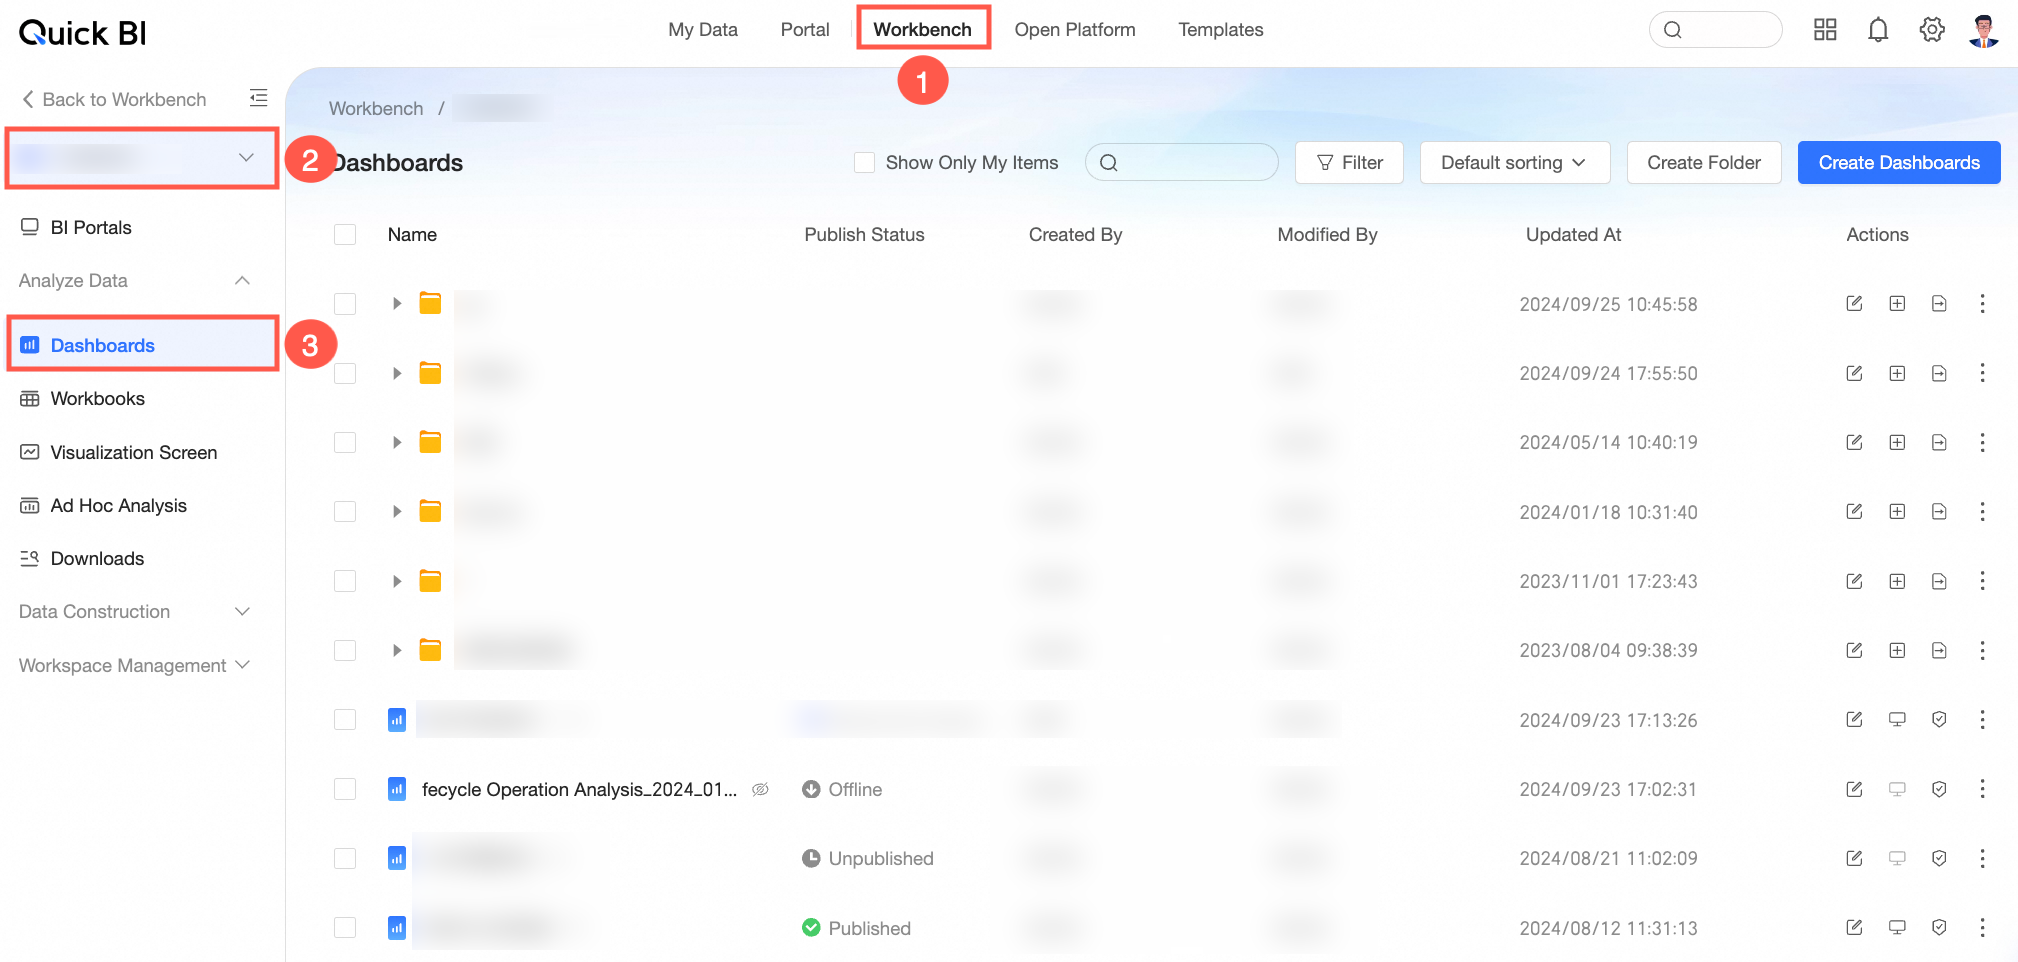
Method 3: Create a dashboard from the Dashboard module in a workspace
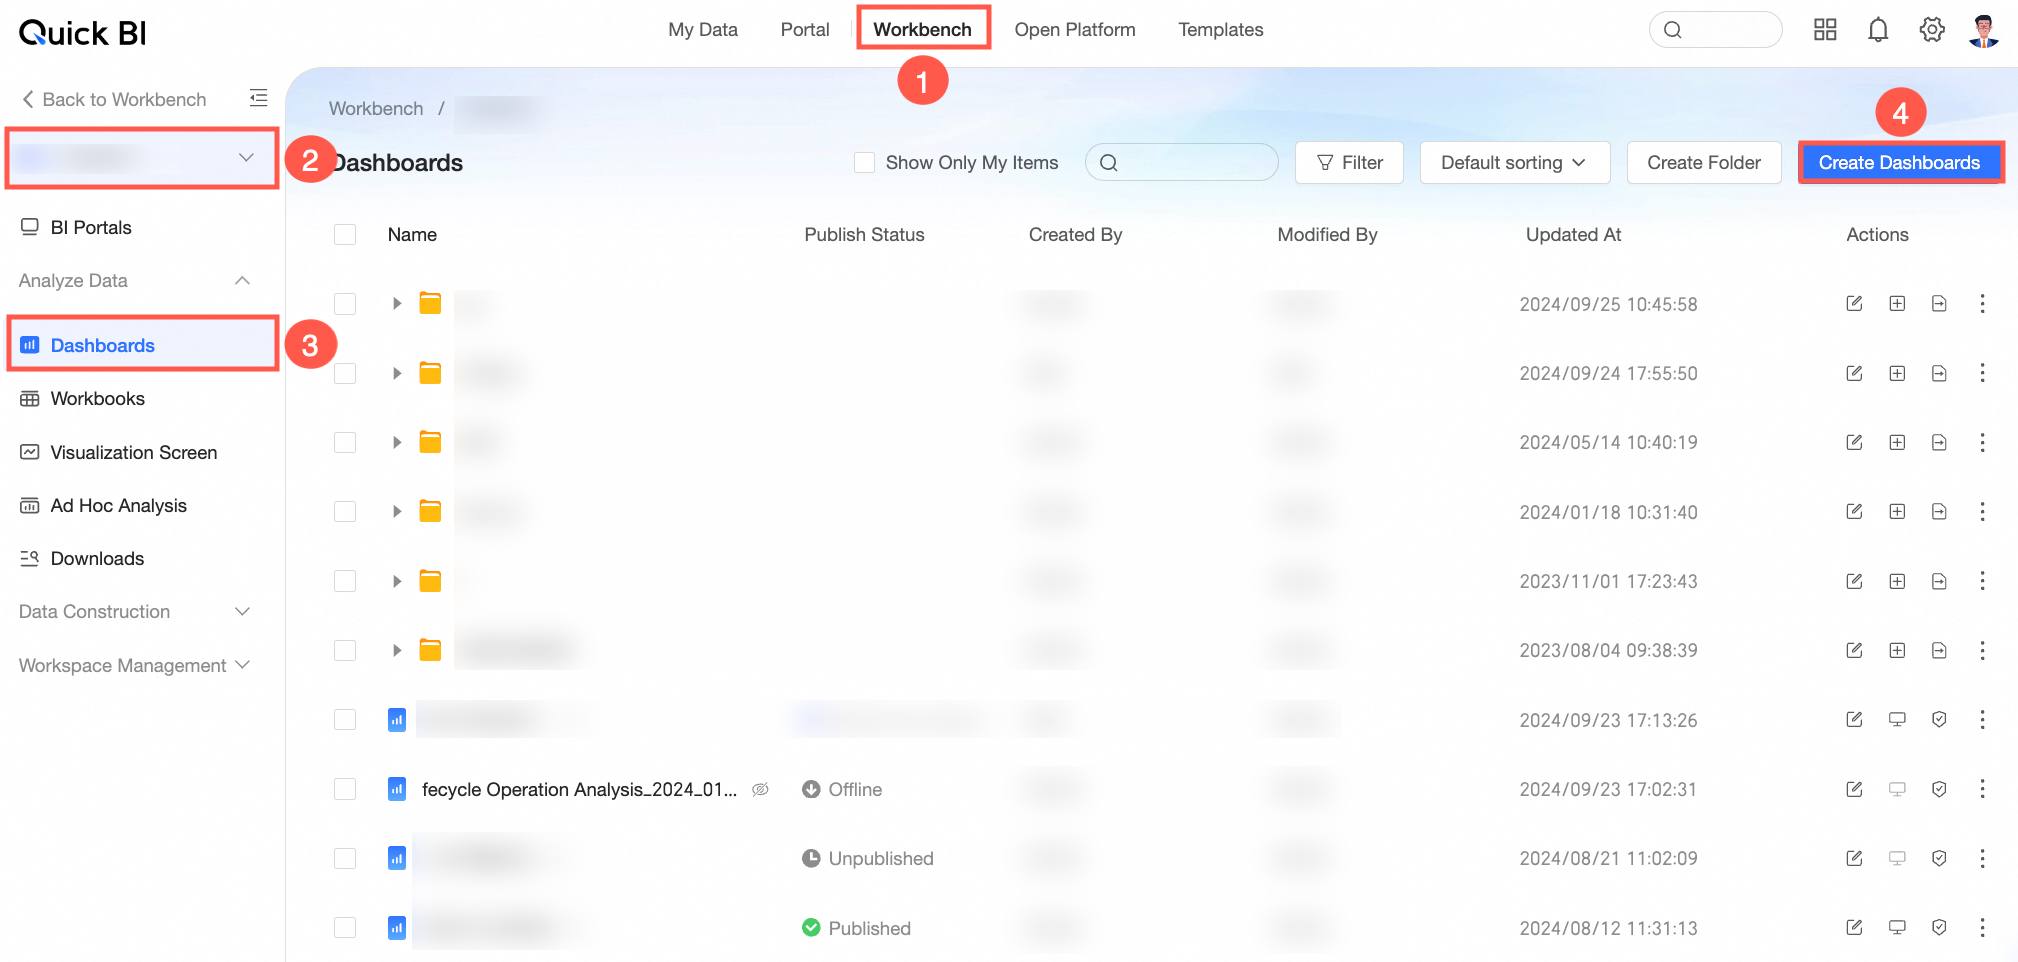
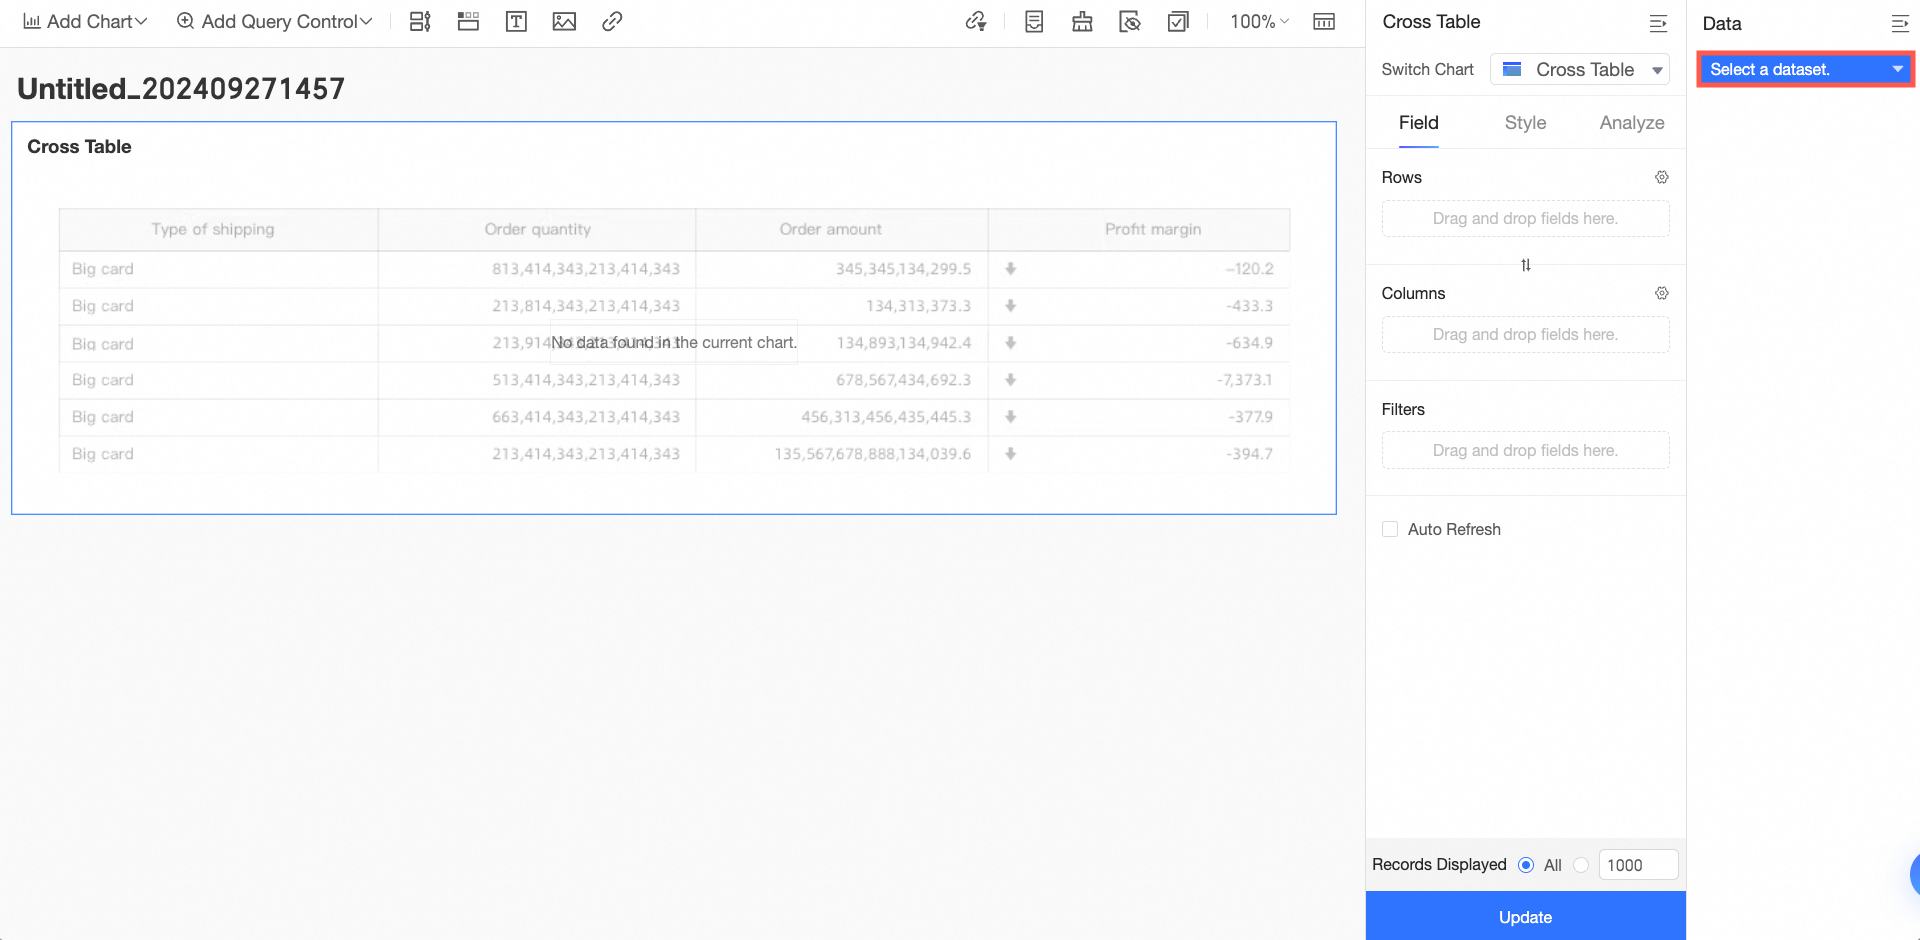
When you create a dashboard using one of the preceding three methods, no dataset is selected by default. You need to select Add Chart and Configure Dataset on the edit page.
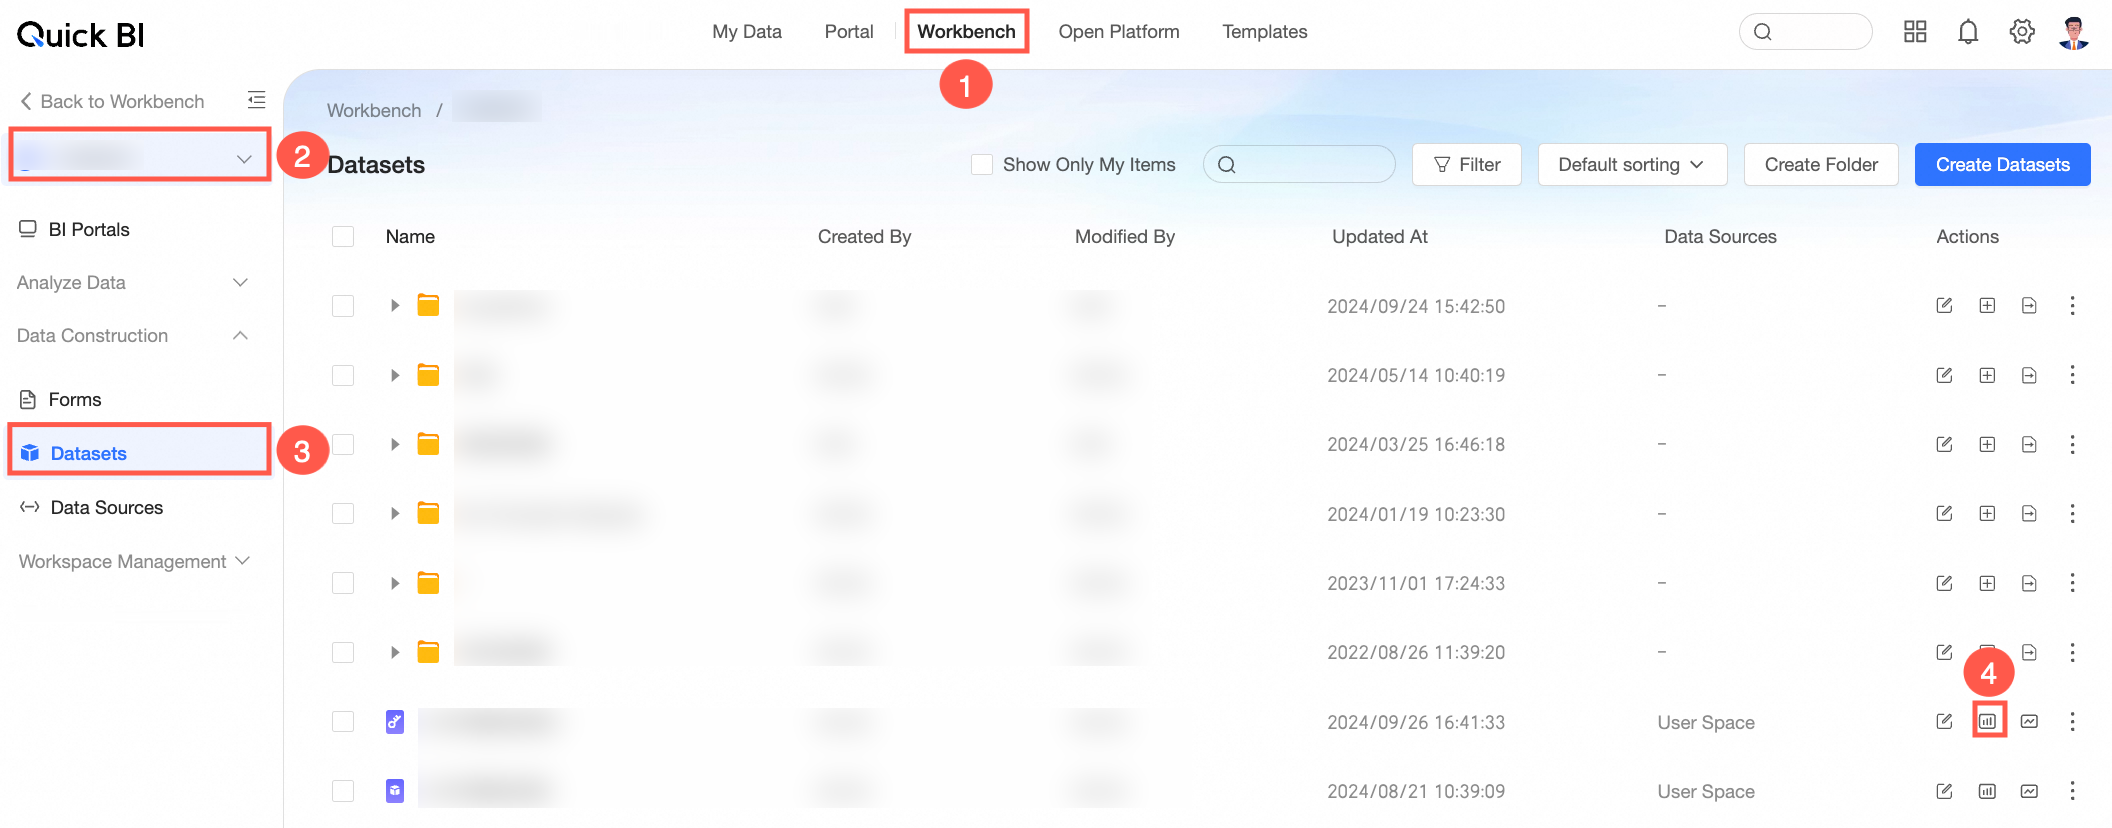
Method 4: Create an ad hoc query on the Datasets page
Method 5: Create a dashboard from the dataset edit page
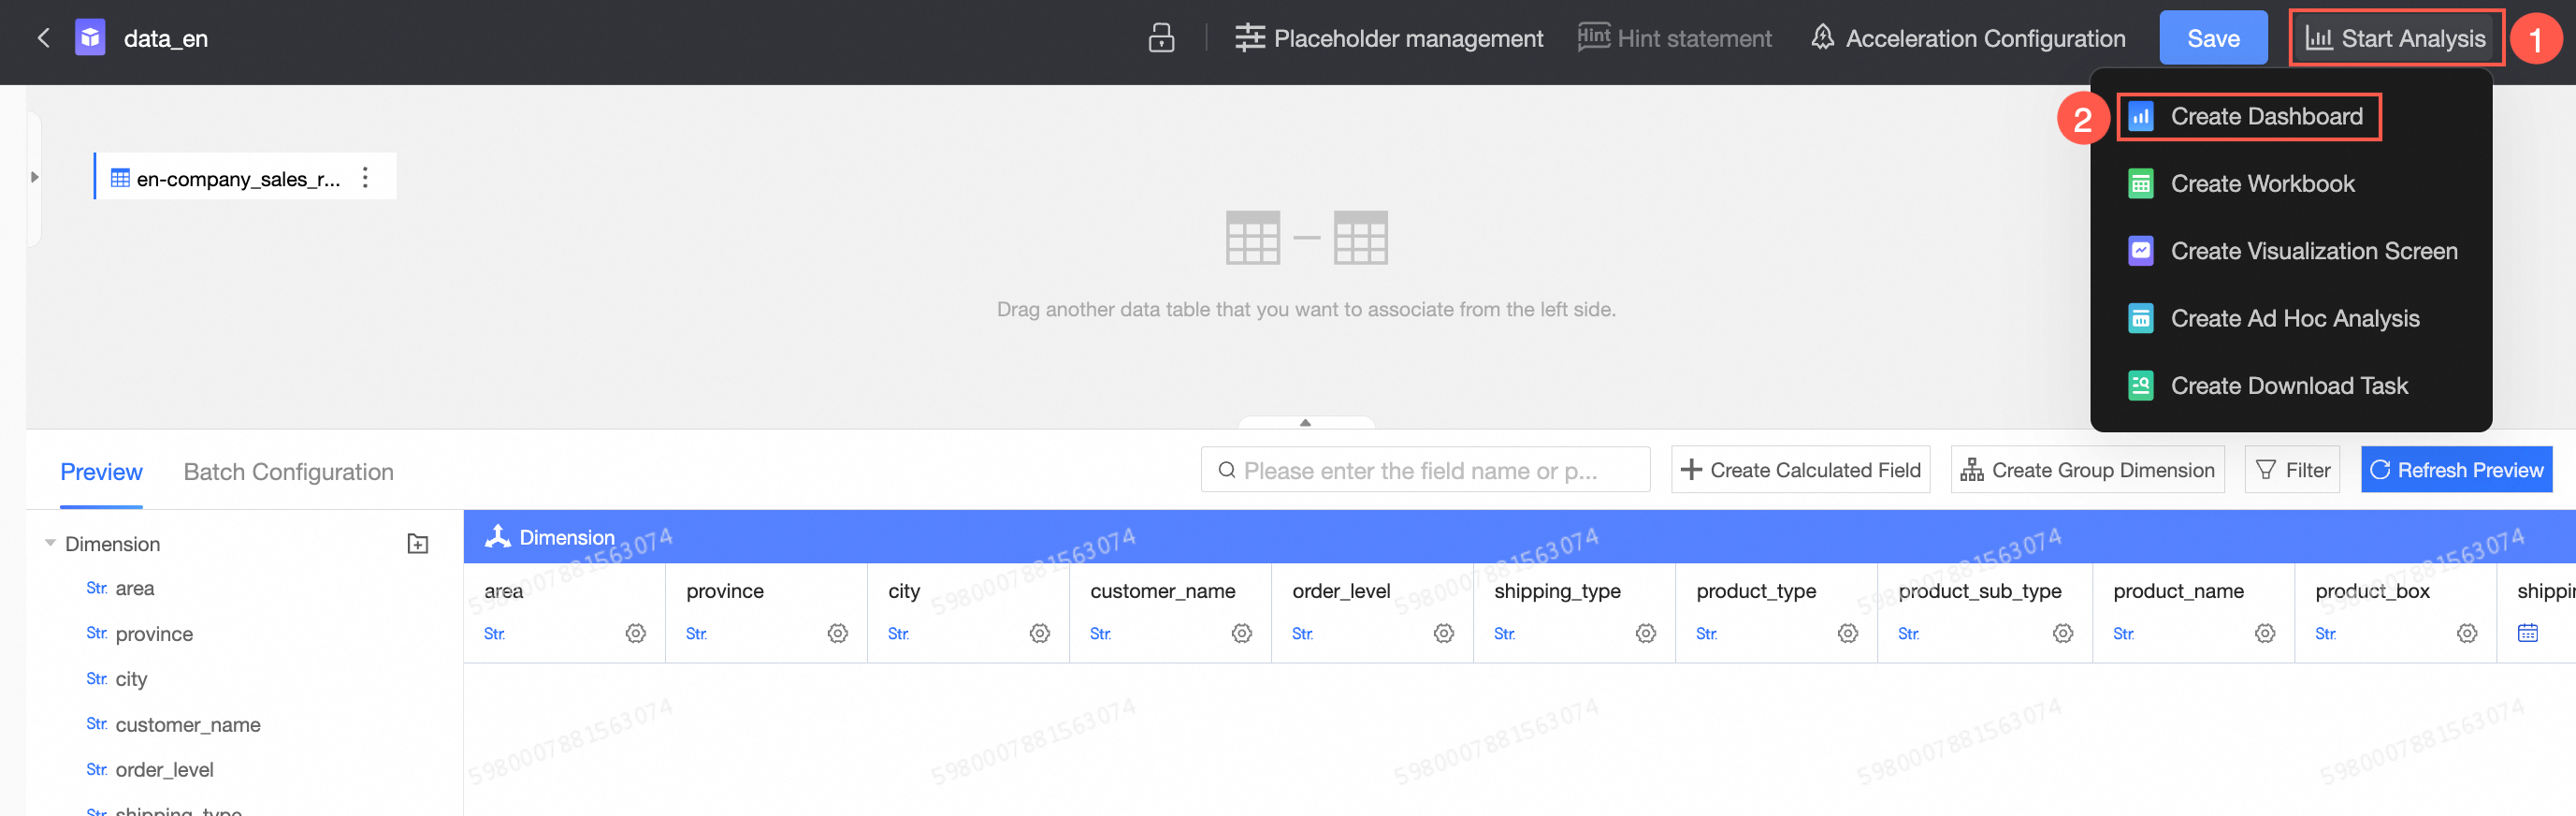
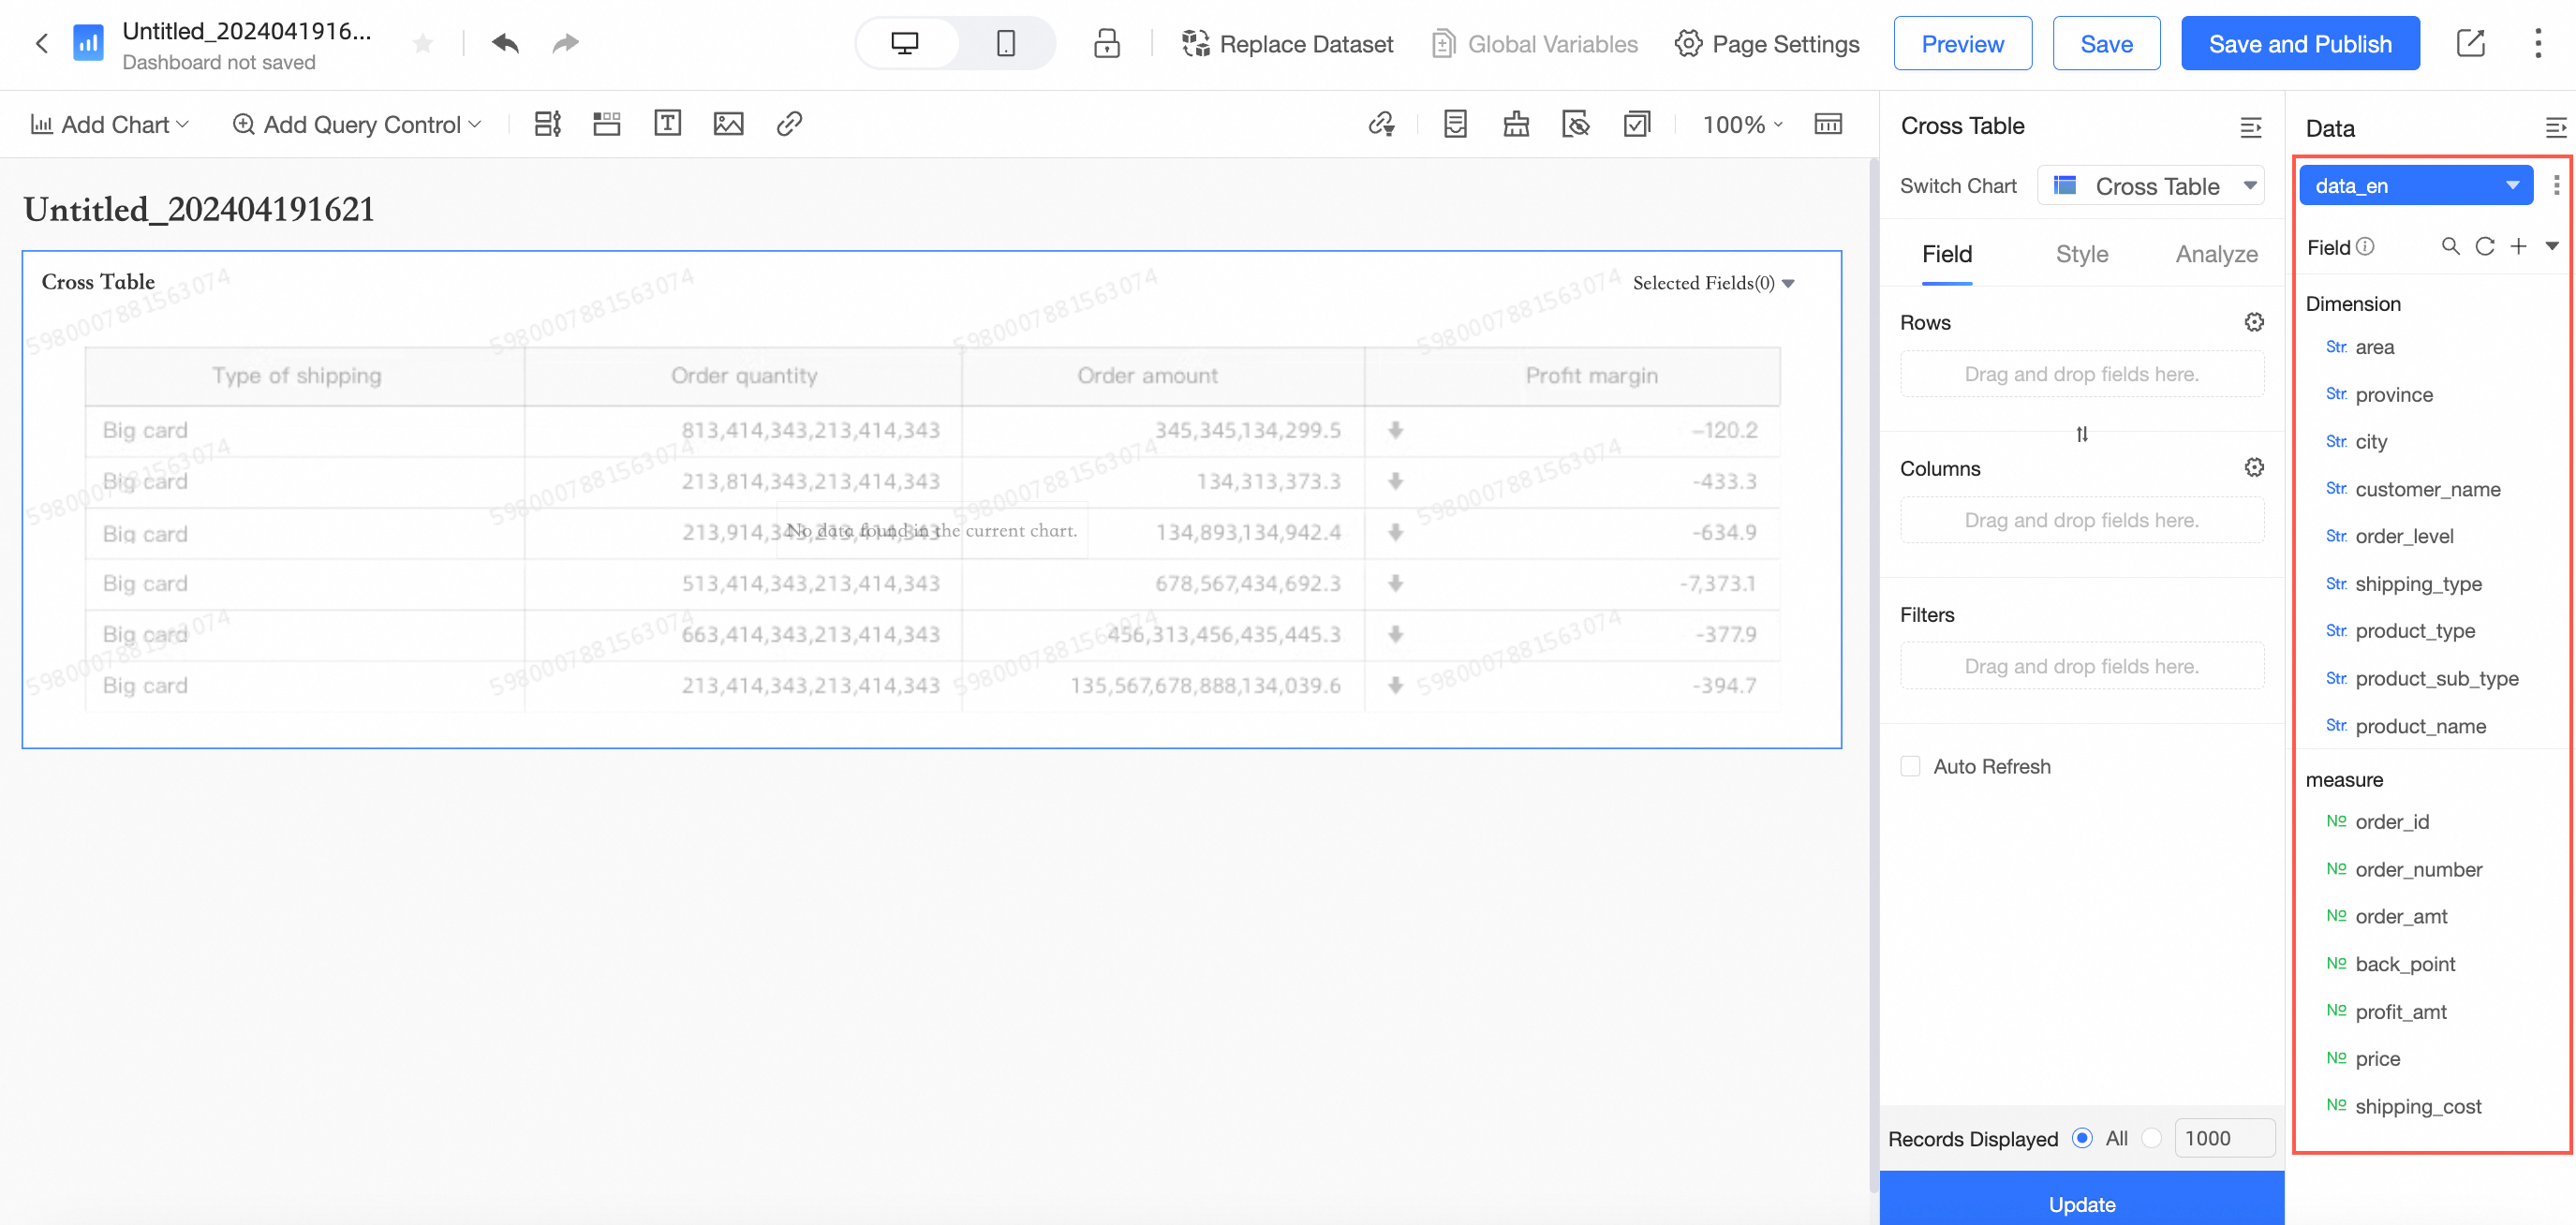
When you create a dashboard from an existing dataset using Method 4 or Method 5, the dimensions and measures of the dataset are directly loaded in the data panel on the right. After you add a chart, you only need to drag the dimensions and measures to the field area.
Common Operations in the Display Area
You can perform the following operations in the display area of a dashboard:
Category | Description |
View chart data | View chart data on a dashboard. |
Modify the title of a chart | Modify the title of a chart in an efficient manner. |
Manage charts | Copy, move, and delete a chart. |
Export a dashboard | Export PNG images or export data of a chart as a PDF file or an Excel file and store the exported file to your on-premises machine or the OSS server. For more information, see Export a Dashboard. |
Adjust the dashboard layout | Adjust the position of charts in the dashboard. |
Panel search | When you create a dashboard, you can use the panel search feature to quickly find configuration items. |
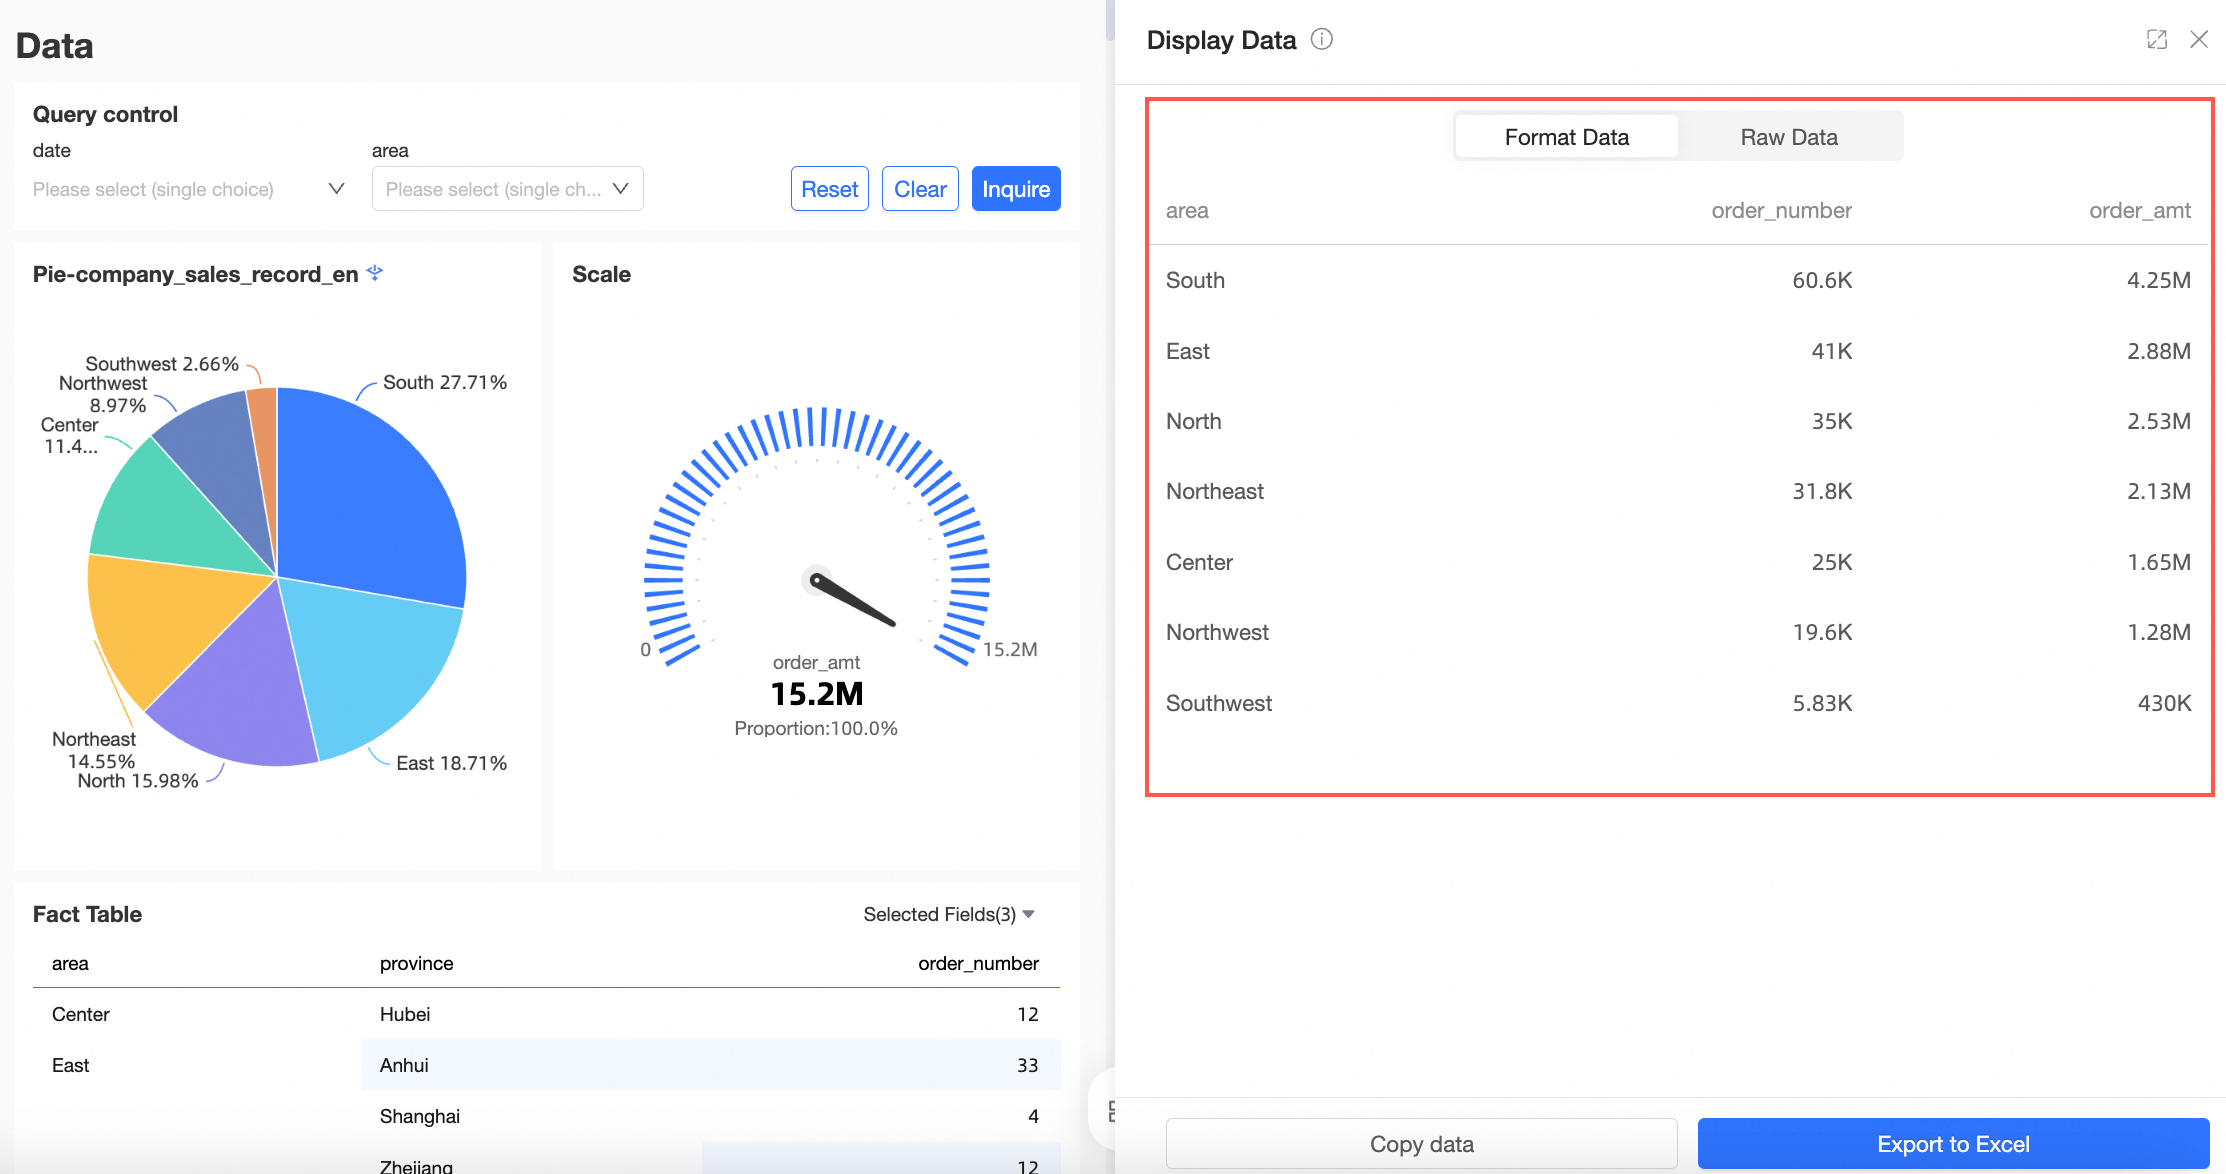
View Chart Data
This section describes how to efficiently view data on a chart.
On the dashboard edit page, select a chart.
Click the legend on the chart to view the data of a specific value.
For more information about how to configure chart effects, see Interactive analysis.
Modify the Title of a Chart
This section describes how to efficiently modify the title of a chart.
On the dashboard edit page, select a chart.
Move the pointer over the title of the chart and double-click to modify the title.

Manage Charts
Move the pointer over the upper-right corner of a chart and click the  icon to perform the following operations.

Category | Description |
Move To | Move the chart to a tab. |
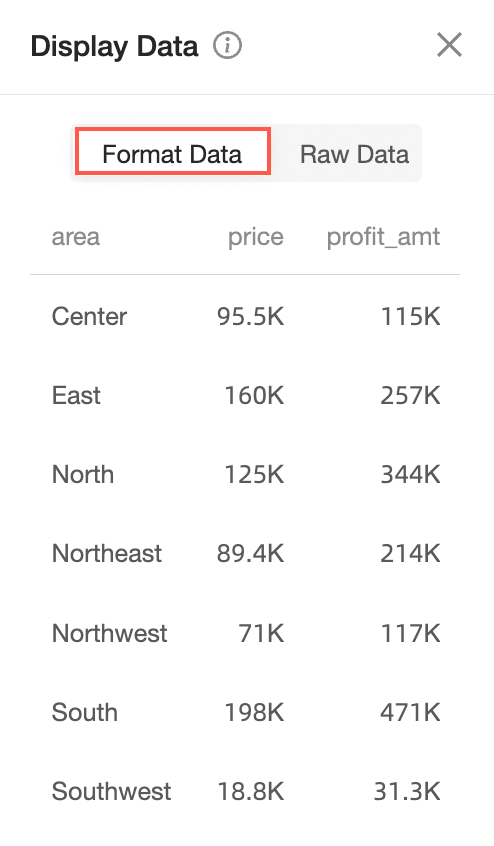
View Data | View the data of the chart.
Note Cross tables and detail tables do not support this feature. You can view data in the Formatted Data or Raw Data format.
|
Copy | Copy the chart. |
Paste | Paste the copied chart to the current dashboard. |
Annotate | Use icons, background colors, and dimension value highlighting to annotate specific parts of a chart. For more information, see Annotations. |
View SQL | View the SQL statement of the chart. |
Insert Filter | Add a filter for the chart. For more information, see Create a filter in a chart. |
Create Monitoring | Monitor alert information of the chart. For more information, see Configure Monitoring. |
Export | Export PNG images or export data of a chart as a PDF file or an Excel file and store the exported file to your on-premises machine or the Object Storage Service (OSS) server. For more information, see Export a Dashboard. |
Block Embedding | After embedding, you can view only the embedded chart. |
Performance Diagnosis | Diagnose the query performance of the current chart and provide diagnostic details and optimization suggestions. |
Refresh Data | Refresh the data of the current chart. |
Full Screen | Show the chart in full-screen mode. In full-screen mode, you can click the Exit Full Screen button to exit full-screen mode. |
Delete | Delete the chart. |
Downloads | Create a Download for the current chart. Note Only cross tables, new cross tables, and detail tables support this feature. For more information, see Create and Manage Download Tasks. |


Adjust the Dashboard Layout
Move the pointer over one of the four corners of the chart. When the pointer turns into a double-headed arrow, drag to resize the chart.
Move the pointer over the chart. When the pointer changes to a hand shape, drag to move the chart.
When a dashboard contains a large amount of content, you can use the layout scaling feature to view the entire dashboard. This helps you quickly locate and adjust the chart layout, which improves the efficiency of creating dashboards.
Pitch is used to set the spacing between cards. Three options are available: Compact, Loose, and Custom. If you select Compact or Loose, the system automatically adjusts the spacing between cards. If you select Custom, you can manually adjust the Card Spacing and Card Padding.
Card Spacing is used to set the spacing between cards. You can manually enter the row spacing and column spacing.
Card Padding is used to set the top, bottom, left, and right padding within each card. You can manually adjust the padding.
When the layout of a dashboard is too loose and the information density is low because the inner and outer margins of components are too large, you can adjust the dashboard spacing and card padding to quickly set appropriate overall margins and efficiently create the dashboard.
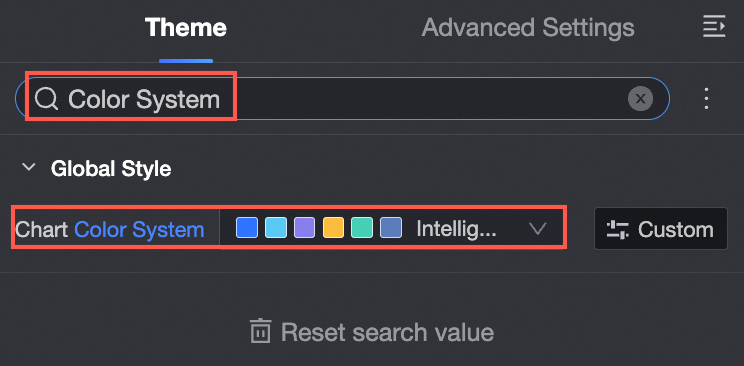
Panel Search
On the dashboard edit page, when you configure Page Theme, Chart Style, and Advanced Analysis, you can use the Panel Search feature to quickly find and locate the configuration items that you want to set. This improves the efficiency of creating reports.
Dashboard Preview Features
The dashboard preview mode supports the following features:

Configuration item | Description |
① View Data | You can view formatted data and raw data, and copy data and export data to Excel.
|
② Metric Monitoring | You can view metric monitoring. For more information, see Overview. |
③ Create Monitoring | You can create monitoring. For more information, see Overview of monitoring metrics. |
④ Export | You can export chart data. For more information, see Export a single chart in this topic. |
⑤ Refresh Data | You can refresh chart data. |
⑥ Full Screen | You can display charts in full-screen mode. |
⑦ Add to pinboard | You can add the chart to a card dashboard. For more information, see Add a card. |
⑧ Comments | You can add comments. For more information, see Manage Dashboards. |
⑨ Share | You can share cards. For more information, see ⑤ Share a card. |