In the era of artificial intelligence (AI), data quality and analytical efficiency are becoming key differentiators in enterprise competition. However, in frontline enterprise practice, the dilemma that “data does not understand the business, and the business does not understand data” still widely exists. Business users still struggle with complex data modeling and SQL writing. Technical teams are still manually moving tables across office tools. Decision-makers repeatedly review reports on their phones, yet still find it difficult to capture the key information.
To address this, Lingyang Quick BI officially releases version 6.1. Centered on strengthening foundational capabilities and improving the customer experience, this release introduces the Intelligent Relational Model, enriches data sources, upgrades the Quick Engine, and enhances visual analytics. It brings intelligent experiences into every stage of analytics, moving data analytics into a new phase of zero-threshold, high-efficiency, and truly intelligent use, fully unlocking the value of data and turning it into a growth engine for enterprises.
With the dual capabilities of Intelligent relational model and Data intelligent configuration toolbar, Quick BI fully empowers business personnel to perform zero-threshold data modeling and data processing.
Common scenarios:
Feature overview:
A new logical layer has been added to data modeling. On top of traditional physical modeling, it introduces the Relational Model capability:
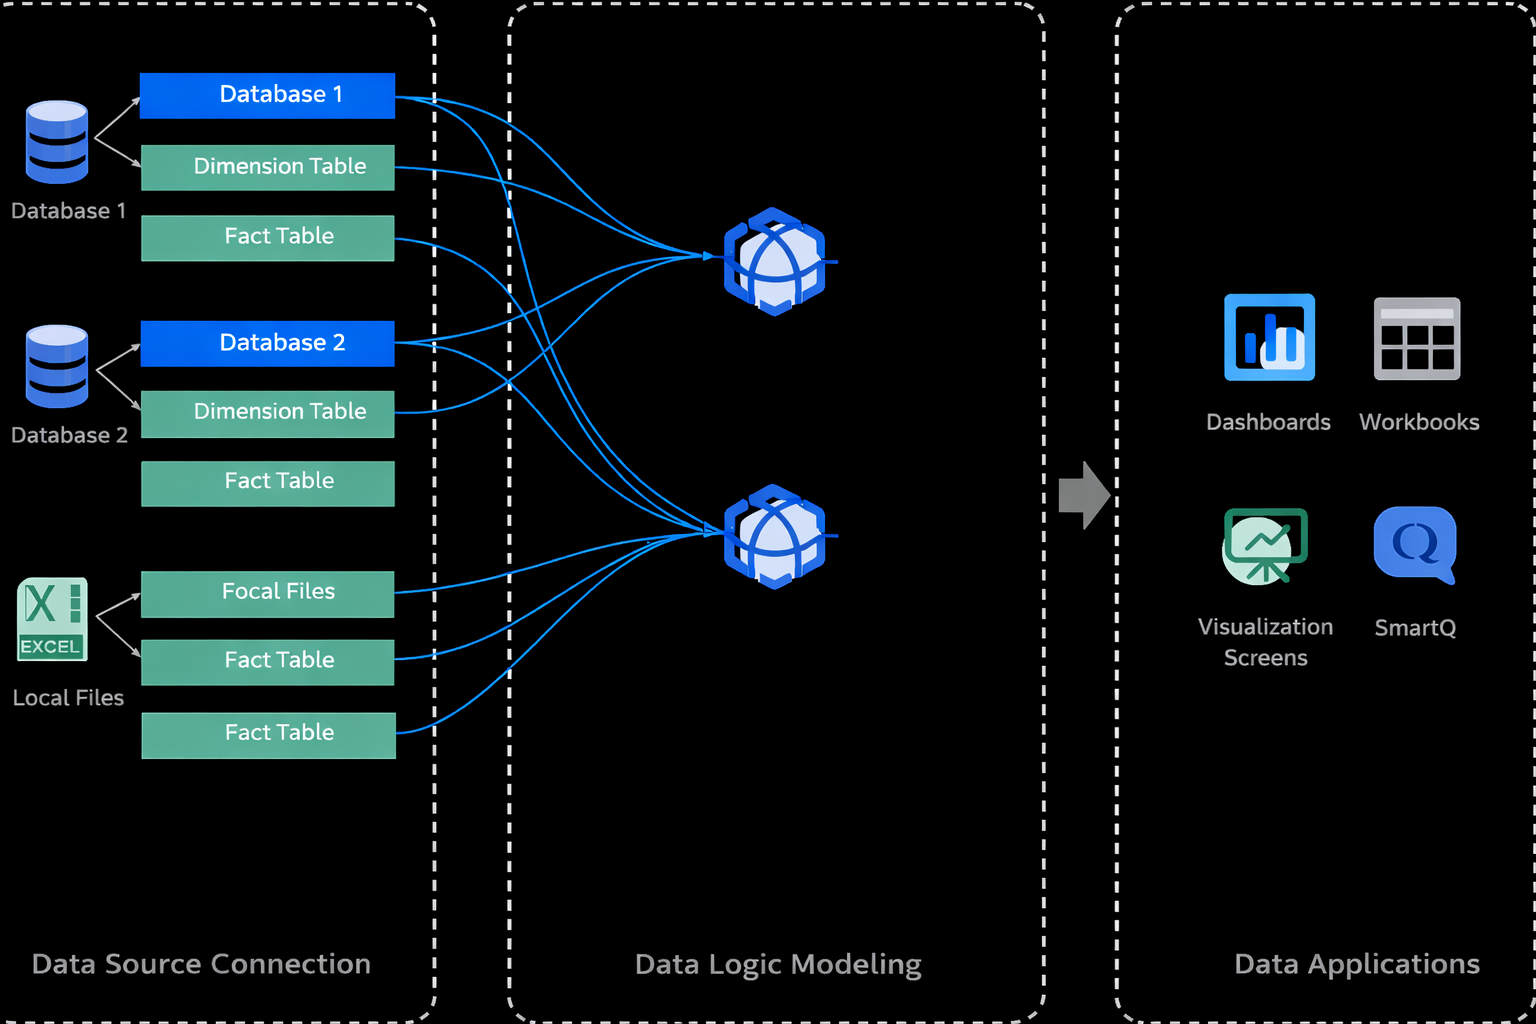
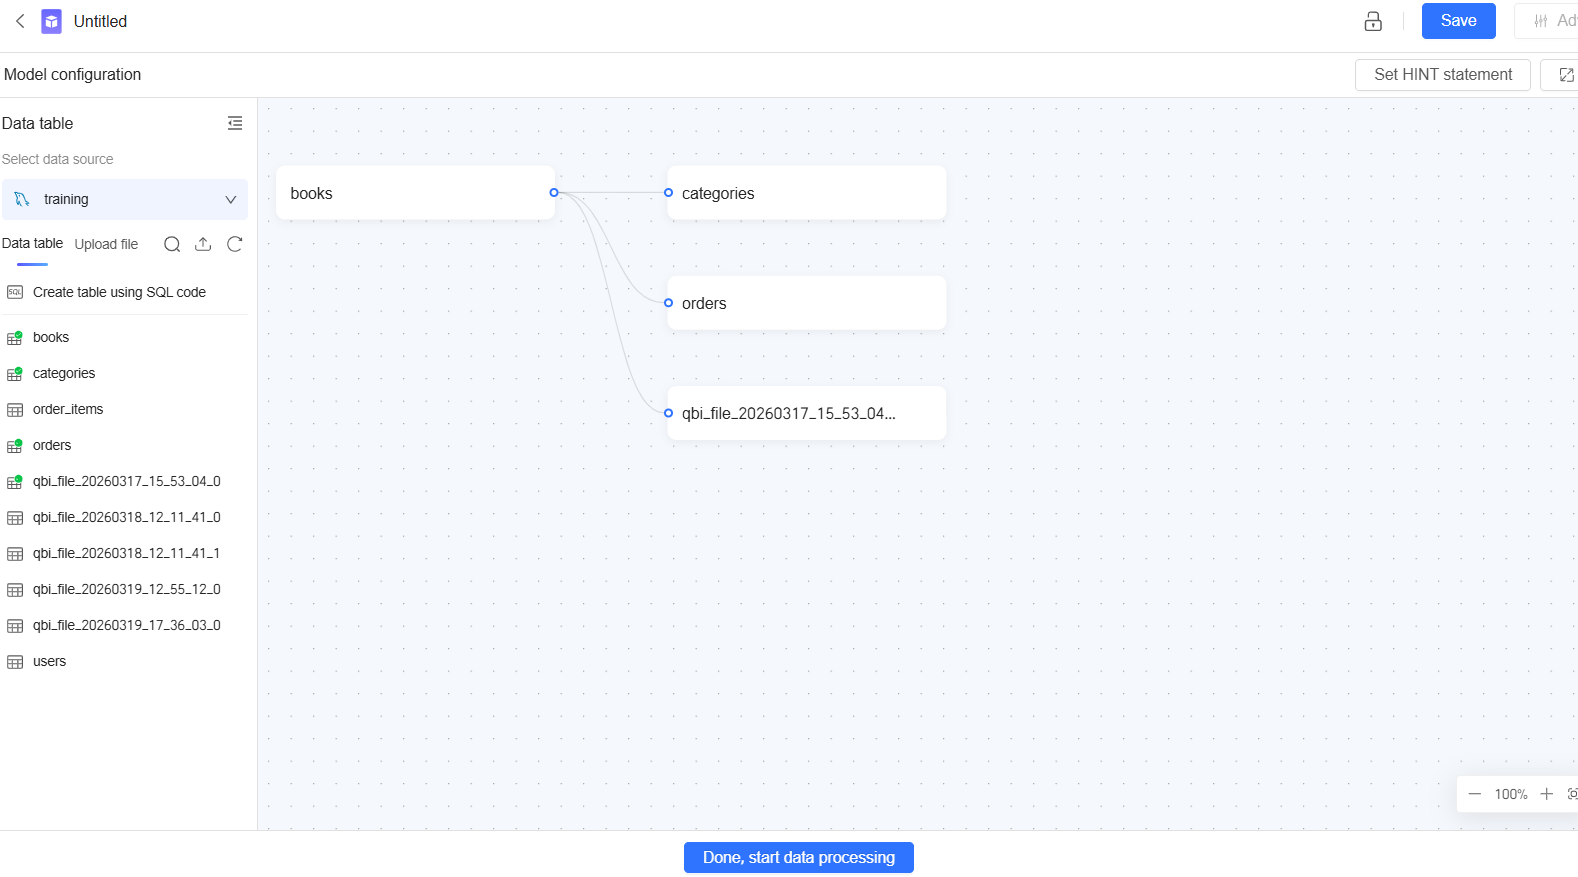
Common scenarios:
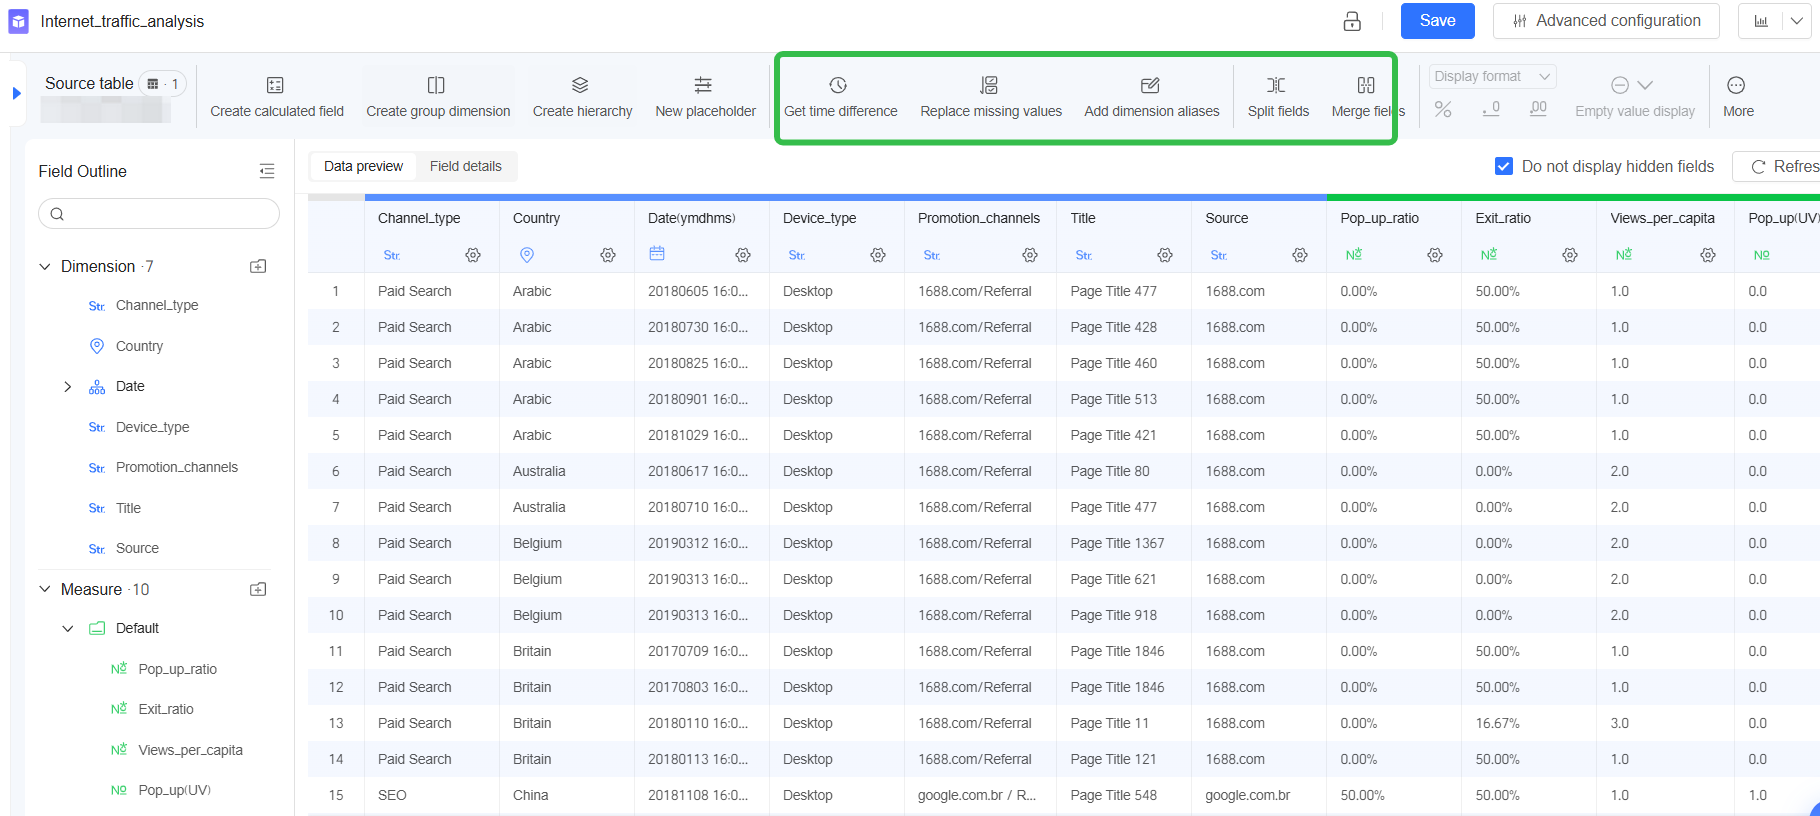
Business users generally lack SQL and function knowledge. When they use calculated fields for data cleansing and processing, the process is inefficient and prone to errors, which causes bottlenecks in data cleansing and analysis workflows.
Feature overview:
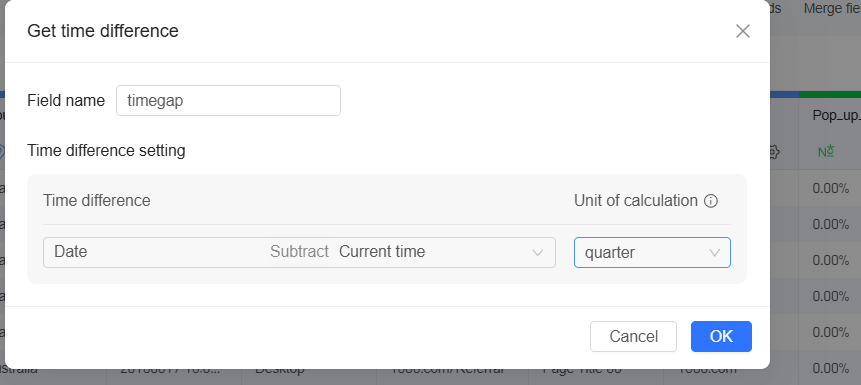
A shortcut panel toolbar is provided for common data processing, offering business users a zero-threshold operation panel, including:
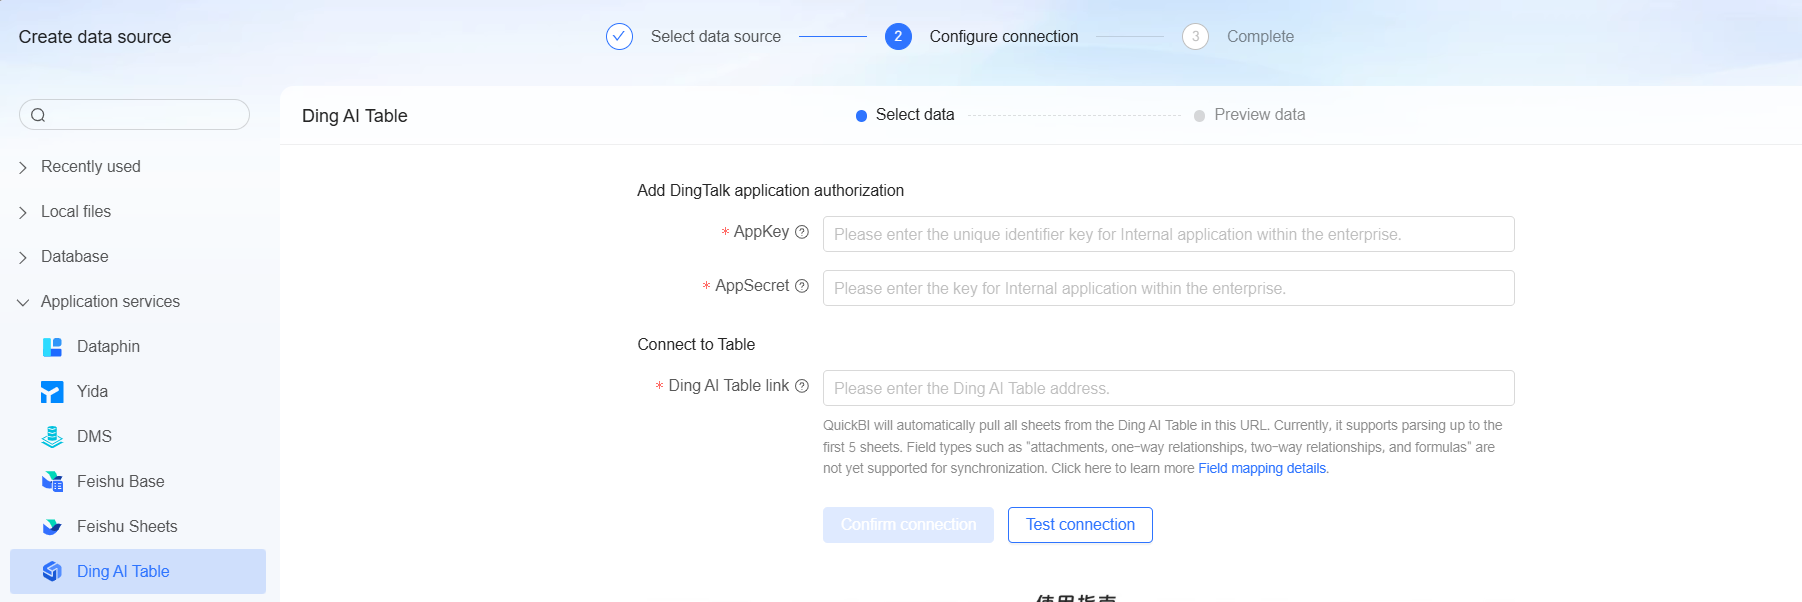
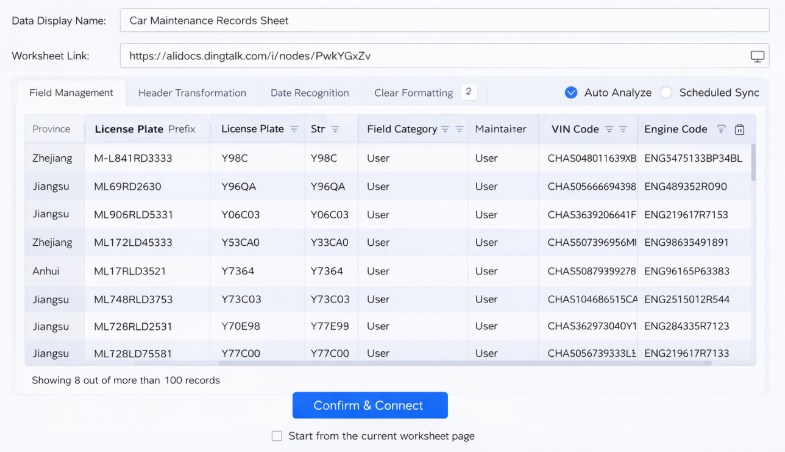
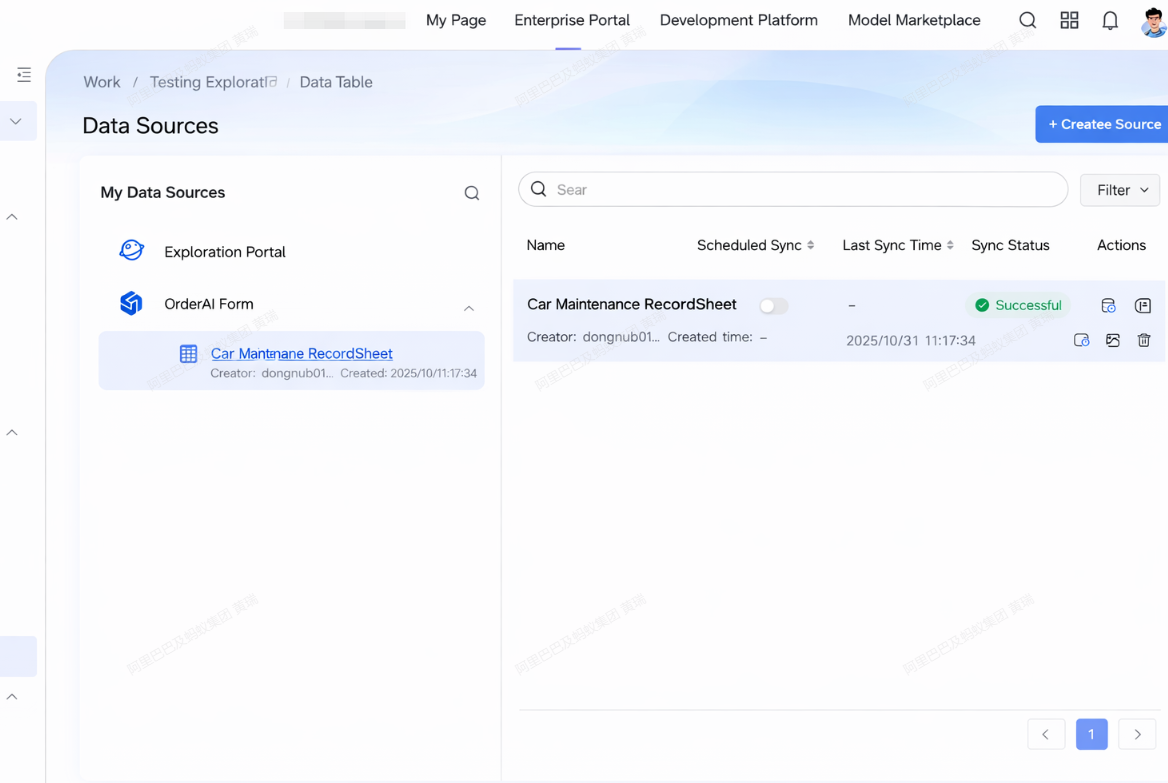
Quick BI now supports zero-code integration with DingTalk AI Tables and automatic synchronization, while also upgrading the dynamic time placeholder capability of the Quick Engine. This enables high-efficiency, low-cost, real-time analysis across all scenarios, from collaborative online data to massive volumes of historical data.
Common scenarios:
In industries such as the internet sector and retail, teams often use DingTalk or Lark tables for multi-person collaboration, and business data is accumulated in online documents in real time. However, the existing workflow requires users to first export the data from online documents and then manually upload it to Quick BI. This maintenance process consumes dedicated personnel time and is prone to errors due to inconsistent data versions.
Feature overview:
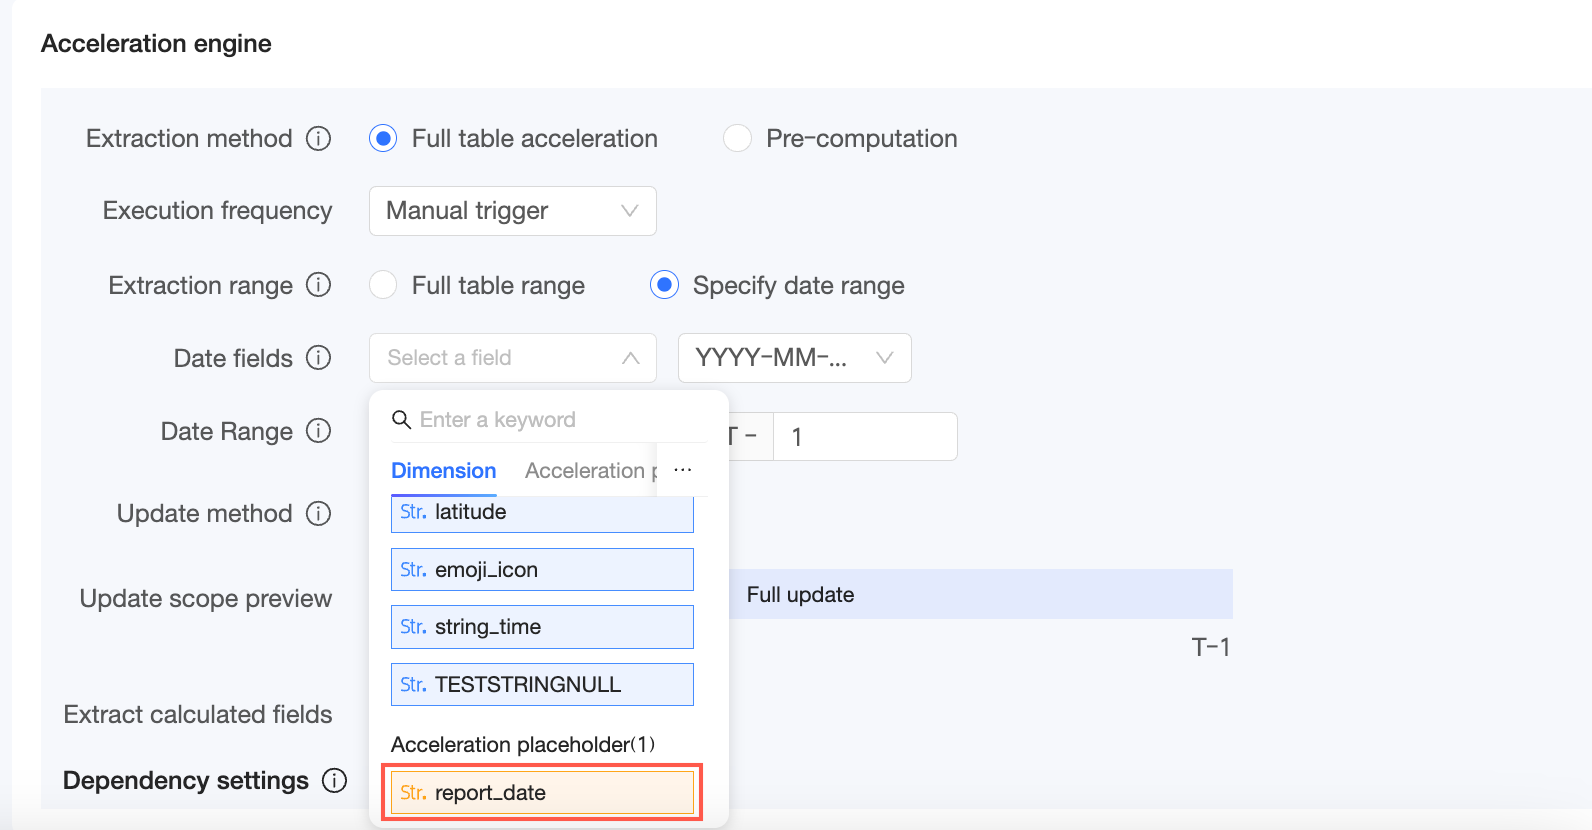
Common scenarios:
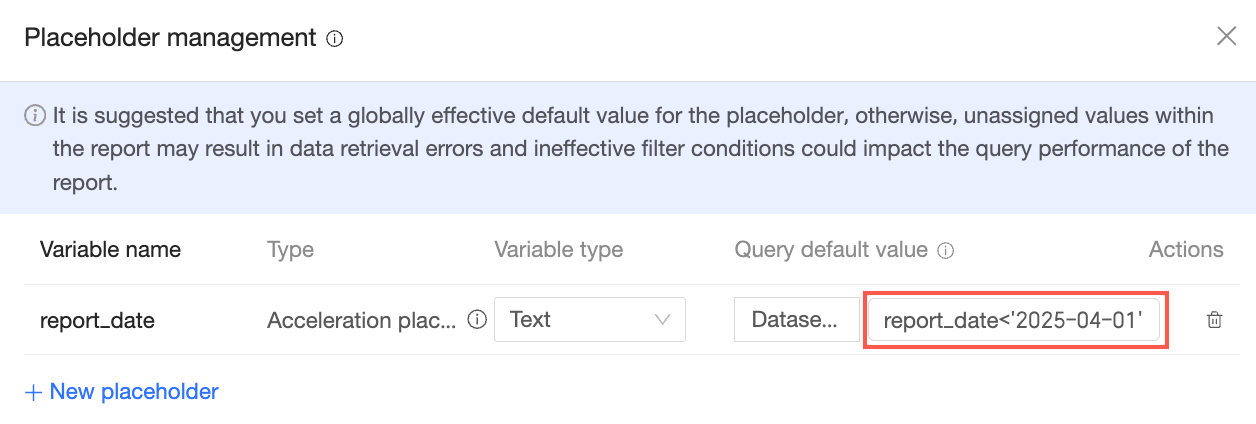
In scenarios where complex analysis reports customized by finance, operations, and other departments rely on underlying tables containing tens of millions or even hundreds of millions of historical records, the custom SQL of the dataset is prone to timing out during online execution, and extraction acceleration cannot be enabled directly.
Feature overview:
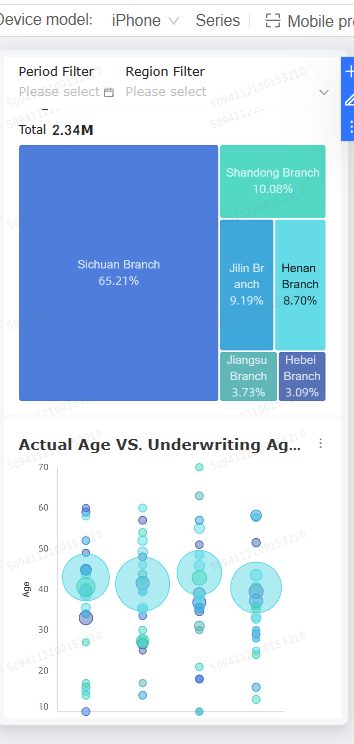
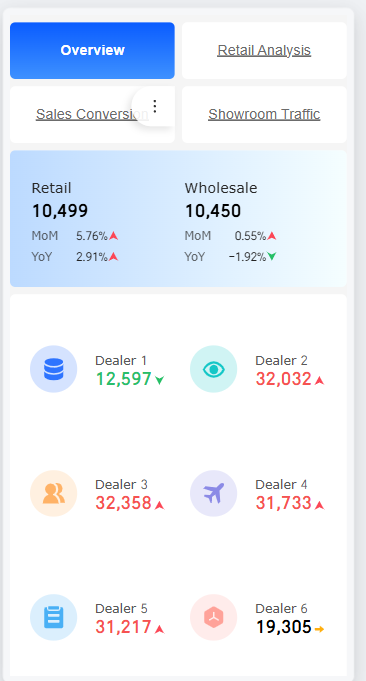
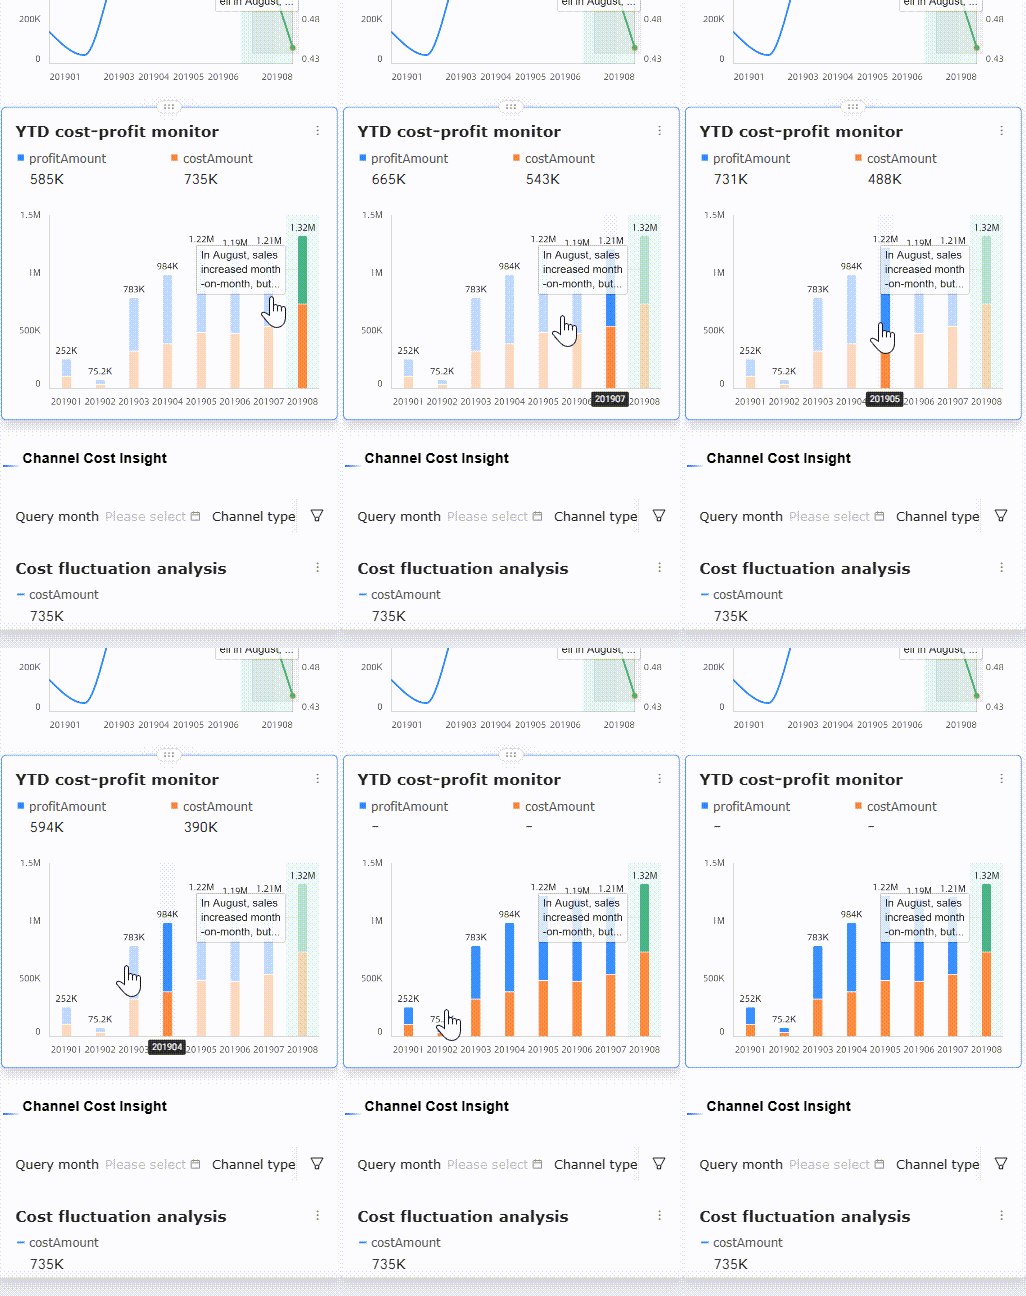
The full-scenario visual analytics upgrade of Quick BI makes analysis on mobile devices more accessible, interval comparison more customizable, and isomorphic dataset replacement smoother. It also supports the free combination of multiple charts and precise delivery through long images. From frontline store employees to company executives, it creates a more personalized and flexible data experience in fragmented moments and within limited screen space.
Common scenarios:
The demand for data reading and analysis on mobile devices is growing. With legends and lightweight tooltips that better fit mobile reading habits, key data becomes clear at a glance. The system also supports one-click analysis actions while viewing data, improving analysis efficiency and user experience on mobile devices.
Feature overview:
Animated graph
Common scenarios:
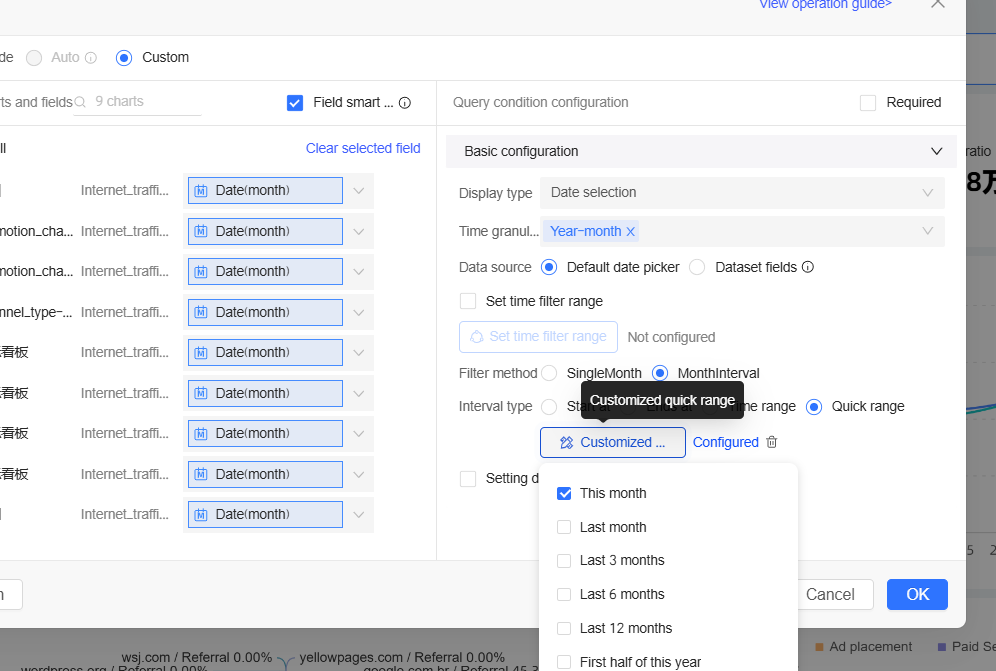
In high-frequency data monitoring scenarios such as e-commerce, finance, and logistics, business users often need to compare data across different periods. The date shortcut intervals provided by the original system sometimes cannot adapt to industry-specific cycles and dynamic rules. As a result, business users are forced to manually select date ranges, which is time-consuming and error-prone.
Feature overview:

Common scenarios:
Business analysis often requires quickly identifying the gap between actual performance and KPI targets or budget values. Existing conditional formatting only supports field comparison within charts, preventing users from directly referencing other key metrics in the dataset—such as target values or time boundary ranges—for comparison. This affects analysis efficiency and information communication. In addition, important data in tables lacks sufficiently prominent styling, making key information easy to miss.
Feature overview:
Common scenarios:
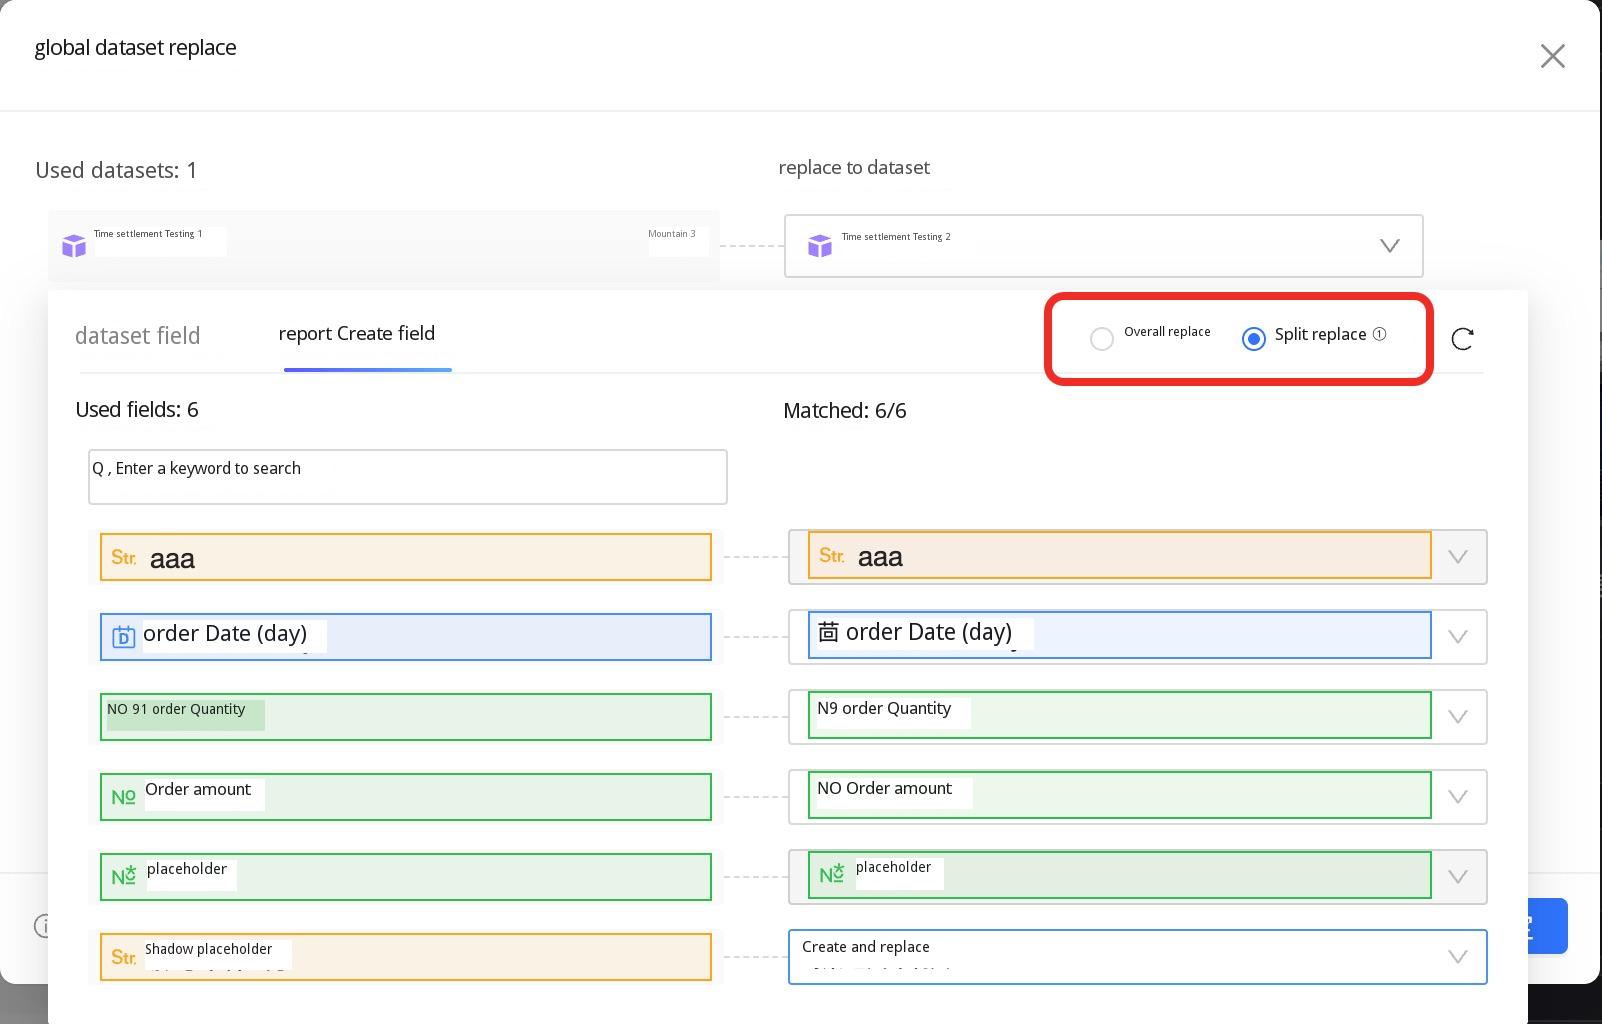
When an enterprise replaces isomorphic datasets, calculated fields may be missing in the target dataset. As a result, all fields must be manually rebuilt before replacement, leading to low efficiency and a higher risk of errors.
Feature overview:
Common scenarios:
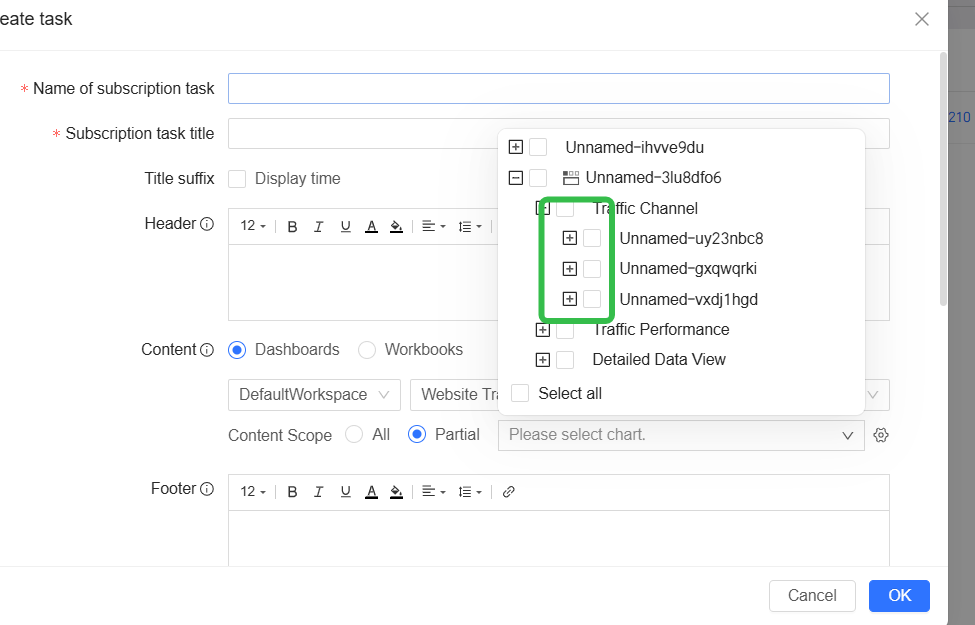
Subscribing to an entire dashboard can easily lead to information overload, making it difficult for users to quickly locate core metrics in complex reports. In specific scenarios, different roles—such as decision-makers and frontline business users—usually only need to focus on a few key data points, such as core KPIs and segmented business progress.
Feature overview
One-click parsing errors, quickly locate problems
Common scenarios:
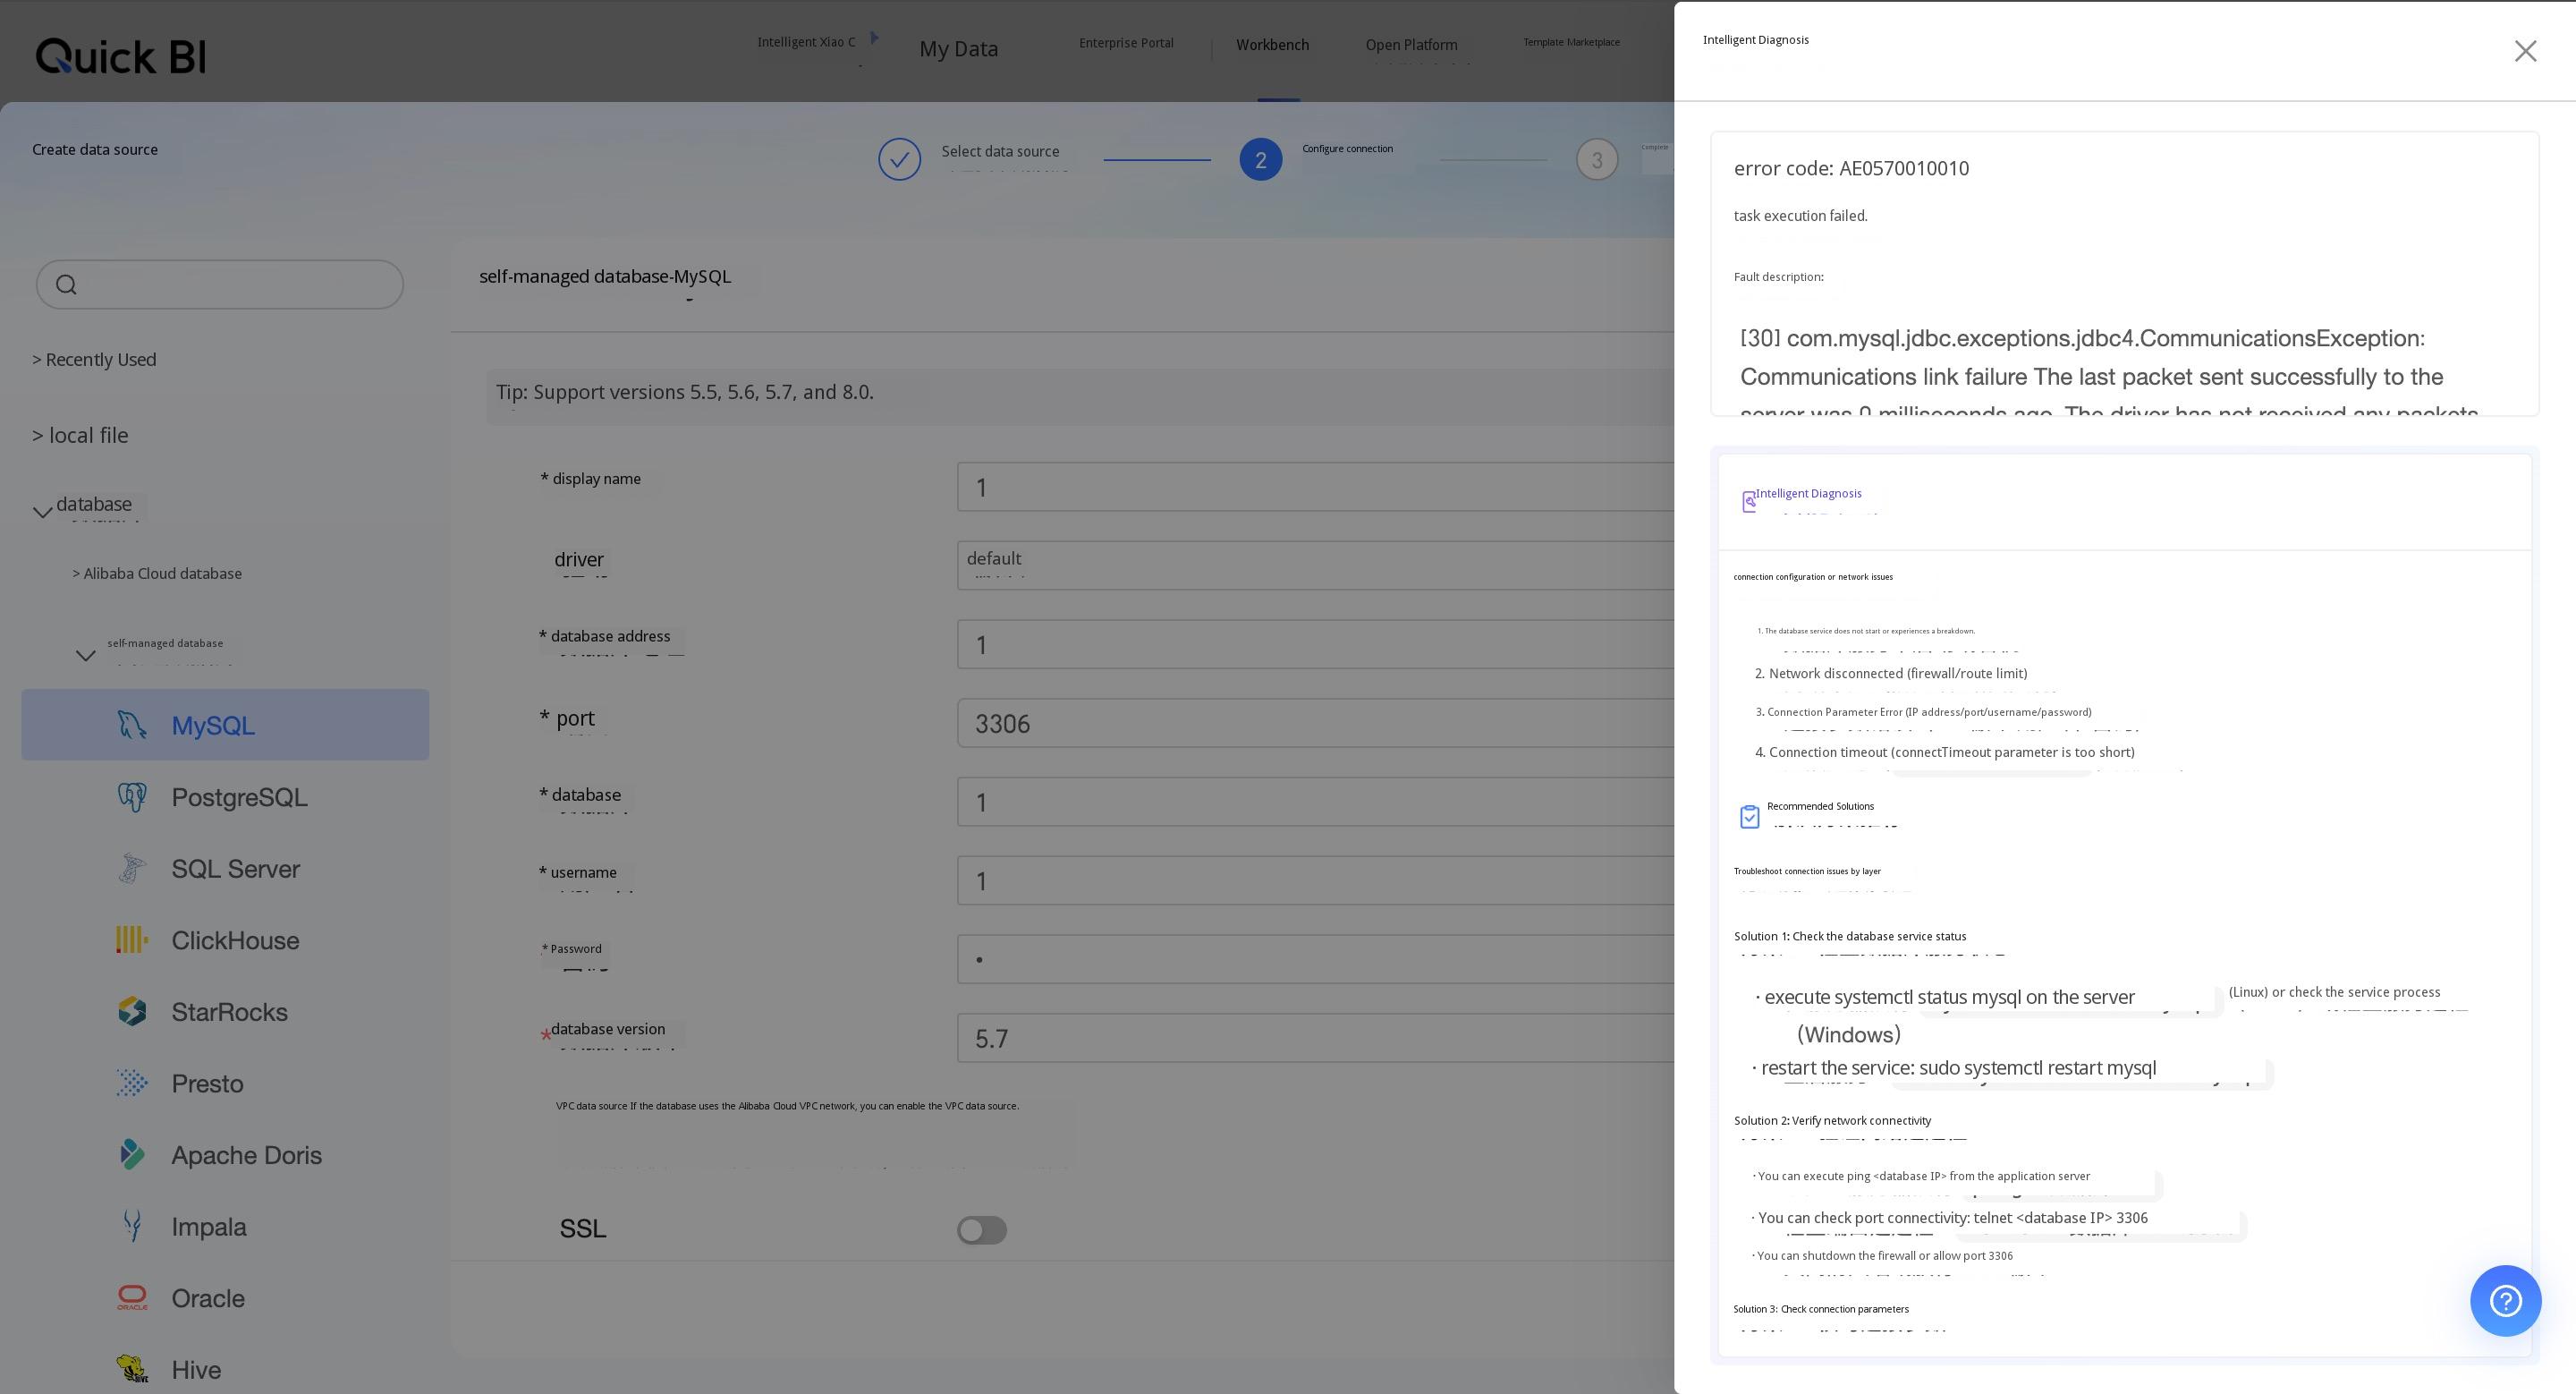
Users often encounter native database error messages during data queries. These messages contain a large number of technical terms and are difficult to understand, making it hard to identify the specific cause of the issue. This leads to high communication costs and a poor user experience.
Feature overview:
Intelligent Diagnosis leverages the capabilities of large language models (LLMs) to perform the following analysis:
During Monday morning meetings, a precisely delivered long image on users’ phones clearly highlights fluctuations in last week’s core metrics.
On Wednesday afternoon, collaborative data in DingTalk is synchronized within seconds, enabling instant deep drill-down analysis.
Before leaving work on Friday, business users can build a brand-new analytical model with zero threshold.
This is not a vision of the future, but the daily reality enabled by Quick BI V6.1.
Business intelligence with zero threshold, high efficiency, and true intelligence is no longer just a tool for improving analyst productivity—it is becoming an engine that reshapes how every business department works. We are turning delayed guesswork and uncertain fluctuations into real-time insights and more certain growth.
Quick BI Smart Q V6.1: Making the AI Data Analyst Easier to Use

1,568 posts | 525 followers
FollowAlibaba Cloud Community - April 14, 2026
Alibaba Cloud Community - April 2, 2026
PM - C2C_Yuan - August 1, 2023
Alibaba Cloud Community - June 18, 2026
Alibaba Clouder - July 15, 2020
Alibaba Clouder - January 8, 2021
1,568 posts | 525 followers
Follow Big Data Consulting for Data Technology Solution
Alibaba Cloud provides big data consulting services to help enterprises leverage advanced data technology.
Learn More Big Data Consulting Services for Retail Solution
Alibaba Cloud experts provide retailers with a lightweight and customized big data consulting service to help you assess your big data maturity and plan your big data journey.
Learn More Quick BI
A new generation of business Intelligence services on the cloud
Learn More Realtime Compute for Apache Flink
Realtime Compute for Apache Flink offers a highly integrated platform for real-time data processing, which optimizes the computing of Apache Flink.
Learn MoreMore Posts by Alibaba Cloud Community

