By Yahai
On a scorching summer day, you open a food delivery app to order milk tea but the order fails. During the May Day holiday, you are on a self-driving tour but the navigation responds slowly, so you frequently miss turns. Late at night, while tutoring your child, you find that the GPT application is unresponsive. Have you ever wondered what lies behind when these programs are running? What happens with each click and every interaction?
If you are an SRE, will you pay attention to the performance bottleneck of the system? If you are an AppOps, will you pay attention to maintaining the application's health at a safe level? If you are a business operator, will you pay attention to the key paths and reasons that affect customer behaviors?
The answer to these puzzles is tracing. By recording the flow paths and statuses of requests in the system, you can restore the call trajectory of each request, quickly locate the root cause of failed and slow exceptions, and implement business impact analysis and business exception troubleshooting through data association at the request level.
The value of the tracing lies in the association. The user terminal, gateway, backend application, and the dependent components such as the database, message, and large models constitute the tracing trajectory topology together. If the topology has a wider coverage, the tracing will have a greater value. End-to-end tracing is a best practice solution that covers all associated IT systems and can completely record the call paths and statuses of user behaviors between systems.
Different programming languages and frameworks have varied implementations. To fully achieve end-to-end tracing, three problems need to be solved: instrumentation, trace collection and processing, and context propagation.
• Trace instrumentation, as the name implies, is to add the instrumentation code of tracing before and after the execution of a key method, so as to record the corresponding method information such as name, duration, and status. Instrumentation is the foundation. Only the instrumented method generates trace data, which can be traced and observed. However, it is difficult to determine which methods need to be instrumented. How can we add or manage the instrumentation logic at a low cost? How can we ensure the accuracy, performance, and stability of instrumentation?
• Trace collection and processing is to collect the generated trace data to the specified backend for processing and storage for subsequent analysis. The difficulty of trace collection lies in how to determine the collection target and receive complete trace data, especially the data generated by cloud products and services (such as gateways). The difficulty of trace processing lies in how to process non-native trace data (such as gateway access logs) or normalize the multi-source heterogeneous trace models.
• Trace context propagation is the most overlooked and difficult issue to deal with. Currently, the industry has not fully unified the protocol of context propagation. The commonly used mainstream protocols include W3C, B3, Jaeger, and SkyWalking. It is common for different systems to choose different trace protocols due to reasons such as programming languages, open-source frameworks, and product ownership, which leads to problems such as incomplete trace and trace breakage. In addition, protocol incompatibility may also occur during the migration of trace frameworks, such as SkyWalking and OpenTelemetry.
Alibaba Cloud Application Real-Time Monitoring Service (ARMS) (including Managed Service for OpenTelemetry) supports end-to-end connections between user terminals (Web, Andriod, and iOS) -> cloud gateways (ALB, MSE, Ingress, ASM, and ApiGateway) -> backend applications (Java, Go, and Python) -> cloud components (databases, messages, and large models), as shown in the following figure.
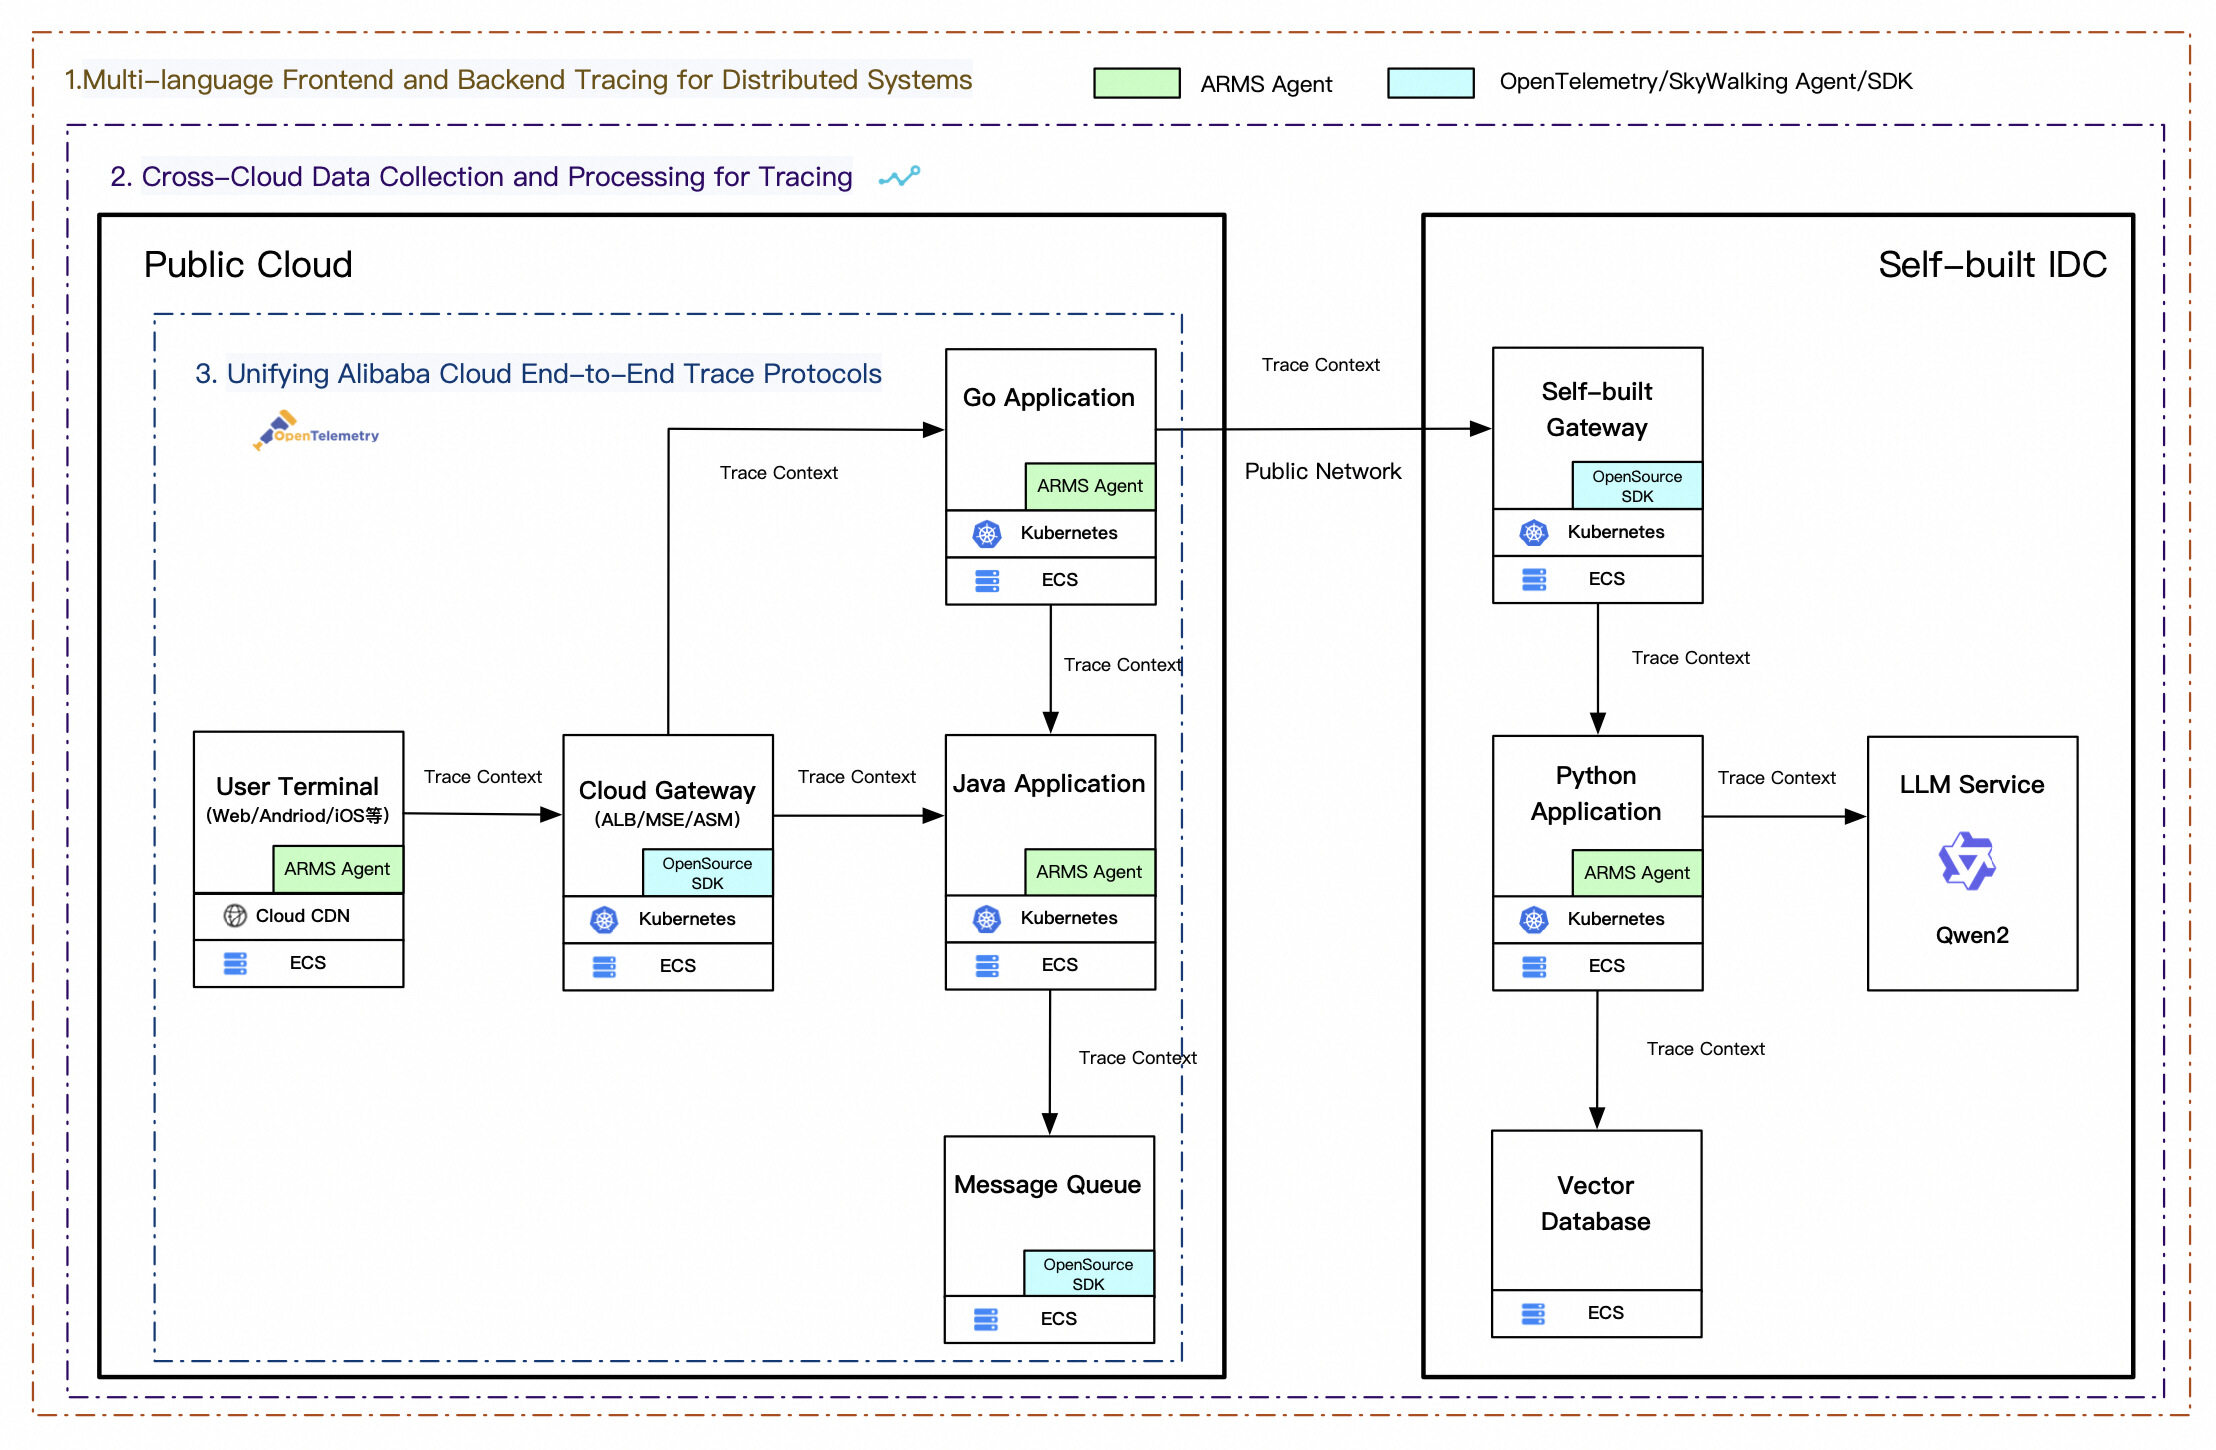
For mainstream languages such as Java, Go, and Python, it is recommended to integrate ARMS self-built agents to improve the quality, performance, stability, and usability of instrumentation. At the same time, in order to support more languages, Managed Service for OpenTelemetry is fully compatible with OpenTelemetry, SkyWalking, Zipkin, and Jaeger. It supports instrumentation and data reporting in more than 10 languages, as shown in the table below.
ARMS is fully interoperable with Managed Service for OpenTelemetry, so we recommend that you use ARMS together with Managed Service for OpenTelemetry in multi-language scenarios.
| Programming language | ARMS (self-built agent with guaranteed SLA) | Managed Service for OpenTelemetry (open-source client, self-managed) | Recommended access mode |
|---|---|---|---|
| Java | Automatic instrumentation | Automatic instrumentation | ARMS |
| Go | Automatic instrumentation is under development and will be released in July | Automatic instrumentation | SkyWalking -> ARMS |
| Python | Automatic instrumentation is under development and will be released in July | Automatic instrumentation | OpenTelemetry -> ARMS |
| Node.js | Not supported | Automatic instrumentation | OpenTelemetry |
| .NET | Not supported | Automatic instrumentation | OpenTelemetry |
| PHP | Not supported | Automatic instrumentation | OpenTelemetry |
| Erlang | Not supported | Automatic instrumentation | OpenTelemetry |
| C++ | Not supported | Manual instrumentation | OpenTelemetry |
| Swift | Not supported | Manual instrumentation | OpenTelemetry |
| Ruby | Not supported | Manual instrumentation | OpenTelemetry |
| Rust | Not supported | Manual instrumentation | SkyWalking |
This year, ARMS released JavaAgent 4.0, which fully embraces the OpenTelemetry ecosystem. The agent is newly upgraded based on the OpenTelemetry framework and provides a variety of additional data such as resource monitoring, performance diagnosis, and application security. In addition to richer data, ARMS JavaAgent 4.0 also supports advanced features such as more flexible trace sampling policies, visualized agent management, comprehensive self-monitoring, and dynamic function degradation, making it more suitable for enterprise customers in the production environment, as shown in the following table.
|
Category |
Feature |
ARMS |
Open-source OpenTelemetry |
Open-source SkyWalking |
|
Access modes |
Black-screen startup of parameter mounting |
Supported |
Supported |
Supported |
|
Visualized automatic mounting |
Support Kubernetes environment: only modify two lines Configure ECS environment: select installation on the page |
Not supported |
Not supported |
|
|
Trace |
Multi-protocol propagation and compatibility |
W3C, Jaeger, B3, SkyWalking, and EagleEye |
W3C, Jaeger, and B3 |
SkyWalking |
|
Sampling policy |
Fixed-rate sampling, traffic-adaptive sampling, failed and slow exception sampling, and interface-level custom full sampling |
Fixed-rate sampling [1] |
Traffic-adaptive sampling [2] |
|
|
Span compression |
Loop call of compression to solve the problems of data duplication and slow query |
Not supported |
Not supported |
|
|
Logs |
MDC |
Supported |
Supported |
Supported |
|
Metrics |
Lossless traffic statistics (unaffected by sampling rate) |
Supported |
Supported |
Not supported |
|
Monitoring metrics |
Supported metrics include RED, JVM, thread pool, connection pool, and host |
Supported metrics include RED and JVM |
Supported metrics include JVM and connection pool |
|
|
Dimension drill-down |
Support multi-dimensional drill-downs such as upstream services, downstream services, and exceptions |
Not supported |
Not supported |
|
|
Profiling |
Continuous profiling |
Support regular operation with low overhead (CPU +5%, Mem +0.2%) and correlation with traces, and allow drilling down to the method stack with slow calls |
Not supported |
Not supported |
|
Memory diagnostics |
Support HeapDump and flame graphs |
Not supported |
Not supported |
|
|
Online diagnosis |
Support Arthas's real-time diagnosis |
Not supported |
Not supported |
|
|
Security |
RASP |
Supported |
Not supported |
Not supported |
|
Agent performance (data from internal test environment) |
Startup time |
8.1s (optimizing) |
6.2s |
8.7s |
|
Resource overhead |
The CPU and RSS are basically the same. (ARMS supports more features and has better performance after it is disabled.) |
|||
One of the pain points for enterprises accessing the cloud is the heavy reliance on the availability of cloud product services. End-to-end Tracing Analysis can quickly locate abnormal nodes with failed and slow requests, improve the efficiency of fault recovery, and reduce business losses. So how do users access the trace data of cloud products?
Managed Service for OpenTelemetry has cooperated with nearly 10 Alibaba Cloud products to complete internal trace instrumentation and data reporting. Enterprise users only need to enable the Tracing Analysis switch in the corresponding cloud product console with one click to directly view the corresponding trace, which greatly reduces the trace collection cost.
Due to the product features, the trace instrumentation solutions of different cloud products are different. The supported trace data collection is roughly divided into two categories:
• Direct/forwarded trace reporting: Taking user experience monitoring as an example, the internal implementation of instrumentation and Exporter direct reporting is more precise and flexible.
• Log data conversion to Trace: Taking the ALB gateway as an example, access logs are consumed in the background and then converted into Trace data, which is less intrusive.
The two schemes have their own advantages and disadvantages. The first one is usually recommended because it is more standardized. However, if the performance requirements are high or the old system is difficult to transform, you can consider the second one (the prerequisite is that you must add trace context such as TraceId to the logs).
The following table shows the cloud services, protocols, and access guides that support access to Tracing Analysis.
|
Category |
Client |
Access Guide |
Supported Protocol |
|
User terminals |
Web, H5, and mini programs |
User experience monitoring: Trace associated with monitoring [3] |
W3C, B3, Jaeger, SkyWalking, and EagleEye |
|
Andriod |
Use OpenTelemetry to report the trace data of Android applications [4] |
W3C, B3, and Jaeger |
|
|
iOS |
Use OpenTelemetry to report the trace data of Swift applications [5] |
W3C, B3, and Jaeger |
|
|
Gateway |
ALB |
Enable Managed Service for OpenTelemetry for ALB [6] |
B3 |
|
MSE |
Enable Tracing Analysis for a cloud-native gateway[7] |
W3C, B3, and SkyWalking |
|
|
API Gateway |
Configure Tracing Analysis [8] |
B3 |
|
|
ASM |
Enable distributed tracing in ASM [9] |
B3 |
|
|
ACK Ingress |
Enable Tracing Analysis for Ingresses[10] |
W3C, B3, and Jaeger |
|
|
Backend applications |
Java (self-built) |
Connect to ARMS to monitor Java applications [11] |
W3C, B3, Jaeger, SkyWalking, and EagleEye |
|
Multi-language (open-source) |
Access Managed Service for OpenTelemetry [12] |
W3C, B3, Jaeger, and SkyWalking |
|
|
Dependency components |
Support over 100 plug-ins, covering RPC, message queue, database, and task scheduling |
||
From the perspective of a single application component, the job is well done if trace instrumentation and data collection are implemented and the corresponding Trace data can be viewed on the console. However, true end-to-end tracing must link upstream and downstream Traces using a unified protocol to ensure continuity. This presents not only technical challenges but also coordination difficulties.
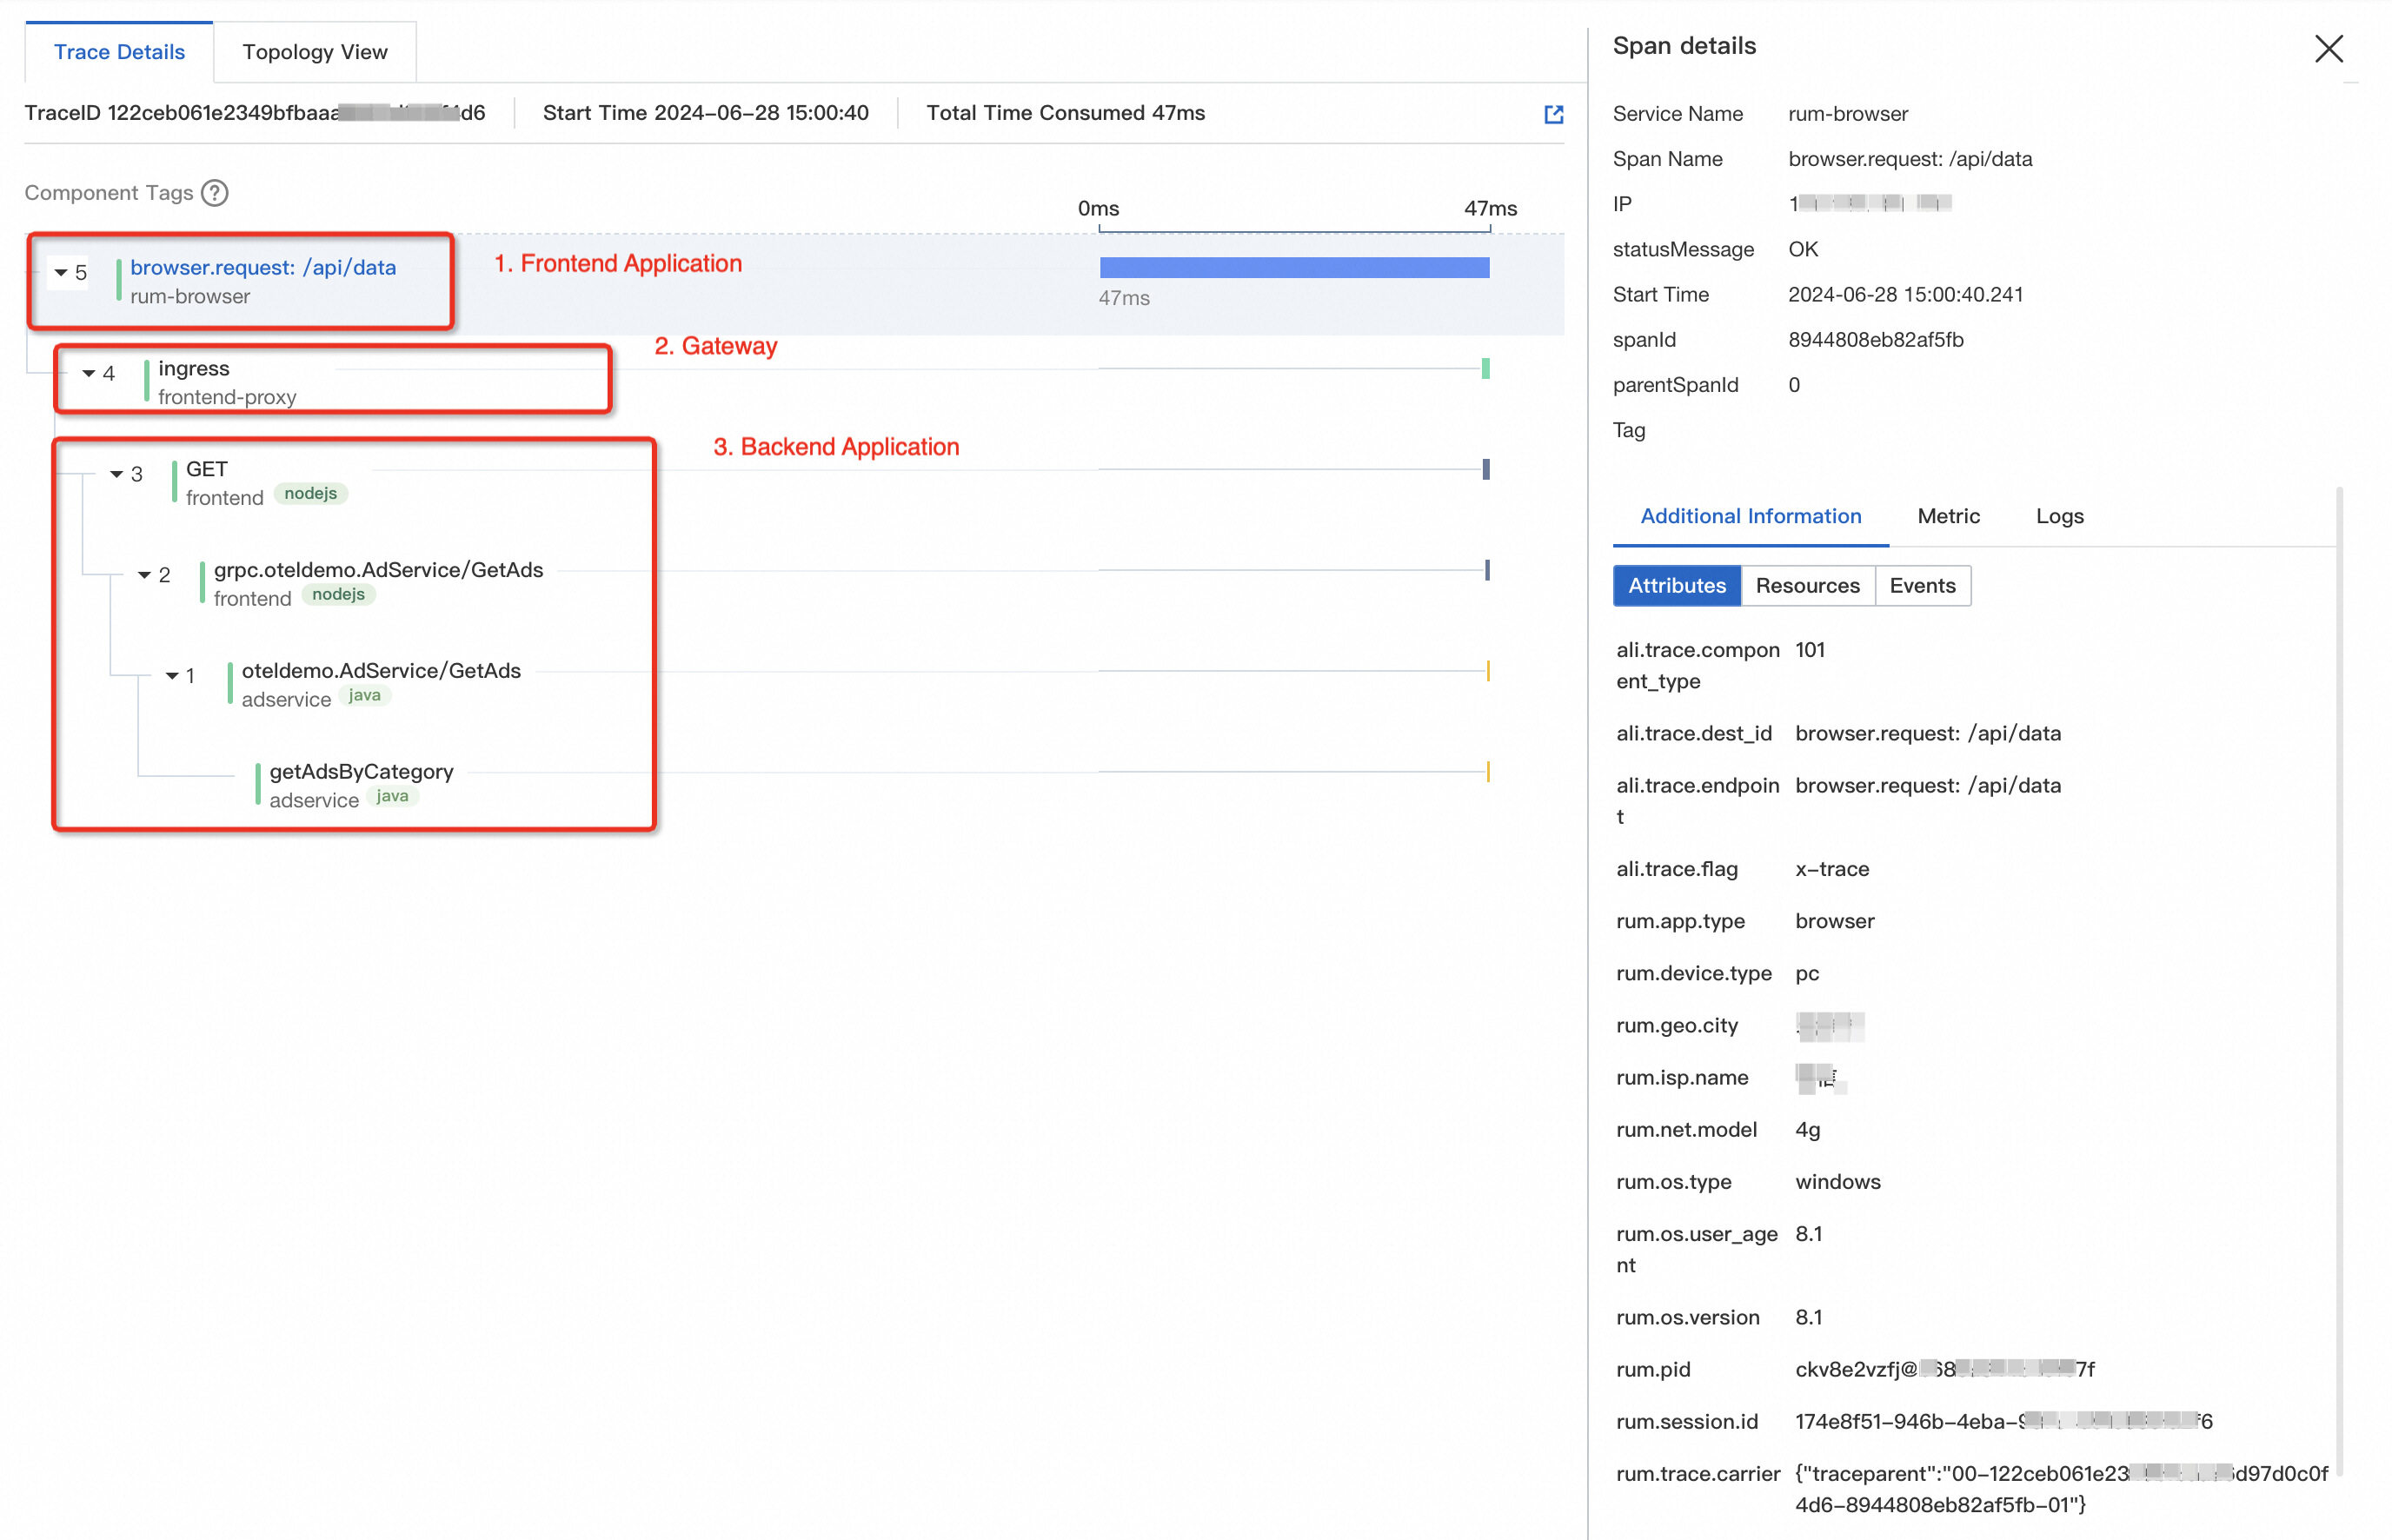
Currently, Alibaba Cloud observability has achieved end-to-end trace integration based on the OpenTelemetry W3C protocol. In the future, it will gradually cover more protocols and components for full trace propagation to build a more complete and flexible trace ecosystem. The complete end-to-end trace is shown in the figure below.
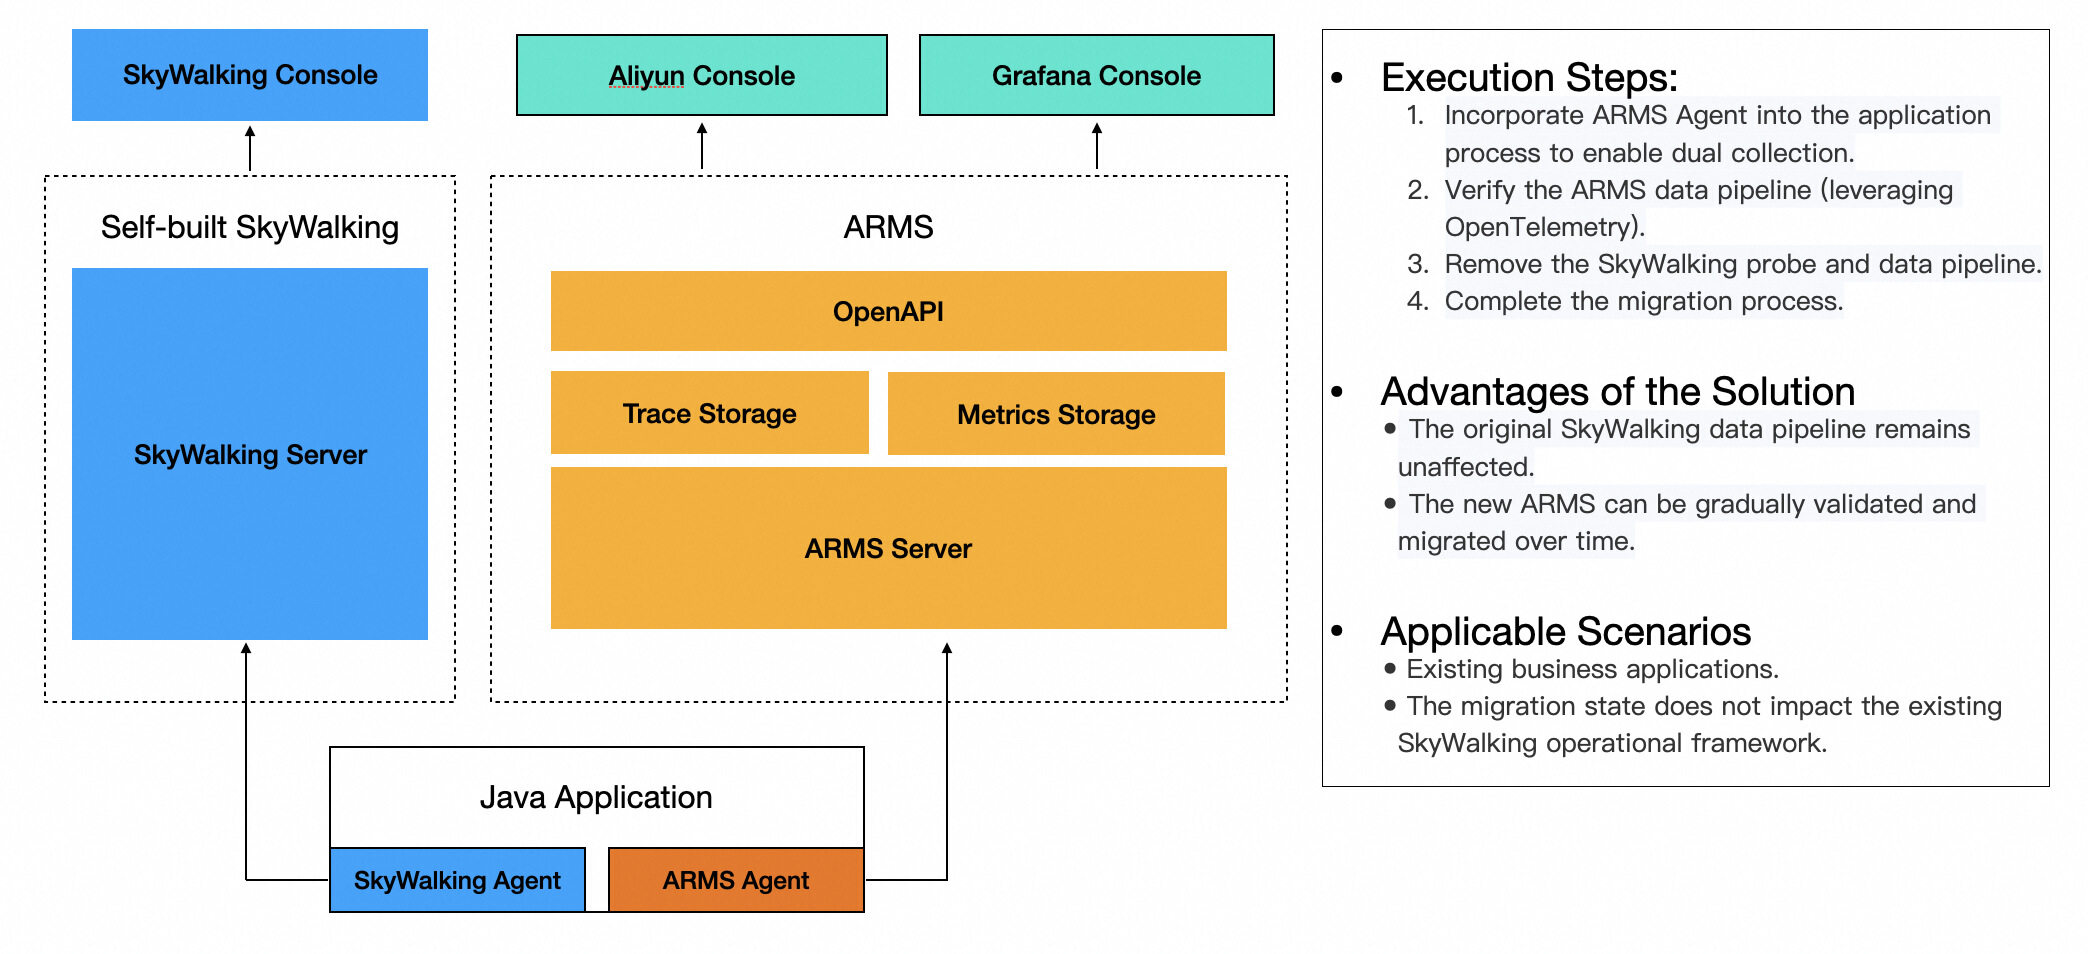
Compared with new applications accessing Trace, existing applications face greater challenges to end-to-end protocol stack unification. In particular, in the case of switching between the old and new technology stacks (such as migrating SkyWalking to OpenTelemetry), it is necessary to ensure the continuous availability of the existing O&M system and verify the effectiveness of the new system at the same time. How can two different trace systems coexist? It is the biggest problem that affects the upgrade of existing application technology stacks or trace connections.
In order to solve this problem, ARMS self-built agents have made a large number of compatibility optimizations, and finally realized the coexistence of two agents, ensuring that the two systems can run correctly and stably at the same time until the migration is completed, as shown in the following figure.
The ARMS agent supports multi-protocol identification and propagation. In some special scenarios, if the upstream and downstream systems are difficult to change, you can use the ARMS Agent to transfer the protocol. For example, the upstream application A uses the Jaeger protocol -> ARMS Agent (receives Jaeger and passes through Jaeger and Zipkin B3) -> The downstream application B uses the Zipkin B3 protocol to pass through and connect the TraceId.
Tracing Behavior Convention: Trace instrumentation, data collection, and protocol propagation are merely the foundations of end-to-end tracing. How to use trace data more effectively to address demands in stable O&M and business operation growth, requires further exploration. This includes unified tracing behavior control (such as sampling policies and traffic labels) and extensive data correlation analysis (such as trace-associated metrics, logs, and events).
OpenTelemetry Best Practice: As a mainstream open-source standard for observability, OpenTelemetry provides a wide range of components for trace instrumentation. However, many enterprise developers commonly report a lack of best practice guidance when applying it in production environments, such as how to implement trace context propagation in asynchronous scenarios, filter specified span, associate application logs, specify the propagation Header format, and write TraceId to the HTTP Response Header. The Alibaba Cloud observability team upholds the spirit of "open source and openness" and is committed to providing comprehensive and reliable OpenTelemetry best practice guidance (codes, documents, and videos). Welcome to participate in the building .
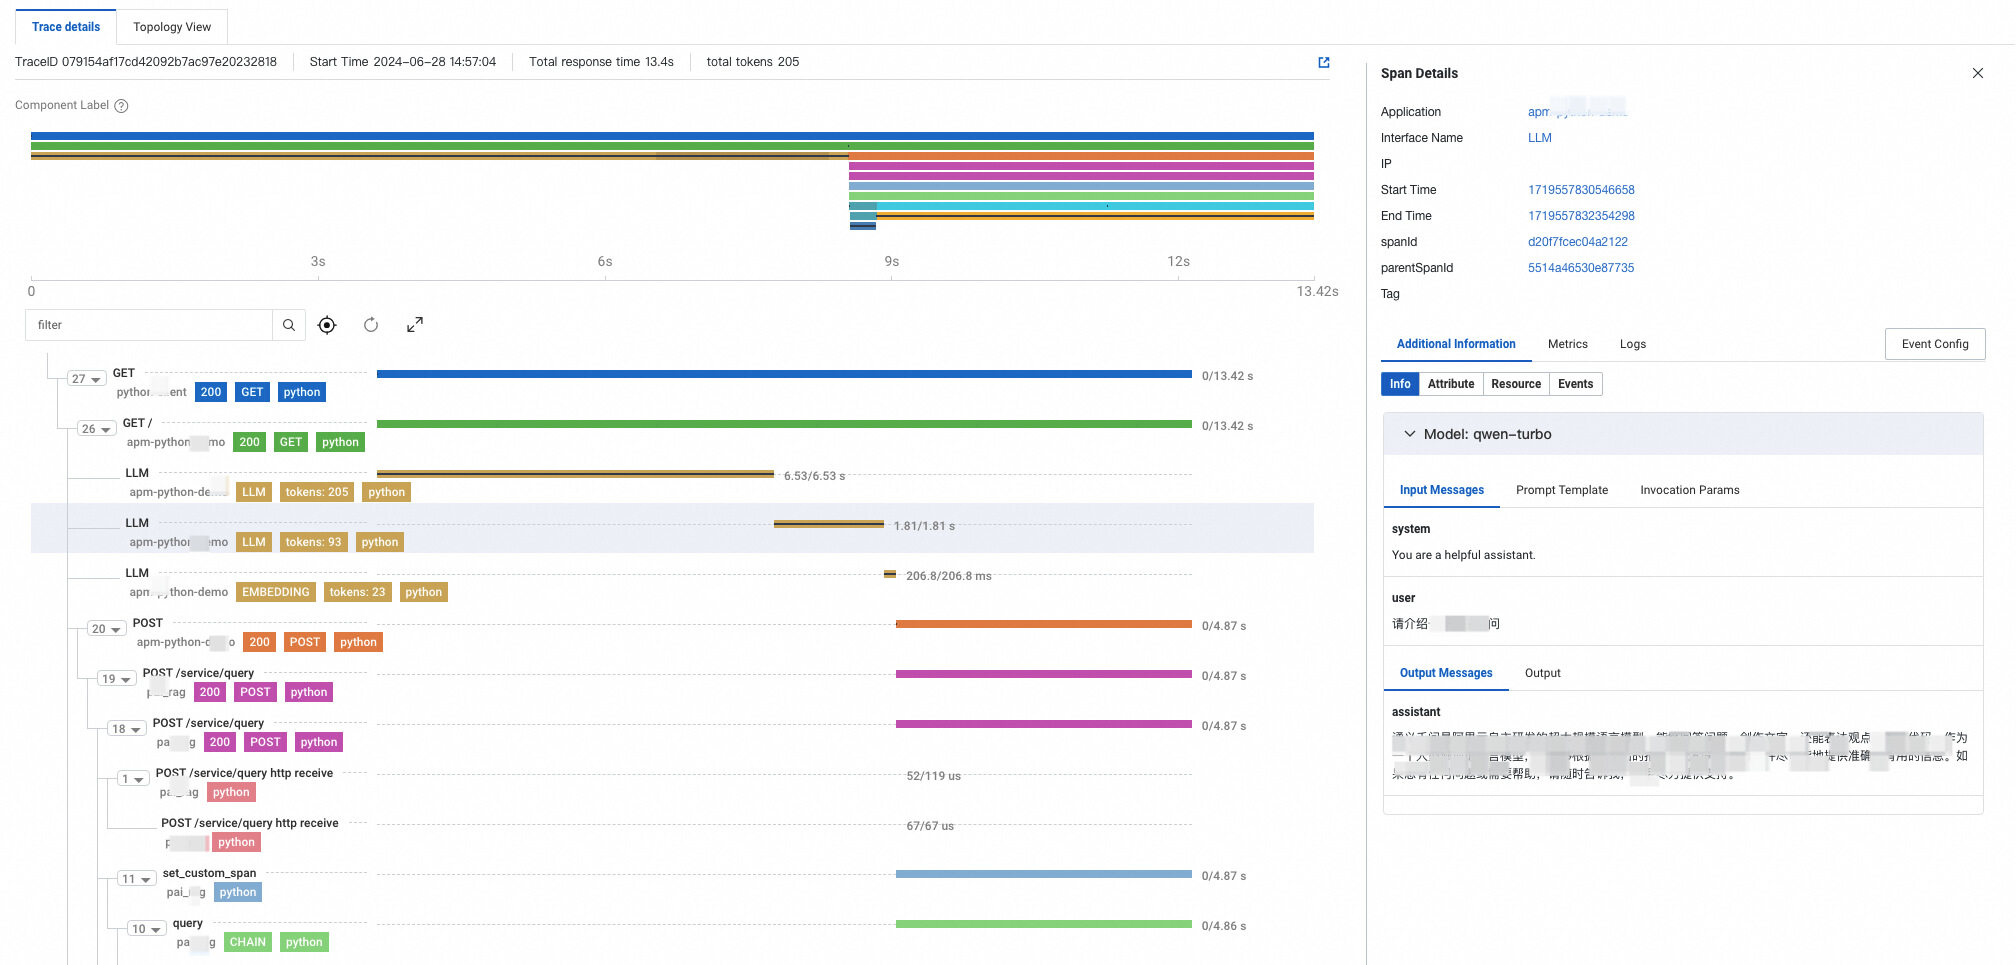
Development of the Trace Ecosystem: Tracing enables cross-node data propagation and association at the request level. Based on the trace system, a rich trace ecosystem can be incubated, including end-to-end stress test, end-to-end canary release, architecture awareness, root cause analysis, and impact analysis. In the LLM field, tracing can also play a role in helping algorithm engineers and O&M staff track the process and results of each model training or inference, and effectively identify and solve "illusion", evaluation and fine-tuning problems. Alibaba Cloud LLM Trace will be officially released in May 2024, as shown in the following figure.
[1] Fixed-rate Sampling
[2] Traffic-adaptive Sampling
[3] User Experience Monitoring: Trace Associated with Monitoring
[4] Use OpenTelemetry to Report the Trace Data of Android Applications
[5] Use OpenTelemetry to report the Trace Data of Swift Applications
[6] Enable Managed Service for OpenTelemetry for ALB
[7] Enable Tracing Analysis for a Cloud-native Gateway
[8] Configure Tracing Analysis
[9] Enable Distributed Tracing in ASM
[10] Enable Tracing Analysis for Ingresses
[11] Connect to ARMS to Monitor Java Applications
[12] Access Managed Service for OpenTelemetry

212 posts | 13 followers
FollowAlibaba Clouder - March 5, 2021
Alibaba Cloud Native Community - February 8, 2025
Alibaba Clouder - April 12, 2021
Alibaba BlockChain Service Team - August 29, 2018
Alibaba Cloud Native Community - January 20, 2026
H Ohara - March 13, 2024

212 posts | 13 followers
Follow Application Real-Time Monitoring Service
Build business monitoring capabilities with real time response based on frontend monitoring, application monitoring, and custom business monitoring capabilities
Learn More Managed Service for OpenTelemetry
Allows developers to quickly identify root causes and analyze performance bottlenecks for distributed applications.
Learn More Real-Time Streaming
Provides low latency and high concurrency, helping improve the user experience for your live-streaming
Learn More Real-Time Livestreaming Solutions
Stream sports and events on the Internet smoothly to worldwide audiences concurrently
Learn MoreMore Posts by Alibaba Cloud Native