When troubleshooting latency or errors at the cluster entry point, you need visibility into how requests flow through NGINX Ingress. By enabling tracing, you export trace data from the NGINX Ingress Controller in a Container Service for Kubernetes (ACK) cluster to Managed Service for OpenTelemetry, where the ARMS console displays request traces and service topology for ingress traffic.
Prerequisites
Before you begin, make sure that you have:
Version compatibility
Tracing protocol support depends on your NGINX Ingress controller version:
| NGINX Ingress controller version | OpenTelemetry | OpenTracing |
|---|---|---|
| >= 1.10.2-aliyun.1 | Supported | Not supported |
| v1.9.3-aliyun.1 | Supported | Supported |
| v1.8.2-aliyun.1 | Supported | Supported |
| < v1.8.2-aliyun.1 | Not supported | Supported |
Enable tracing with OpenTelemetry
Use this method if your NGINX Ingress controller version is v1.8.2-aliyun.1 or later.
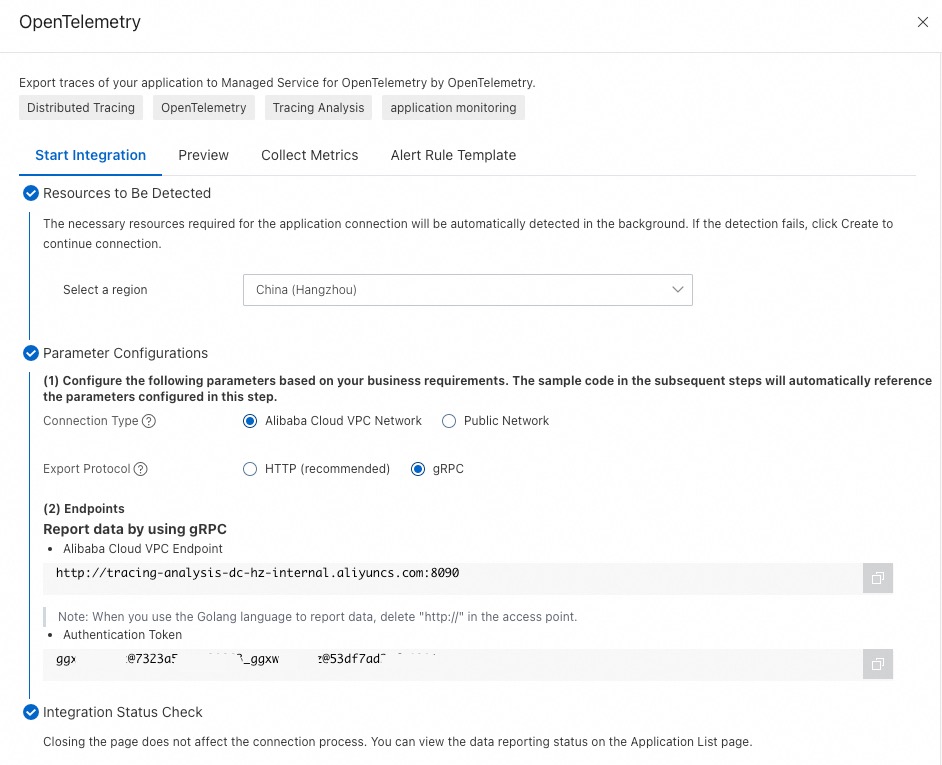
Step 1: Get the OpenTelemetry endpoint
Log on to the ARMS console. In the left-side navigation pane, click Integration Center.
In the Server-side Applications section, click the OpenTelemetry card.
In the OpenTelemetry panel, select the region from which to report data.
Record the endpoint and authentication token.
NoteUse a VPC endpoint when the NGINX Ingress Controller and the Managed Service for OpenTelemetry agent are in the same region. Use a public endpoint when they are in different regions.
Step 2: Configure NGINX Ingress Controller
2a. Add the authentication environment variable
Log on to the ACK console. In the left-side navigation pane, click Clusters.
On the Clusters page, find the target cluster and click its name. In the left-side pane, choose Workloads > Deployments.
Select kube-system from the Namespace drop-down list. Search for
nginx-ingress-controller, find the deployment, and click Edit in the Actions column.On the Edit page, select the nginx-ingress-controller container. On the Environments tab, click Add and add the following environment variable: Replace
<authentication-token>with the token from Step 1. Example:authentication=bfXXXXXXXe@7bXXXXXXX1_bXXXXXe@XXXXXXX1.Type Variable key Value Custom OTEL_EXPORTER_OTLP_HEADERS authentication=<authentication-token>
Click Update, then click Confirm.
2b. Update the nginx-configuration ConfigMap
In the left-side navigation pane, choose Configurations > ConfigMaps.
Select kube-system from the Namespace drop-down list. Search for
nginx-configuration, find the ConfigMap, and click Edit in the Actions column.In the Edit panel, click Add to add the following key-value pairs, then click OK. At minimum, set
enable-opentelemetry,main-snippet,otlp-collector-host, andotlp-collector-port. The remaining parameters are optional.
| Key | Description | Example |
|---|---|---|
| enable-opentelemetry | Enable OpenTelemetry tracing. | true |
| main-snippet | Load the authentication environment variable into the NGINX main configuration. | env OTEL_EXPORTER_OTLP_HEADERS; |
| otlp-collector-host | gRPC hostname for the OTLP collector. Use the VPC endpoint from Step 1 without the http:// prefix and port number. | tracing-analysis-XX-XX-XXXXX.aliyuncs.com |
| otlp-collector-port | gRPC port for the OTLP collector. | 8090 |
| otel-service-name | The custom service name. | nginx-ingress |
| opentelemetry-trust-incoming-span | Trust incoming trace context from upstream services, preserving end-to-end traces. | true |
| opentelemetry-operation-name | Span name format. | HTTP $request_method $service_name $uri |
| otel-sampler | Sampling rule. For more information about other parameters, see OpenTelemetry. | TraceIdRatioBased |
| otel-sampler-ratio | Sampling rate. Range: 0 to 1 (with two decimal places). 0: no sampling. 1: sample everything. Takes effect only when otel-sampler-parent-based is false. For more information, see OpenTelemetry. | 0.1 |
| otel-sampler-parent-based | Inherit the sampling decision from the upstream span. false (default): does not inherit, and enables otel-sampler and otel-sampler-ratio. true: inherits, and disables otel-sampler and otel-sampler-ratio. For more information, see OpenTelemetry. | false or true |
Complete ConfigMap example (YAML)
Copy this YAML template and adjust the values for your environment:
apiVersion: v1
kind: ConfigMap
metadata:
  name: nginx-configuration
  namespace: kube-system
data:
  enable-opentelemetry: "true"
  main-snippet: "env OTEL_EXPORTER_OTLP_HEADERS;"
  otlp-collector-host: "tracing-analysis-XX-XX-XXXXX.aliyuncs.com"
  otlp-collector-port: "8090"
  otel-service-name: "nginx-ingress"
  opentelemetry-trust-incoming-span: "true"
  opentelemetry-operation-name: "HTTP $request_method $service_name $uri"
  otel-sampler: "TraceIdRatioBased"
  otel-sampler-ratio: "0.1"
  otel-sampler-parent-based: "false"
Replace the otlp-collector-host value with the hostname extracted from your endpoint.
For additional tuning parameters, see the upstream OpenTelemetry addon documentation.
Step 3: Verify trace data in the ARMS console
Log on to the ARMS console. In the left-side navigation pane, choose .
In the top navigation bar, select the region and click the nginx-ingress application (or the service name set in
otel-service-name).Verify the following on the application details page:
Overview tab: Check request counts and error counts.
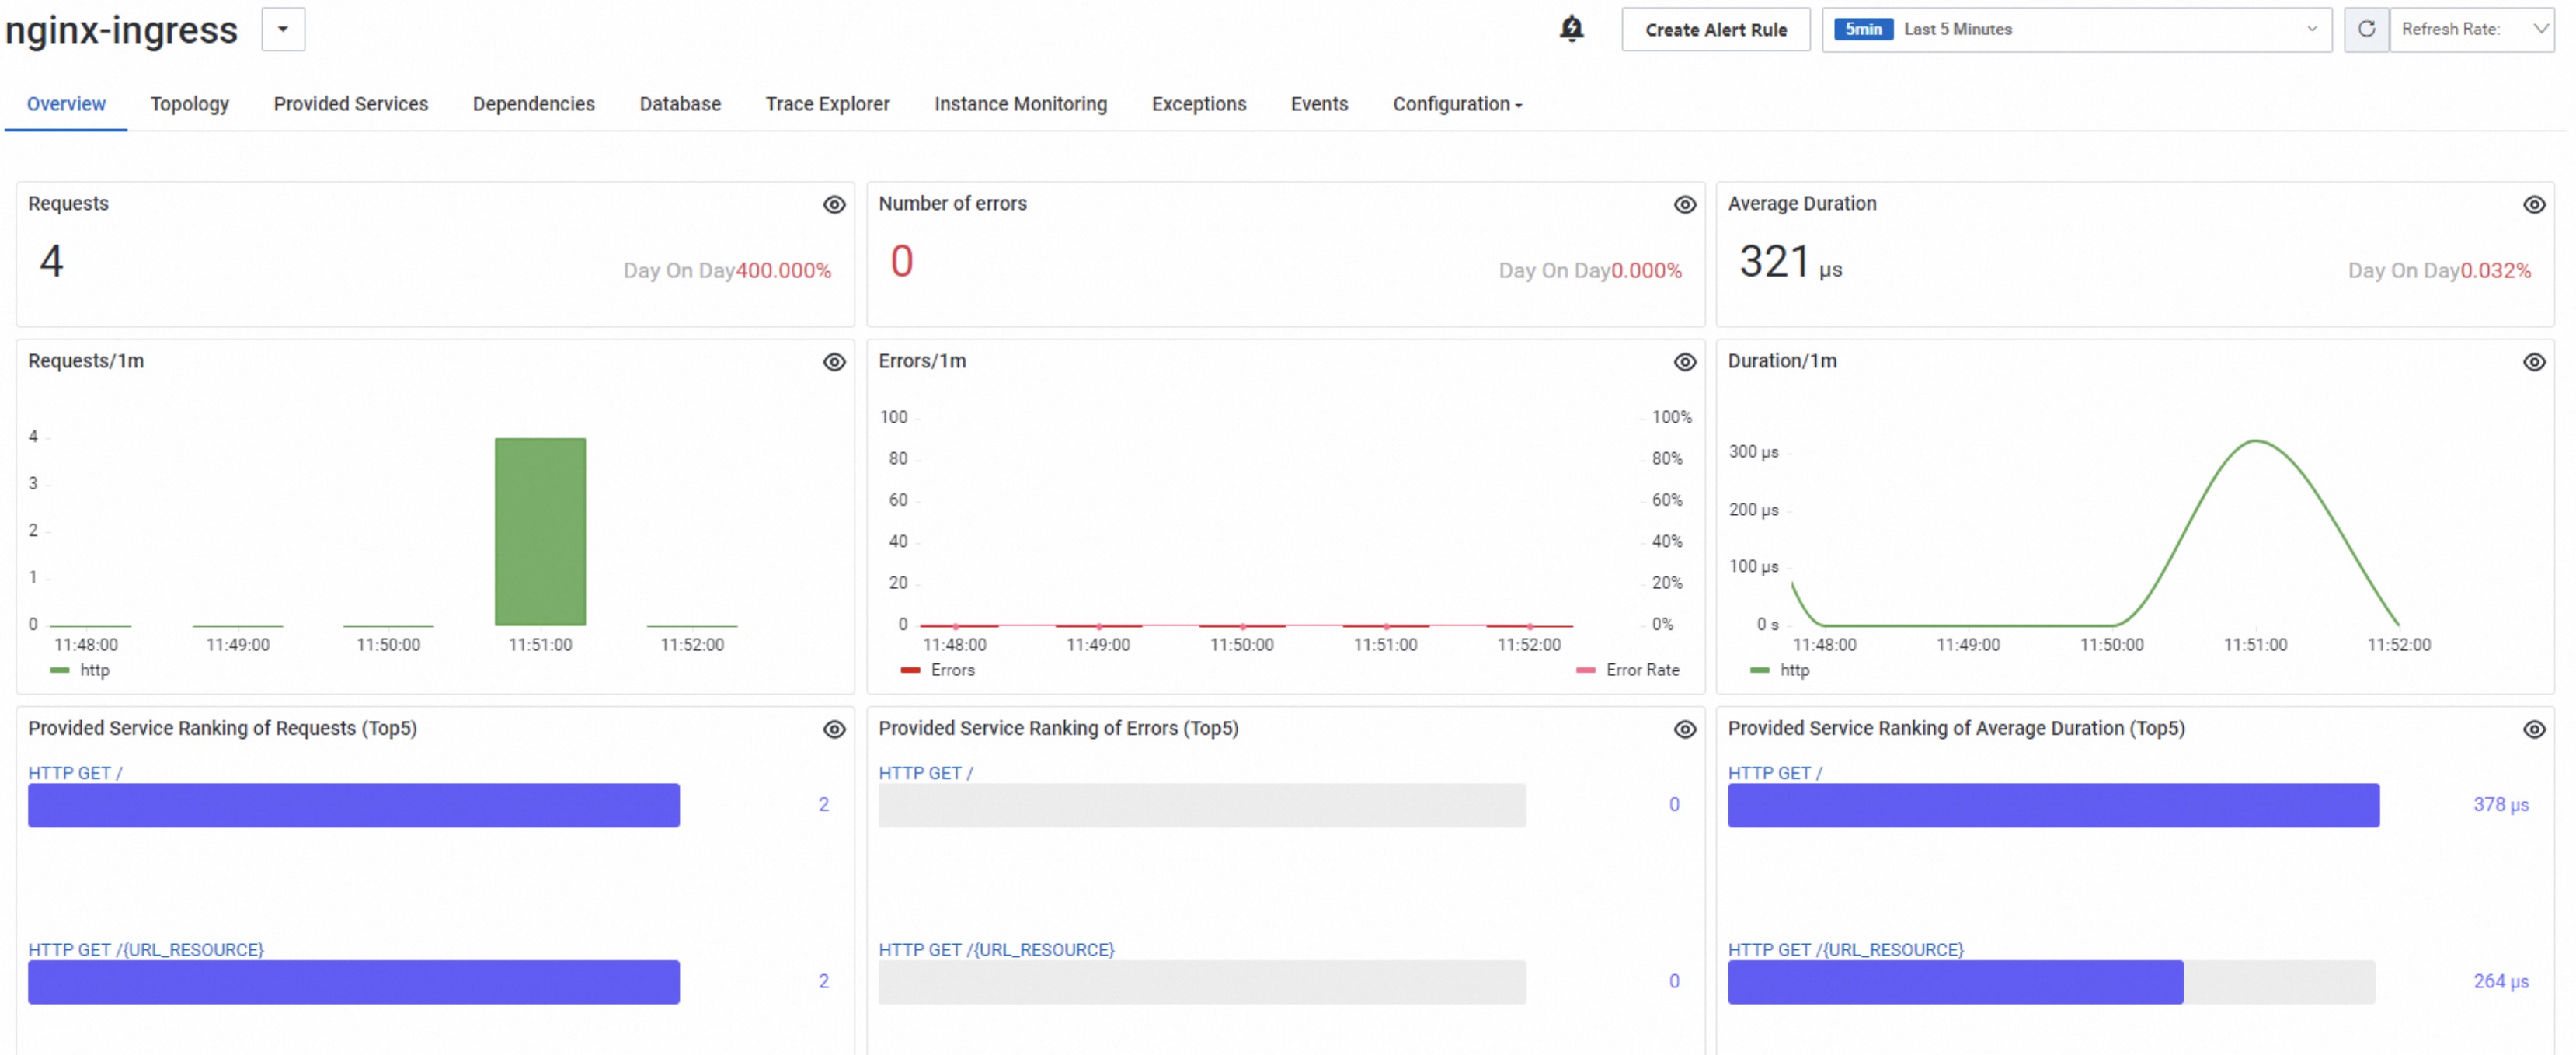
Trace Explorer tab: Browse traces and review average duration.

Click a trace ID to inspect the full trace waterfall.

(Optional) Change the trace context propagation format
By default, OpenTelemetry propagates trace context using the W3C Trace Context specification. If your frontend or backend applications use a different protocol (such as Jaeger or Zipkin B3), change the propagation format so that traces flow end-to-end across NGINX Ingress and your application services.
Return to the Deployment edit page from Step 2a. Add the following environment variable alongside
OTEL_EXPORTER_OTLP_HEADERS, then click Update and Confirm to redeploy:Type Variable key Value Description Custom OTEL_PROPAGATORS tracecontext,baggage,b3,jaegerComma-separated propagation formats. For details, see Specify the format to pass trace data. Update the
main-snippetkey in thenginx-configurationConfigMap to load both environment variables:Key Updated value main-snippet env OTEL_EXPORTER_OTLP_HEADERS; env OTEL_PROPAGATORS
Enable tracing with OpenTracing (legacy)
Use this method only if your NGINX Ingress controller version is earlier than v1.8.2-aliyun.1 and does not support OpenTelemetry.
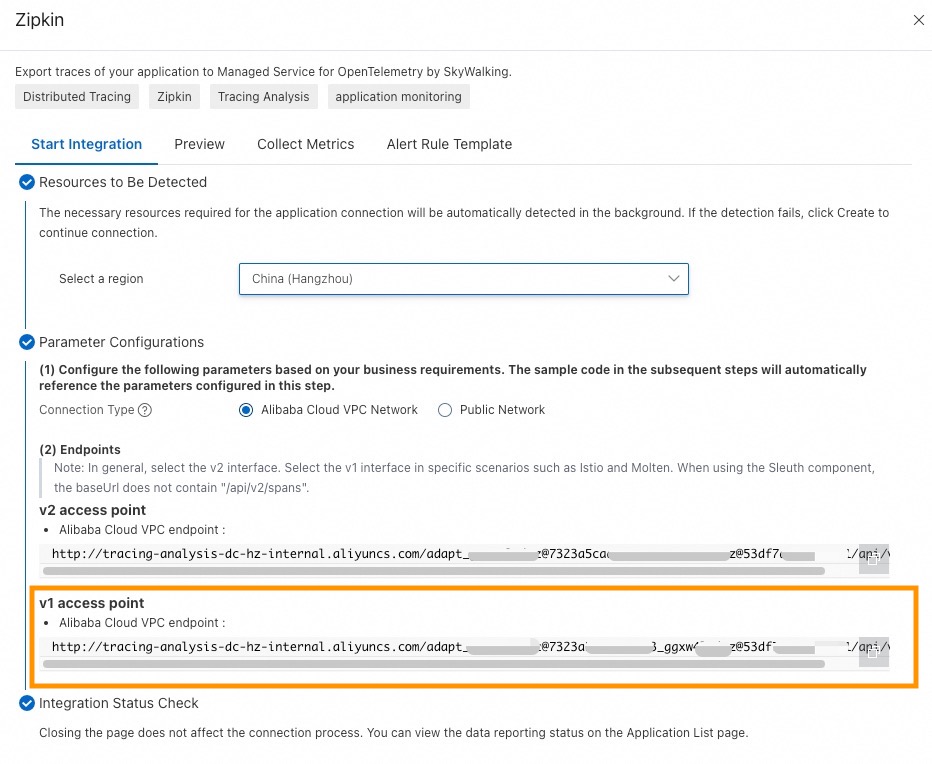
Step 1: Get the Zipkin endpoint
Log on to the ARMS console. In the left-side navigation pane, click Integration Center.
In the Server-side Applications section, click the Zipkin card.
NoteOpenTracing uses a Zipkin-compatible client for data collection.
In the Zipkin panel, select the region from which to report data.
Record the endpoint.
NoteUse a VPC endpoint when the NGINX Ingress Controller and the agent are in the same region. Use a public endpoint when they are in different regions.
Step 2: Configure the nginx-configuration ConfigMap
Log on to the ACK console. In the left-side navigation pane, click Clusters.
On the Clusters page, click the target cluster name. In the left-side navigation pane, choose Configurations > ConfigMaps.
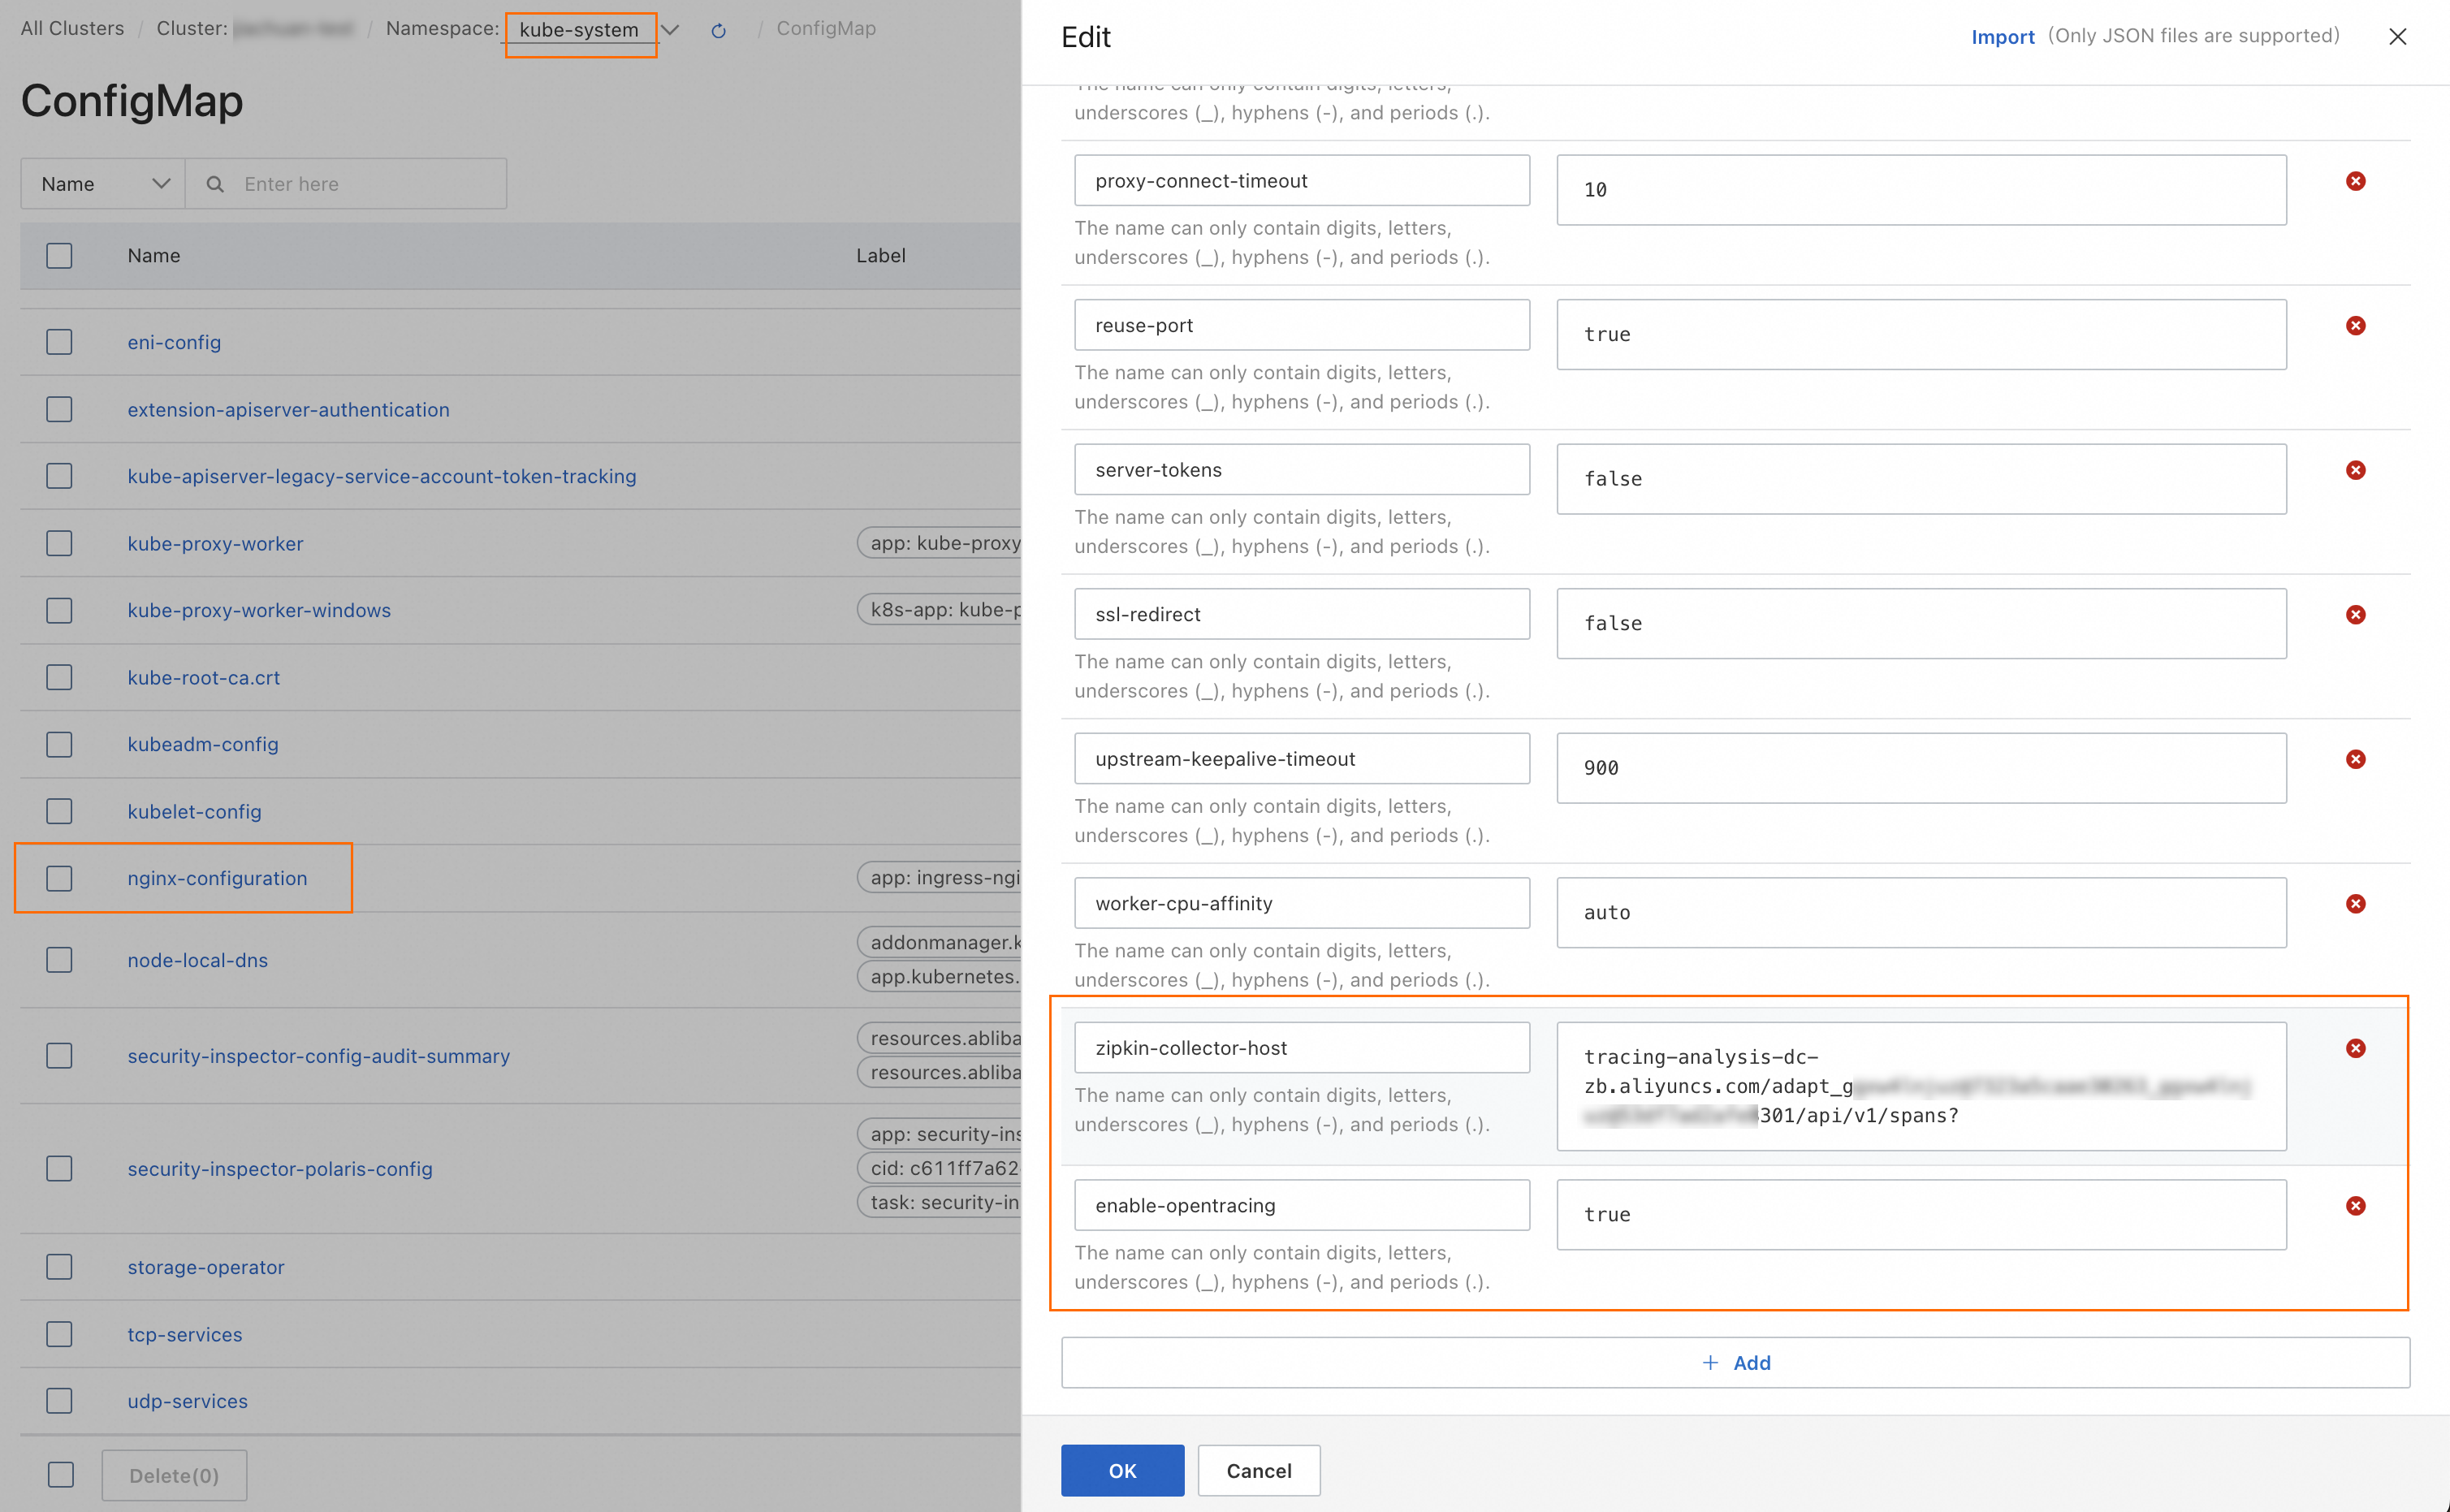
Select kube-system from the Namespace drop-down list. Search for
nginx-configuration, find the ConfigMap, and click Edit in the Actions column.In the Edit panel, click Add and set the following two keys: Endpoint format example:
Original:
http://tracing-analysis-dc-hz-internal.aliyuncs.com/adapt_******_******/api/v1/spansAfter modification:
tracing-analysis-dc-hz-internal.aliyuncs.com/adapt_******_******/api/v1/spans?
ImportantThe trailing
?is required. Without it, trace data submission fails.Key Value Description zipkin-collector-host Endpoint from Step 1 Remove http://from the beginning and append?at the end.enable-opentracing trueEnable OpenTracing. Click OK.
Step 3: Verify trace data in the ARMS console
Log on to the ARMS console. In the left-side navigation pane, choose .
In the top navigation bar, select the region and click the nginx application.
In the left-side navigation pane, click Interface Calls. On the right side, verify the following:
Overview tab: Check the trace topology.
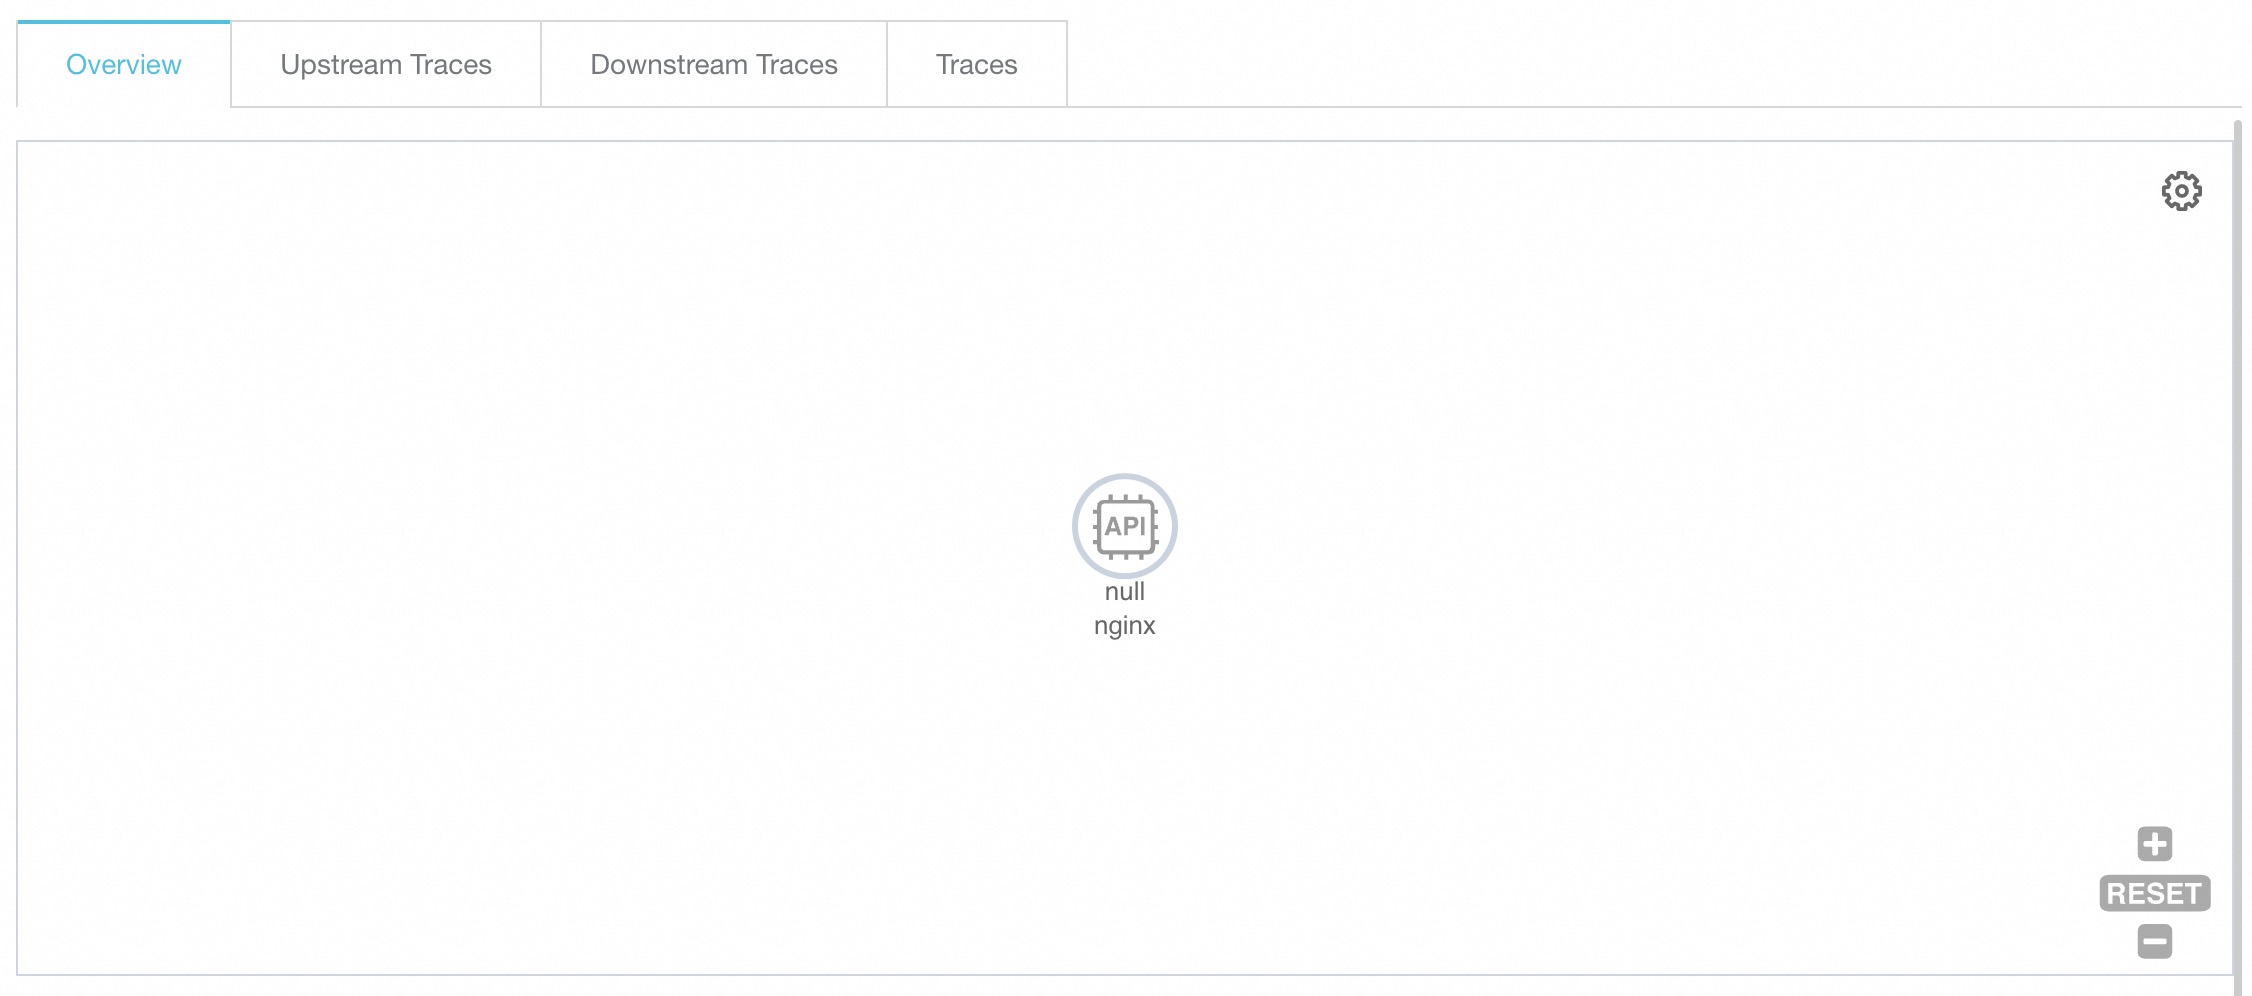
Traces tab: Review the top 100 time-consuming traces. For more information, see Interface calls.
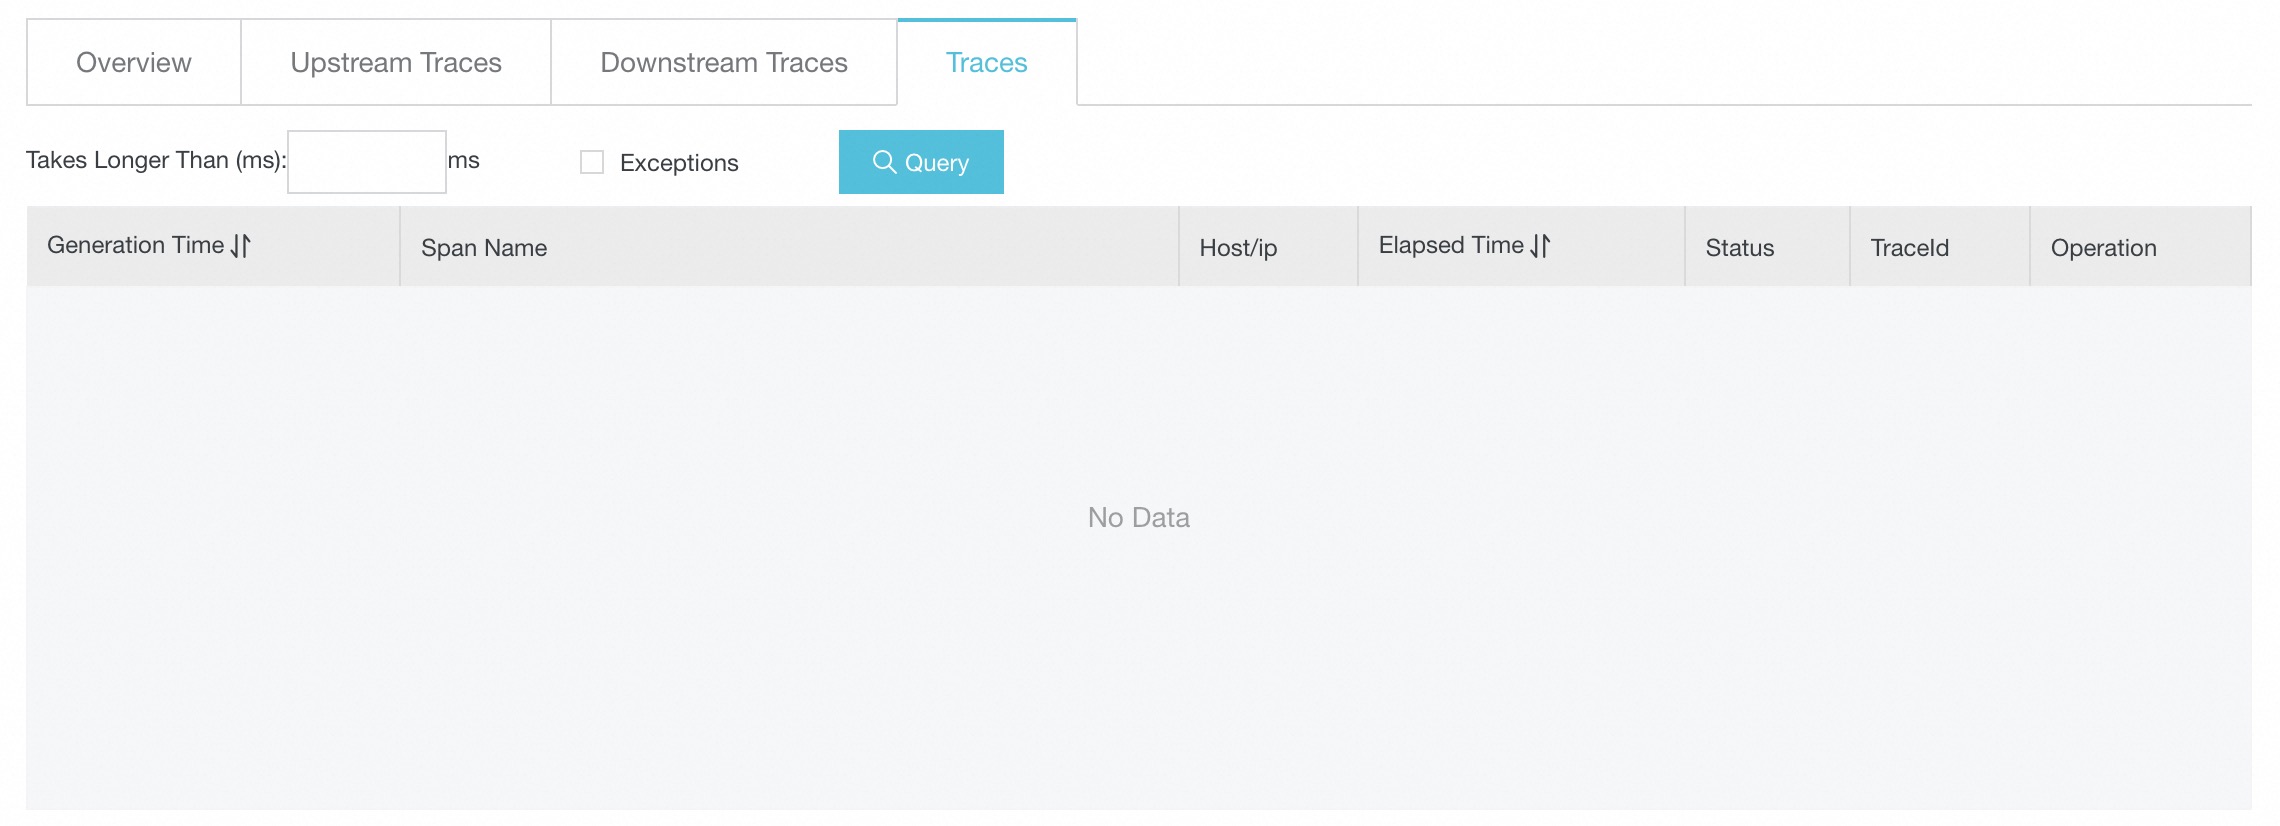
Click a trace ID to inspect the trace details.
