Application Load Balancer (ALB) is integrated with Managed Service for OpenTelemetry, which can map and analyze traces for ALB, including request sources, nodes, and response time. Managed Service for OpenTelemetry helps you quickly identify and manage service errors.
Background information
Managed Service for OpenTelemetry provides a wide range of tools that can be used to map traces, calculate the number of requests, and analyze trace topology and application dependencies. Managed Service for OpenTelemetry helps developers quickly analyze and diagnose performance issues of distributed application architectures. ALB is integrated with Managed Service for OpenTelemetry. You can enable Managed Service for OpenTelemetry for your ALB instance to perform end-to-end trace analysis. For more information, see What is Managed Service for OpenTelemetry?
Trace data records the processing information about single requests, including service calls and the response time.
Each trace contains an entry of trace data. In most cases, a trace represents the execution of a transaction or process in a distributed system. In the OpenTracing standard, a trace is a directed acyclic graph (DAG) that consists of multiple spans. Each span represents a named and timed segment that is continuously run in the trace. For more information, see What is a trace?
Precautions
Only standard and WAF-enabled ALB instances support Managed Service for OpenTelemetry. Basic ALB instances do not support Managed Service for OpenTelemetry.
After you turn on tracing, Managed Service for OpenTelemetry and Simple Log Service are automatically activated. You are charged for data reports, trace storage, and Simple Log Service. For more information, see Billing overview and Billable items of pay-by-feature.
The following table describes the regions in which Managed Service for OpenTelemetry is supported.
Area
Region
China
China (Hangzhou), China (Shanghai), China (Shenzhen), China (Chengdu), China (Qingdao), China (Beijing), China (Zhangjiakou), China (Ulanqab), China (Hong Kong), China (Guangzhou), and China (Heyuan)
Asia Pacific
Singapore, Malaysia (Kuala Lumpur), Japan (Tokyo), and Indonesia (Jakarta)
Europe & Americas
UK (London), Germany (Frankfurt), US (Virginia), and US (Silicon Valley)
Notes on disabling Managed Service for OpenTelemetry:
After you disable Managed Service for OpenTelemetry for your ALB instance, Simple Log Service remains enabled. If you no long use Simple Log Service, manually disable it.
If you are using Managed Service for OpenTelemetry, disabling Simple Log Service causes service unavailability. Proceed with caution.
After you disable Managed Service for OpenTelemetry for all listeners of your ALB instance, ALB no longer delivers trace data to Managed Service for OpenTelemetry.
Prerequisites
An ALB instance is created, and a server group is created for the ALB instance. For more information, see Create an ALB instance and Create and manage server groups.
A listener is created for the ALB instance, and the listener is associated with the server group. For more information, see Add an HTTP listener.
Elastic Compute Service (ECS) instances are added to the ALB instance as backend servers. NGINX applications are deployed on the ECS instances, and the ECS instances are added to the server group.
For more information about how to create an ECS instance, see Create an instance by using the wizard.
For Information about deploying the NGINX service, see Deploy an LNMP stack.
For more information about how to add backend servers to a server group, see Add backend servers.
The following code block shows how to deploy applications on an ECS instance:
Step 1: Enable Managed Service for OpenTelemetry
- Log on to the ALB console.
In the top navigation bar, select the region where the ALB instance resides.
On the Instances page, click the ID of the ALB instance that you want to manage.
On the Listener tab, click the ID of the listener that you want to manage.
On the Listener Details tab, turn on Tracing in the Tracing section.
In the Enable Tracing dialog box, configure the parameters.
Parameter
Description
Activate Service
NoteIf Managed Service for OpenTelemetry is activated in your Alibaba Cloud account, skip this step.
Activate Managed Service for OpenTelemetry
Select the Terms of Service and activate Activate Managed Service for OpenTelemetry.
Create Access Log
NoteIf an access log exists, skip this step.
Project
Select the Simple Log Service project that you want to use to isolate and manage resources.
Select Project: Select an existing project from the drop-down list.
Create Project: Enter a project name in the field.
Logstore
Select the Logstore that you want to use to collect, store, and query log data in Simple Log Service.
Select Logstore: Select an existing Logstore from the drop-down list.
Create Logstore: Enter a Logstore name in the field. If you select Create Project, you must also select Create Logstore.
Configure Tracing
Tracing Type
Select a type of tracing.
The default value is Xtrace, which specifies Managed Service for OpenTelemetry is activated and enables tracing.
Sampling Rate
Valid values: 1 to 100. Default value: 100.
Adjust the sampling rate to specify the number of traces that you want to report.
Notes on Creating Service-linked Role
When you perform this operation, the system automatically creates service-linked roles. ALB assumes the roles to implement features.
Step 2: View trace data
Log on to a terminal to test the network connectivity between the client and server. For more information, see Use an ALB instance to provide IPv4 services and Use ALB to balance loads for IPv6 services.
- Log on to the ALB console.
On the Instances page, click the ID of the ALB instance that you want to manage.
On the Listener tab, click the ID of the listener that you want to manage.
In the Tracing section of the Listener Details tab, click View to the right of Trace Analysis to go to the Managed Service for OpenTelemetry console.
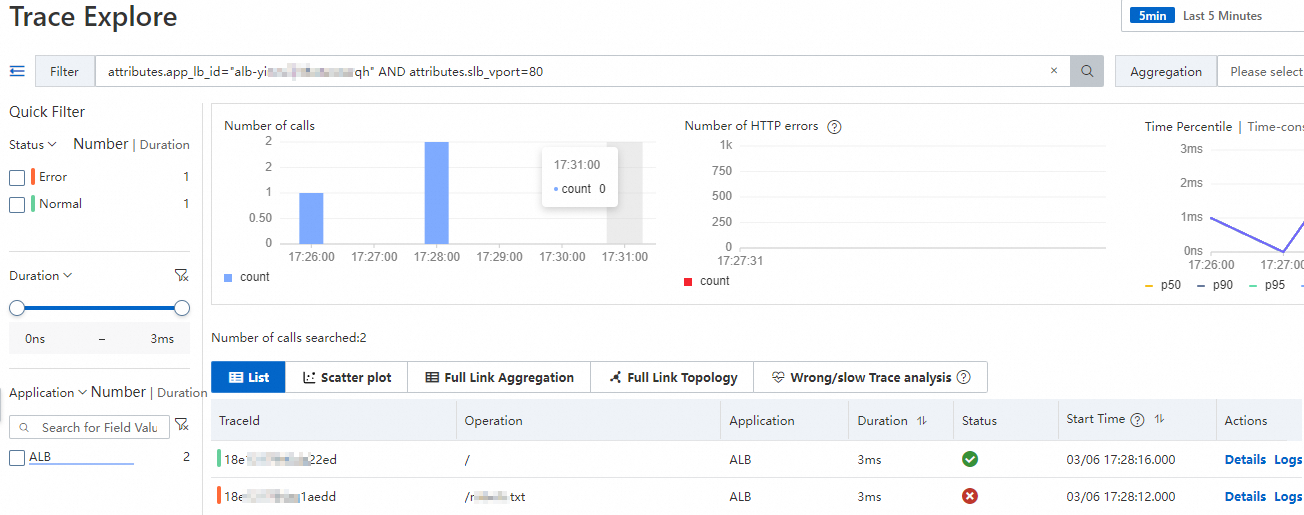
On the Trace Explorer page, you can analyze trace data of requests sent to the backend applications of the ALB instance, including the traces, number of calls, and full-link aggregation. For more information, see Analyze traces.