Full-stack Observability is an application provided by Alibaba Cloud Simple Log Service. It enables end-to-end observability of IT systems, including monitoring, tracing, and alerts. Multiple resources, including ECS instances, Kubernetes clusters, databases, and middleware are supported.
Alibaba Cloud Observability Suite (ACOS) is a native observability suite announced by Alibaba Cloud. It is composed of Managed Service for Prometheus, Managed Service for Grafana, and Managed Service for OpenTelemetry.
ACOS facilitates the standardization of all Alibaba Cloud Managed Service products through open standards, achieves comprehensive standardization of linked data, connects with the observable data assets of enterprise stock, and integrates seamlessly with the Alibaba Cloud application hosting platform.
The suite offers extensive coverage of scenarios including User Experience Management (UEM), Application Performance Monitoring (APM), cloud service monitoring, cost management, and emergency collaboration efficiency. This enables companies to efficiently build open, high-quality, and low-cost unified observation systems.

Full-stack Observability is a one-stop observability solution based on OpenTelemetry. OpenTelemetry is an observability framework, a toolkit designed to create and manage telemetric data such as tracing, metrics, and logs.
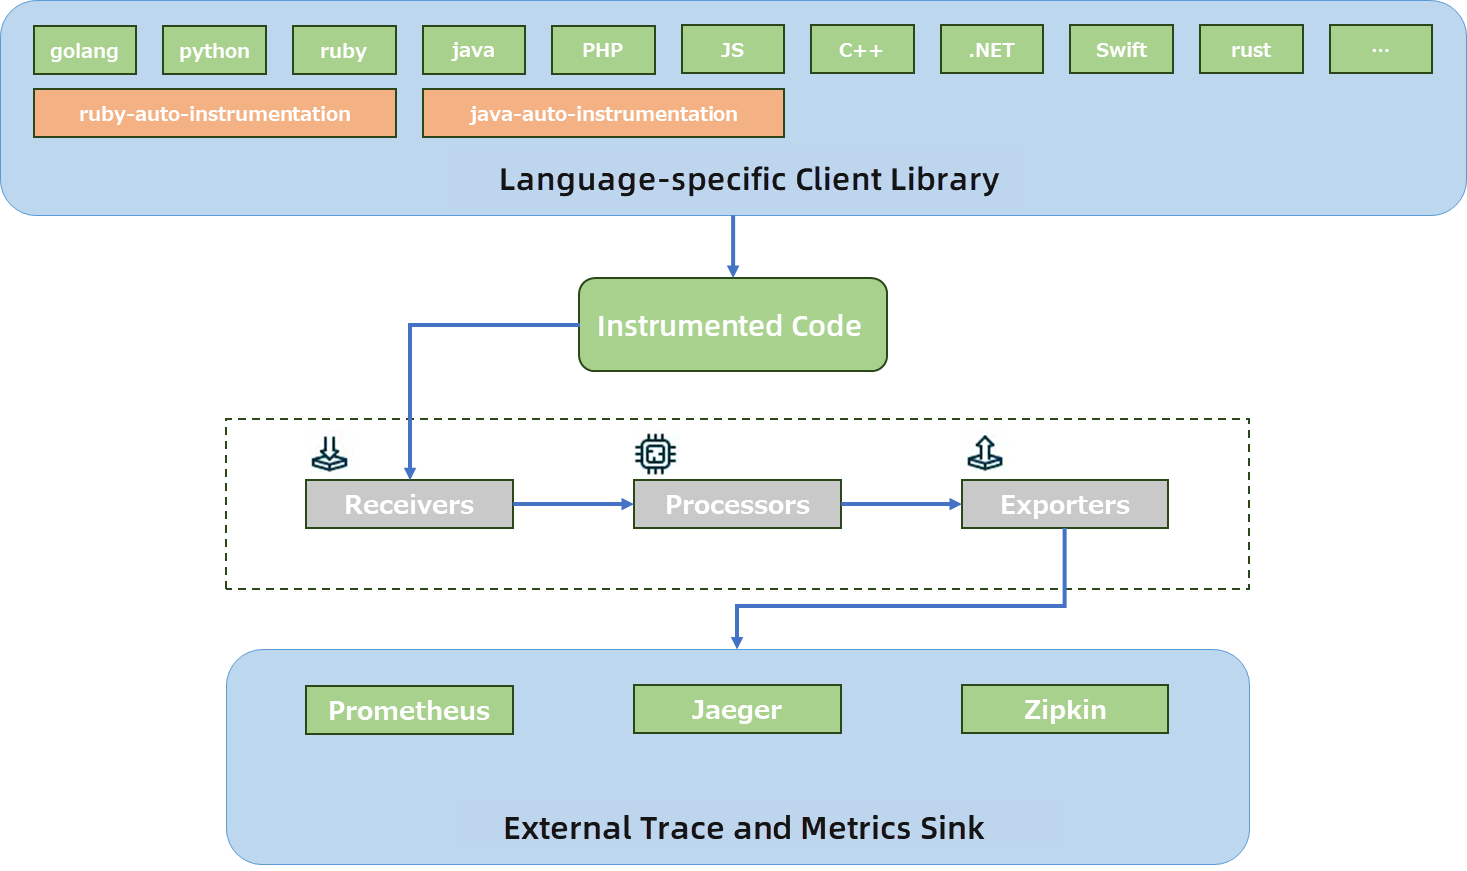
Enabling the Full-stack Observability application is free of charge. However, users are required to pay for the resources consumed or generated while utilizing the features provided by the application.
Related Reading:
Precautions for use: https://www.alibabacloud.com/help/en/log-service/latest/full-stack-observability-usage-notes
For a Full-stack Observability instance, Trace and Full-stack Monitoring applications can be used.
After configuring the data import of the prepared ECS instances and the ACK-only cluster, you can use the resource information and monitoring data on the full-stack observability instance.
All resources involved in this article are created in the Japan (Tokyo) region.
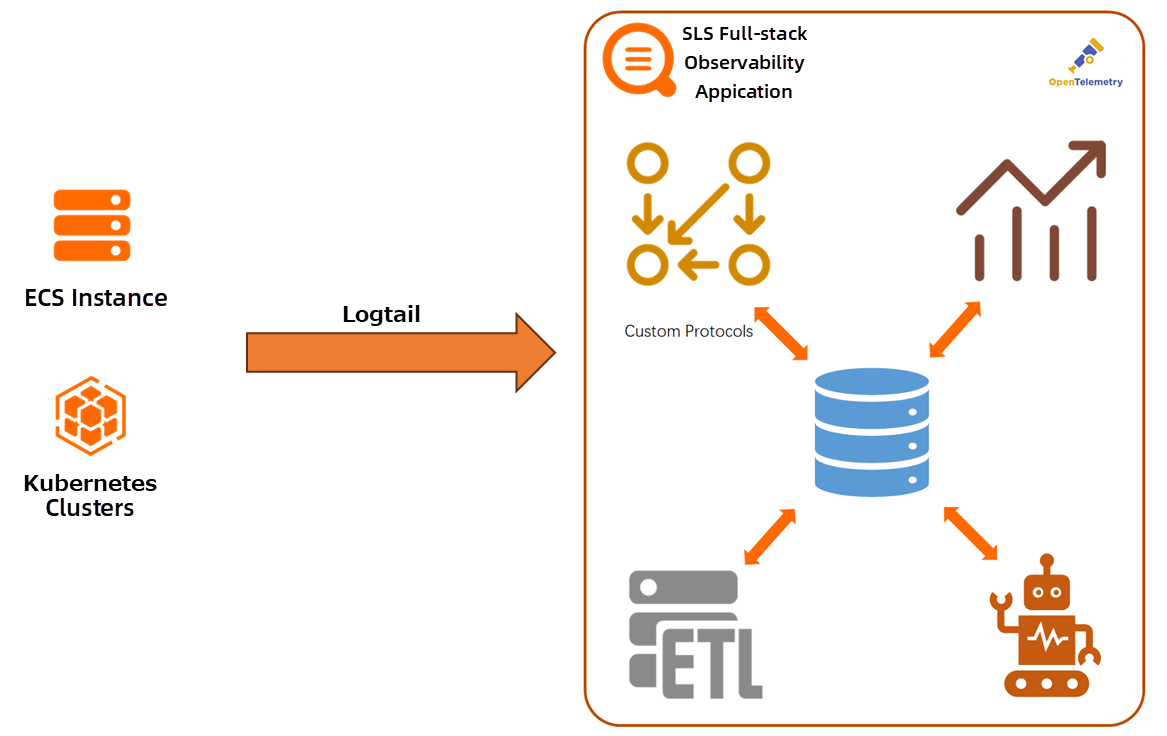
From the Simple Log Service homepage, select the Full-stack Observability application and enter its management page.

Alibaba Cloud provides a demonstration of a configured Full-stack Observability application. You can check the details in this demo before using the service in the production environment.
Click View Sample and go to the details page of the sls-mall demo project.

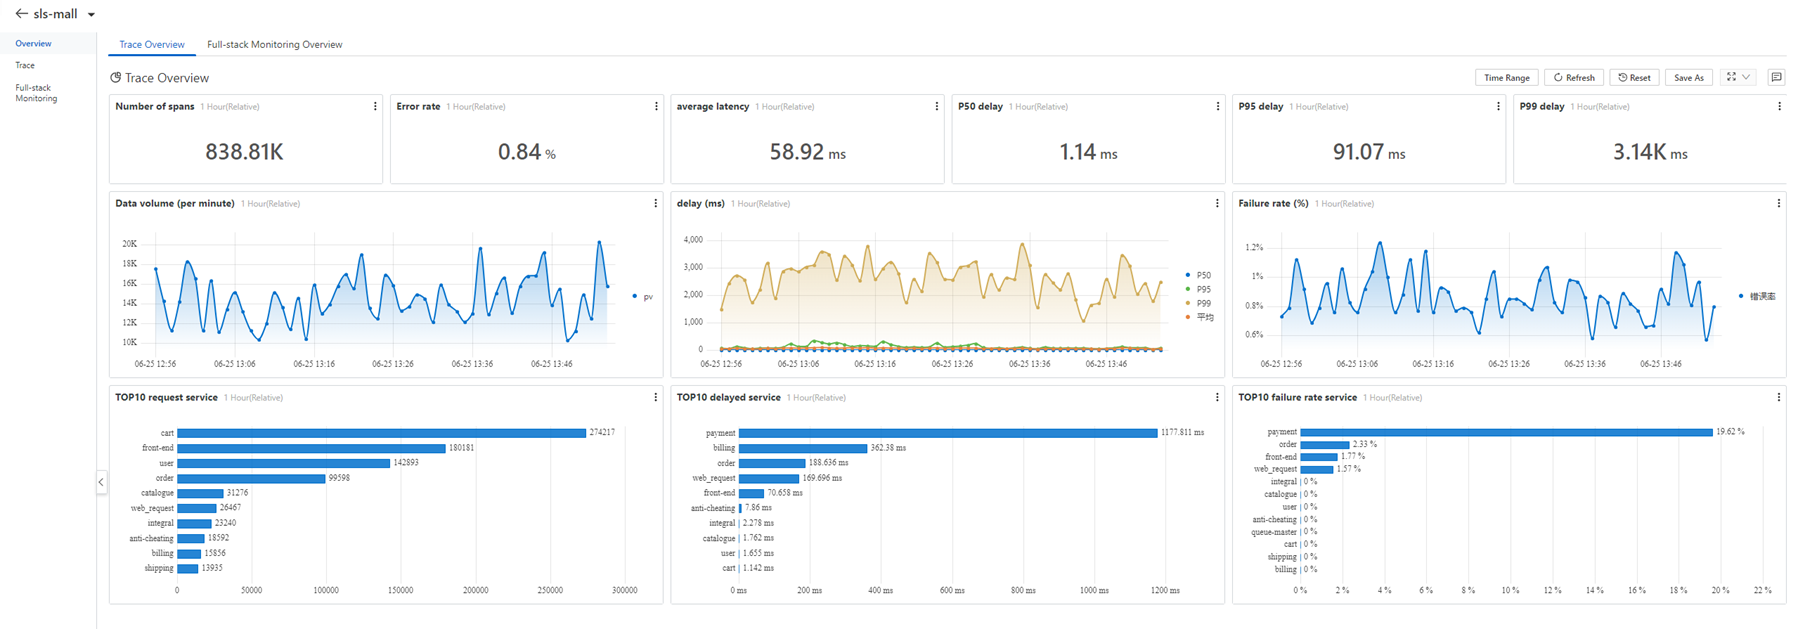
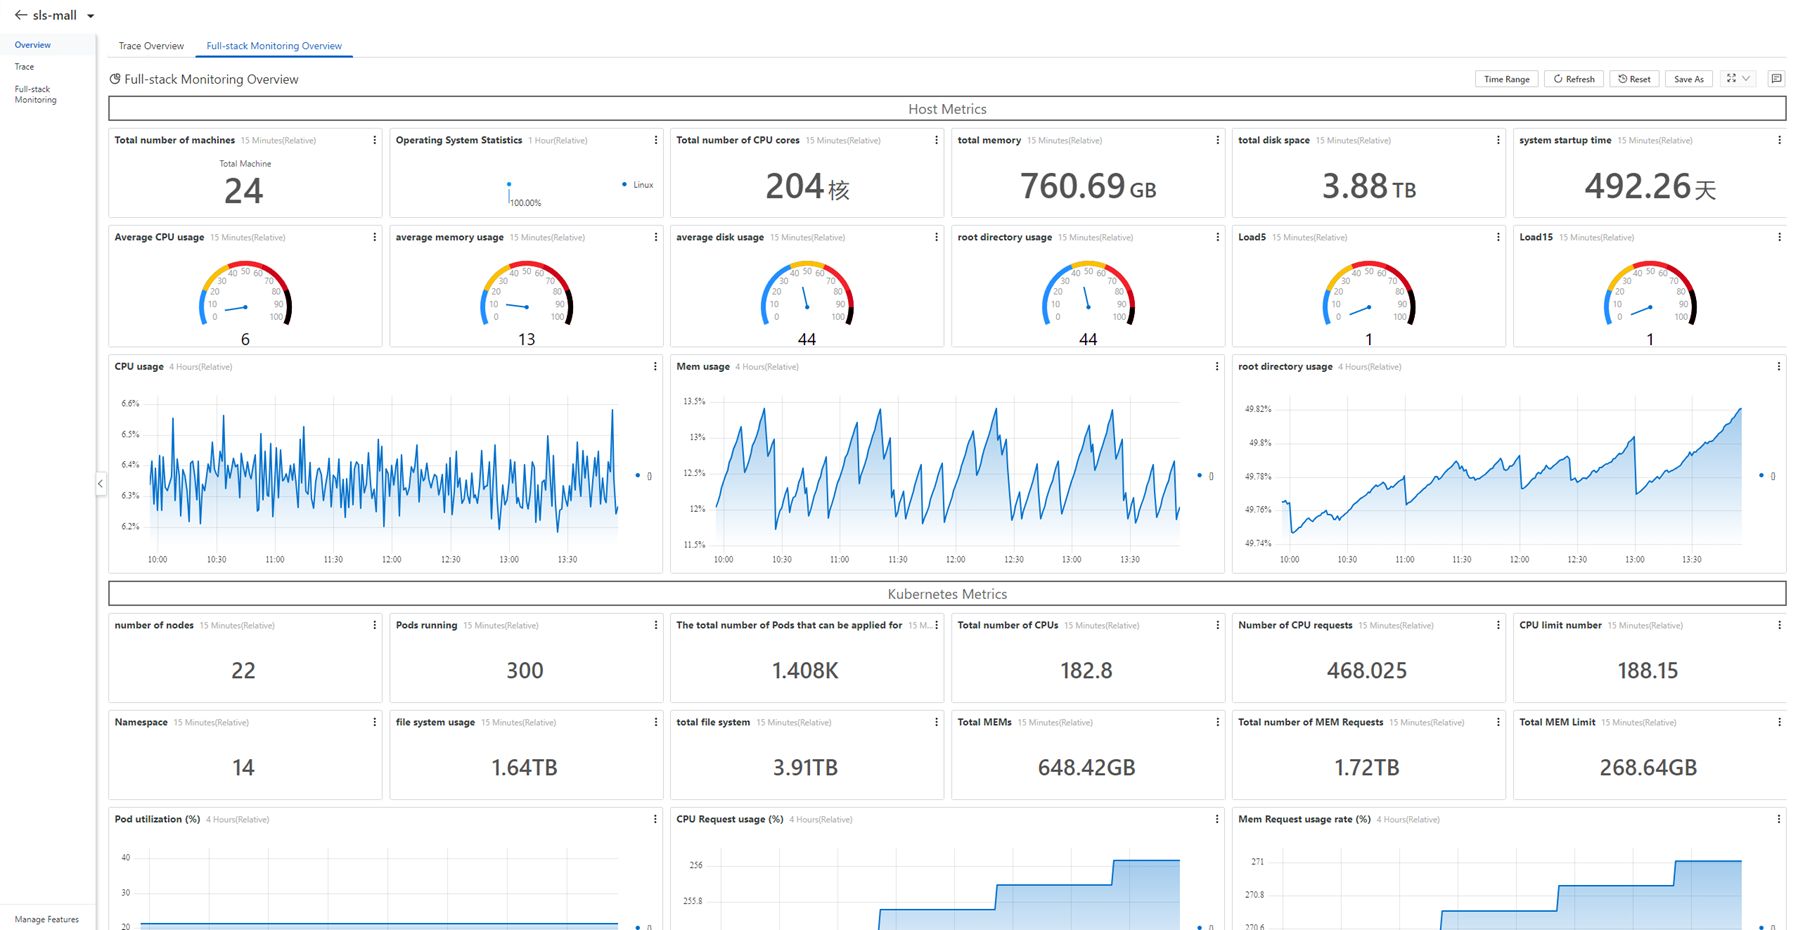
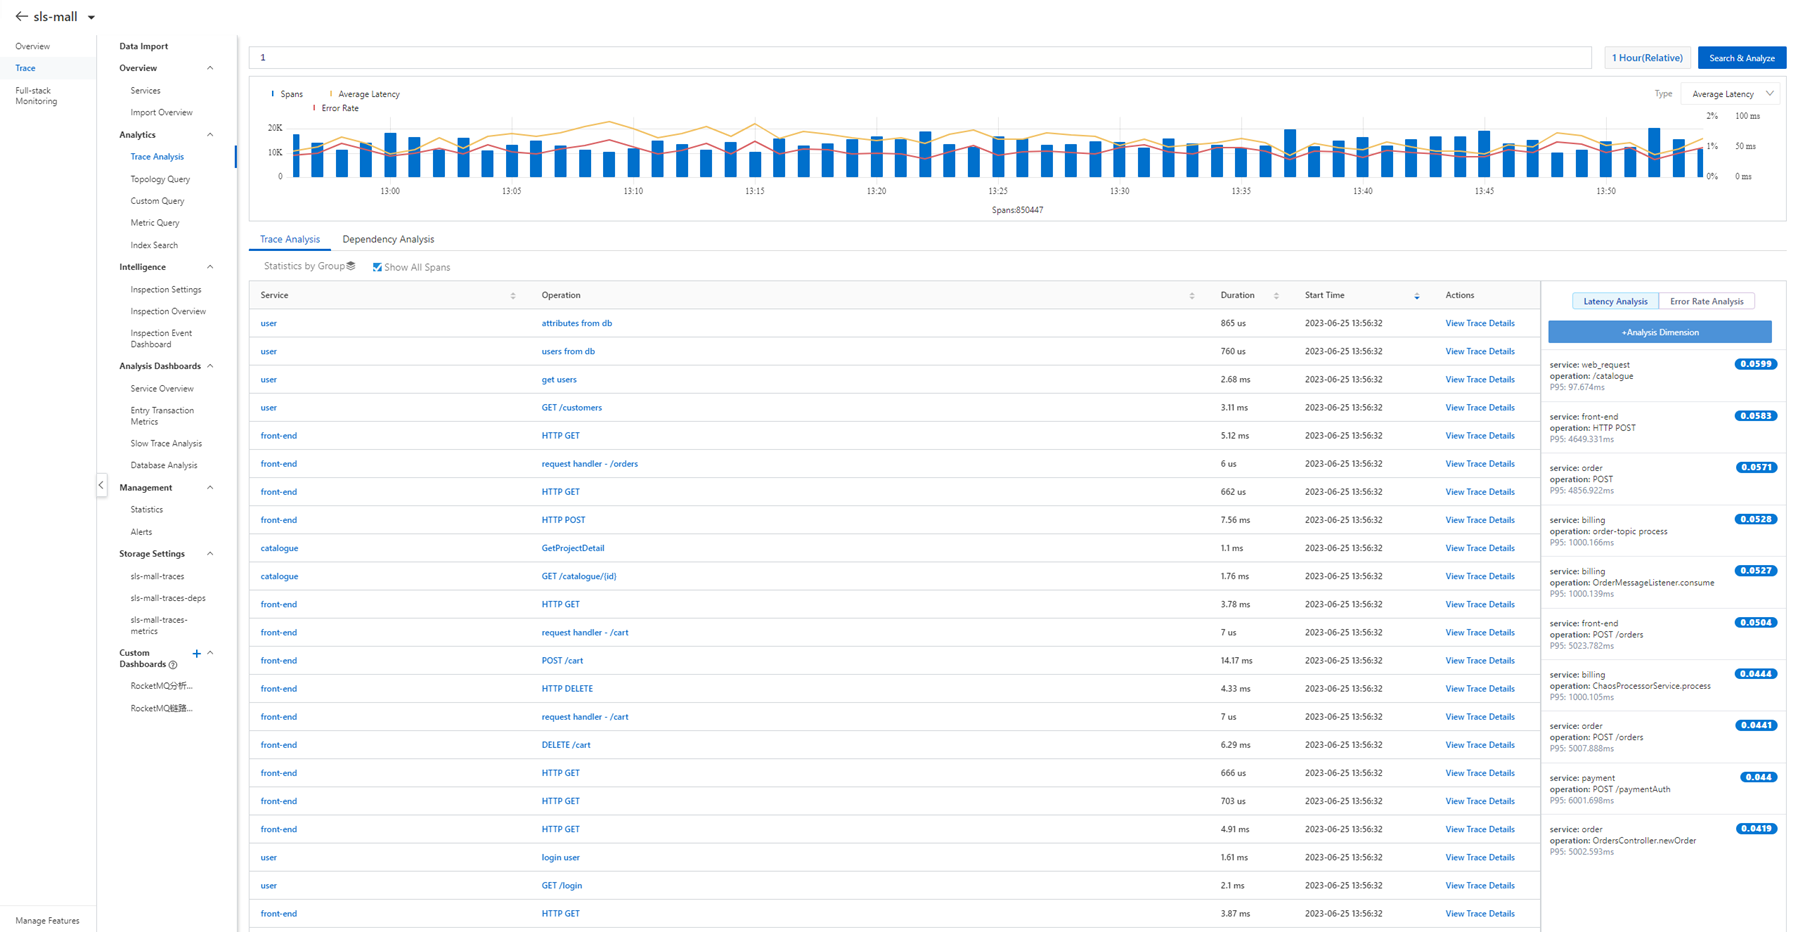
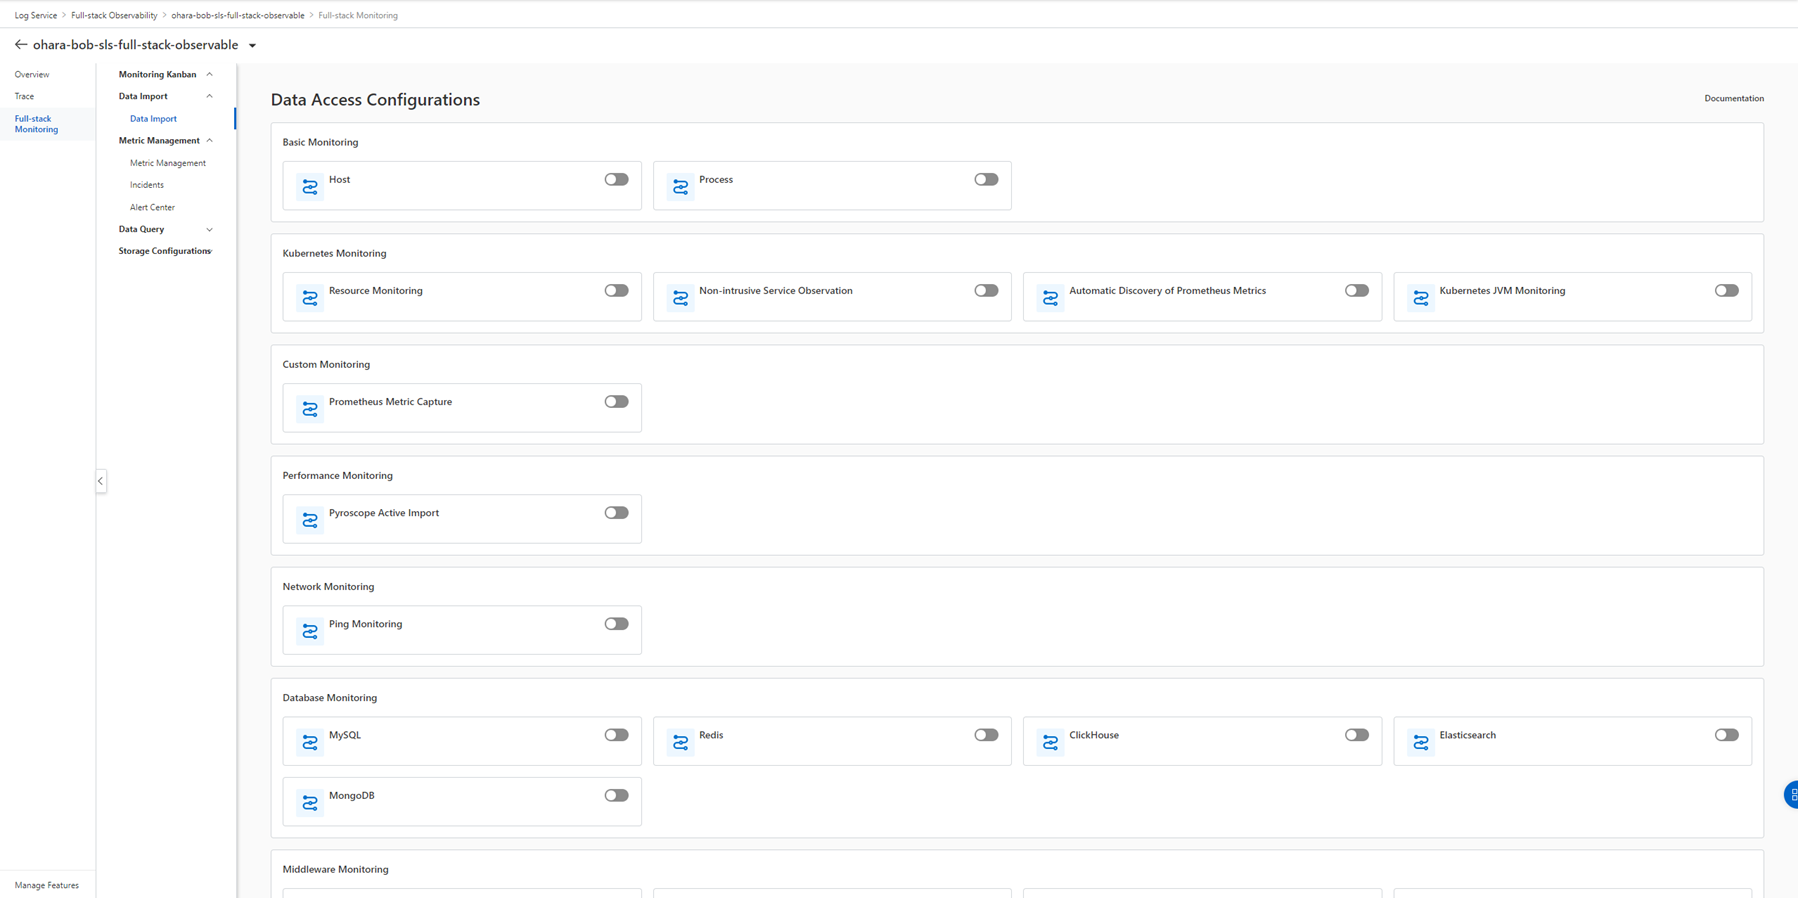
From the Data Access Configurations page, you can see that the demo application contains almost all supported resource types.
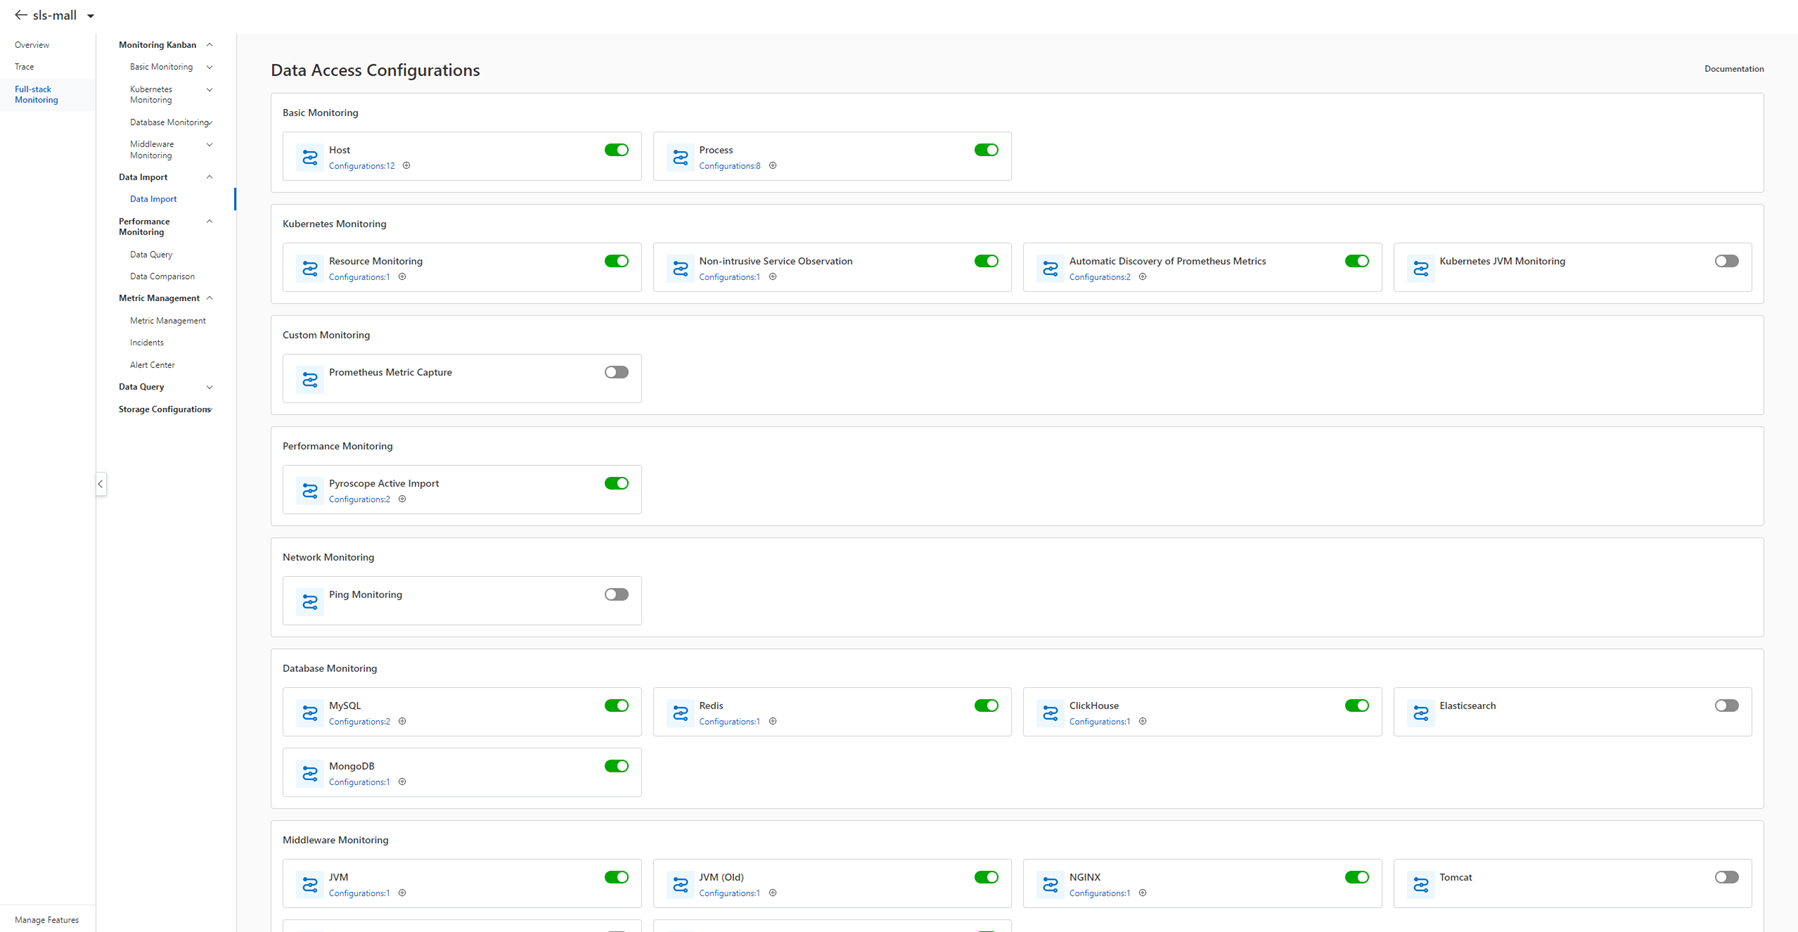
Click Create Instance to start the process.

Enter the required information into the creation form. If you do not have a Simple Log Service project, you can create a new one from the pop-up window. Make sure that the project resides in the same region as the resource.
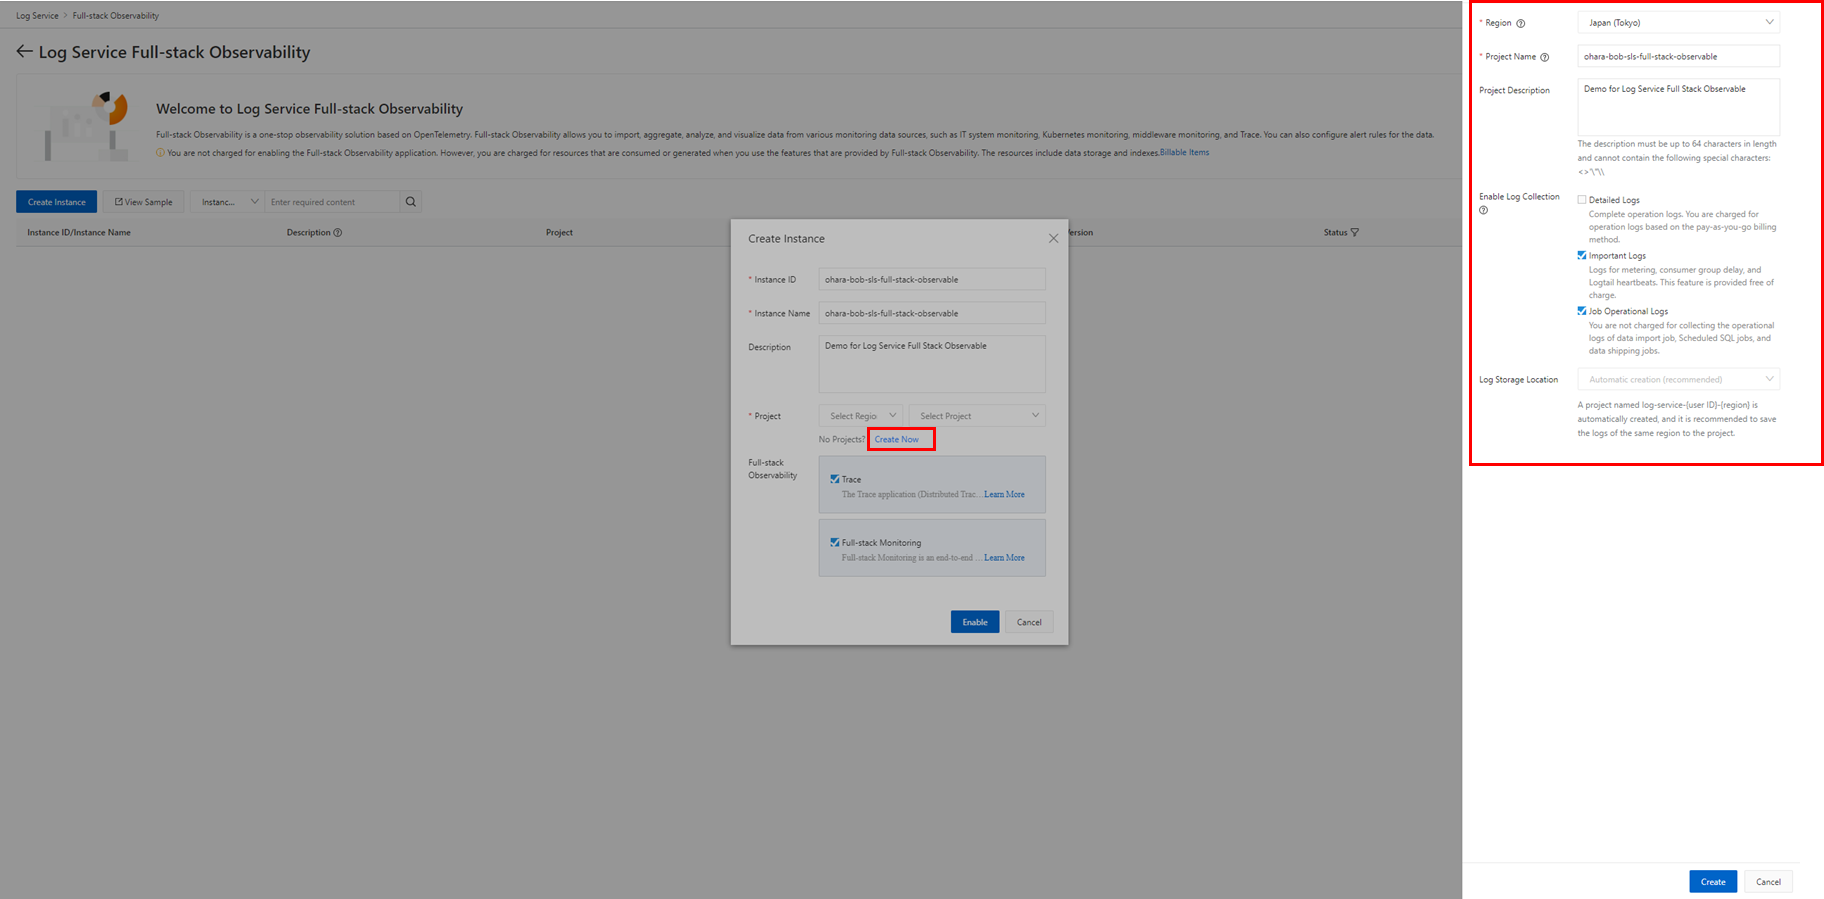
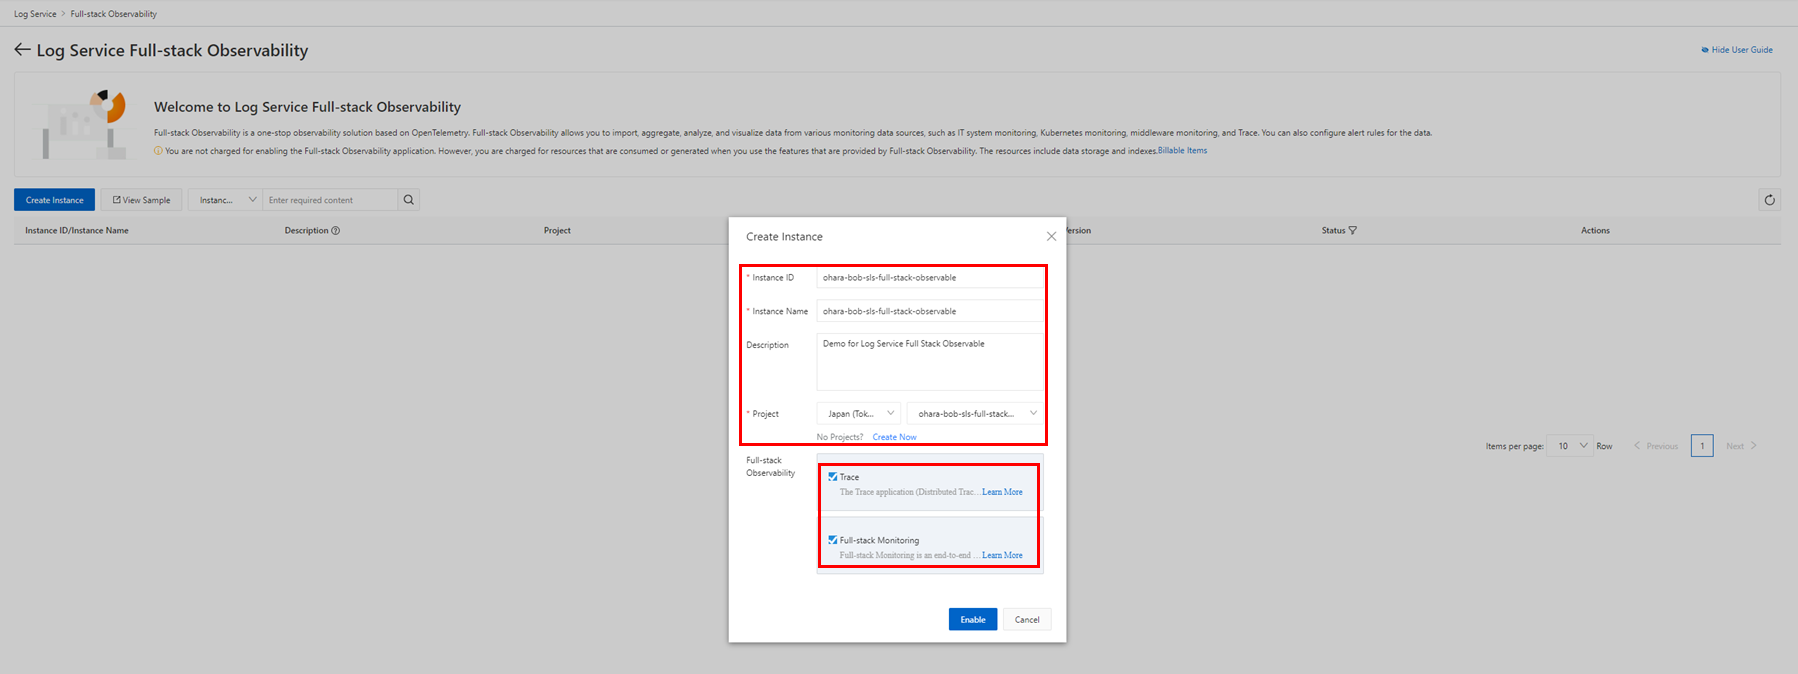
Enable both Trace and Full-stack Monitoring features during the creation process. When finished, the created Full-stack Observability instance appears in the list with the success message.

Related Logstores are automatically created in the combined project. They are used to store collected monitoring data.

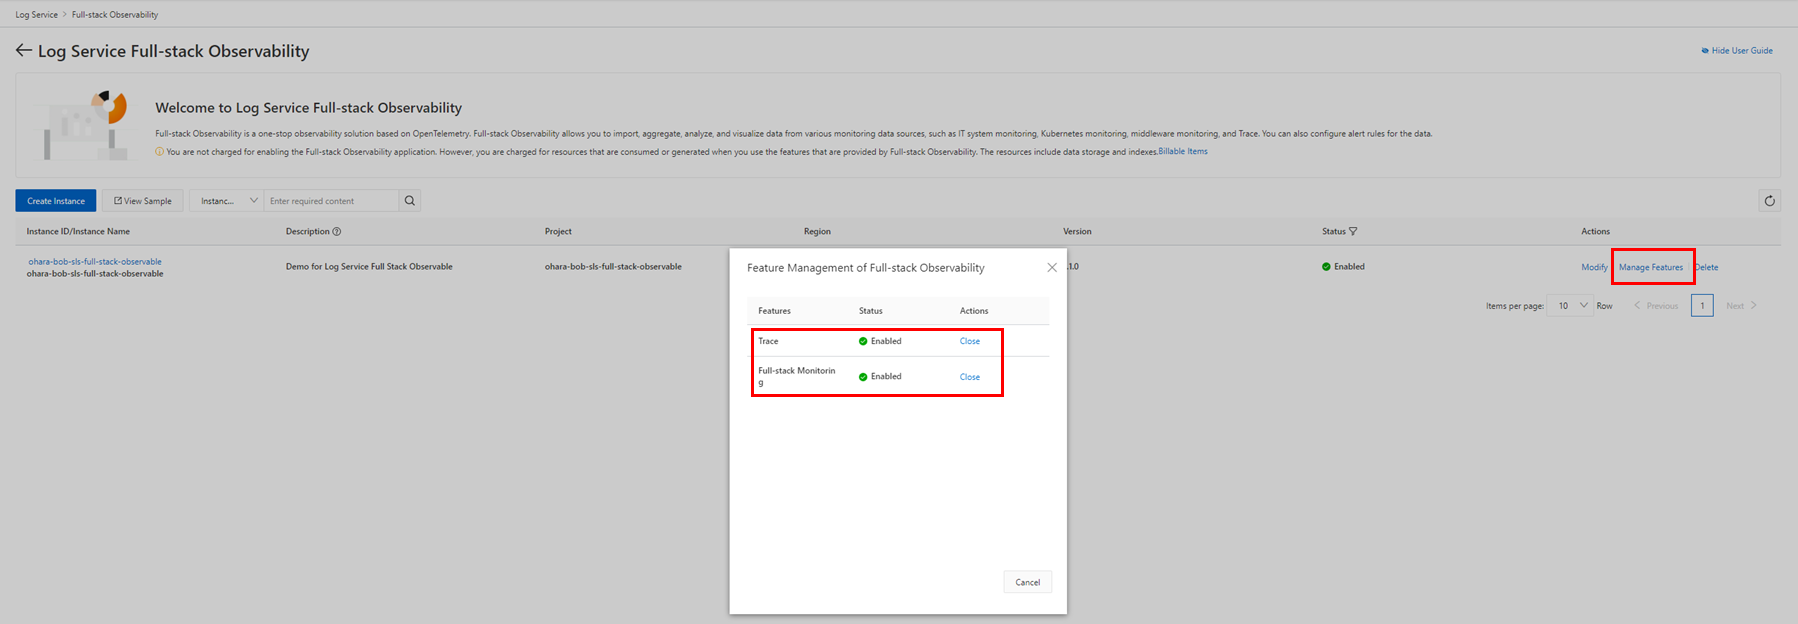
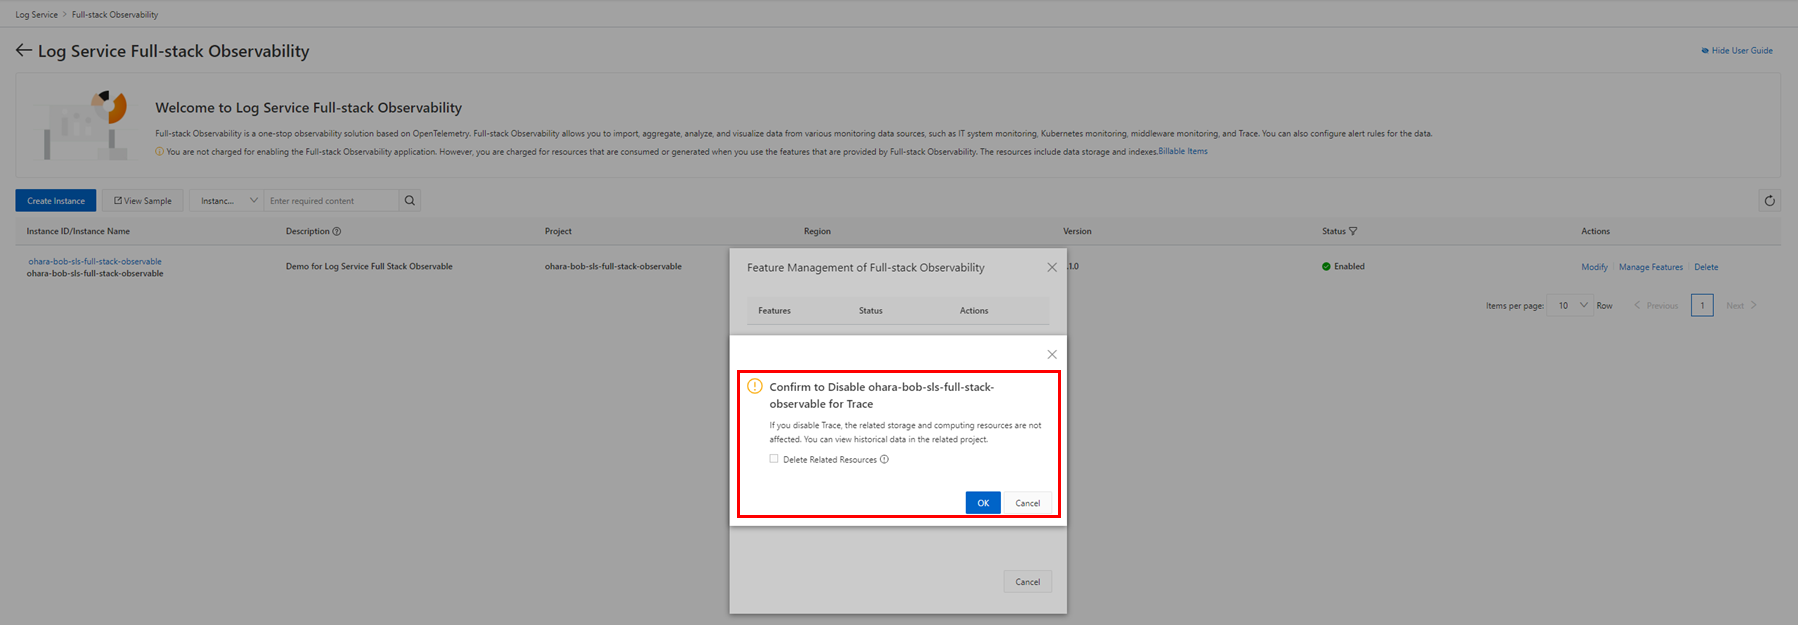
Also, after creating an instance, click Manage Features to manage the enabled features. Features can be enabled or disabled in the pop-up window.
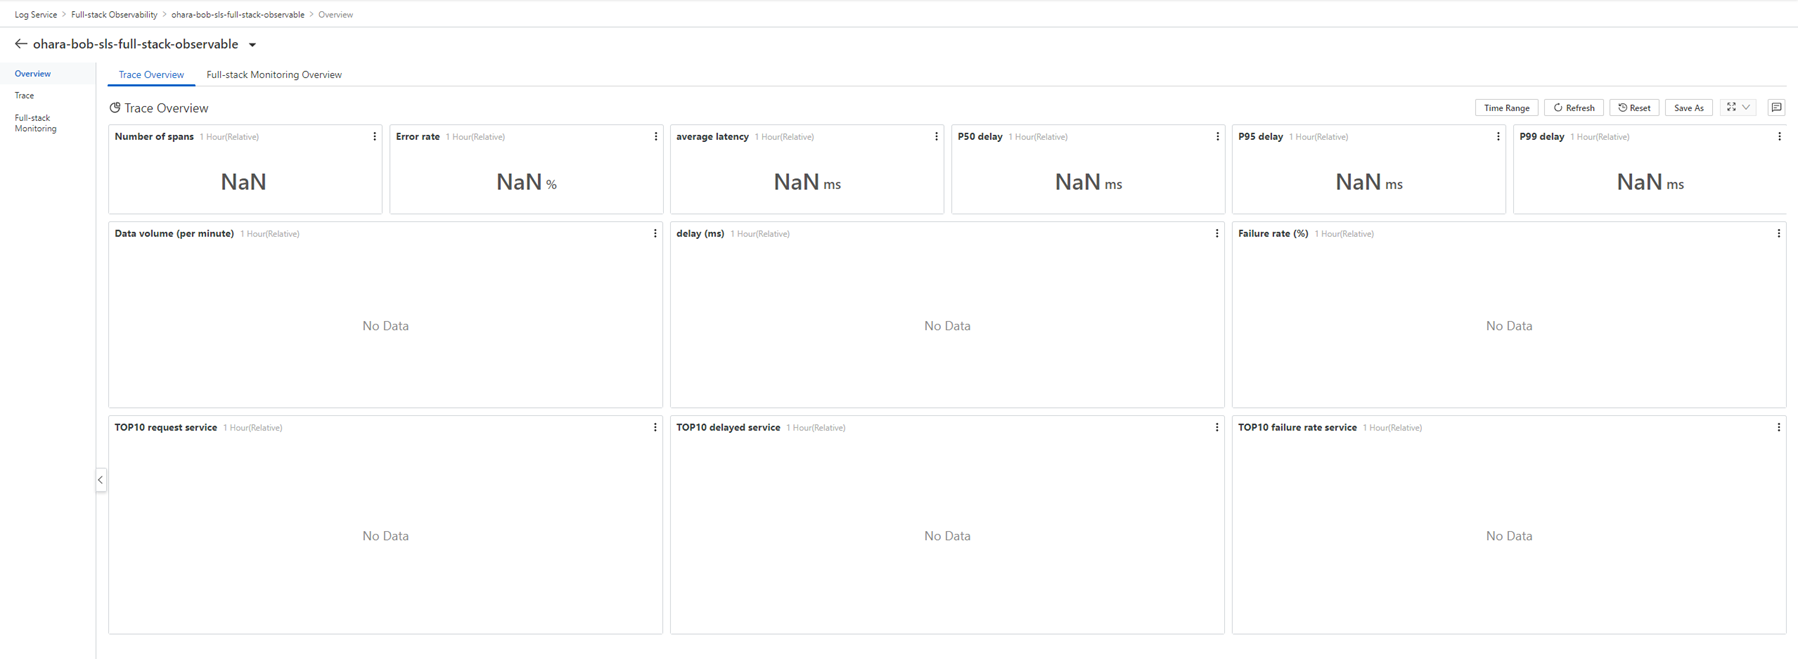
The dashboard is empty because there is no monitoring data and resources.
ECS instances can be organized as hosts for Full-stack Observability instances.
Related Reading:
Collection of monitoring data from the host: https://www.alibabacloud.com/help/en/log-service/latest/collect-monitoring-data-from-hosts
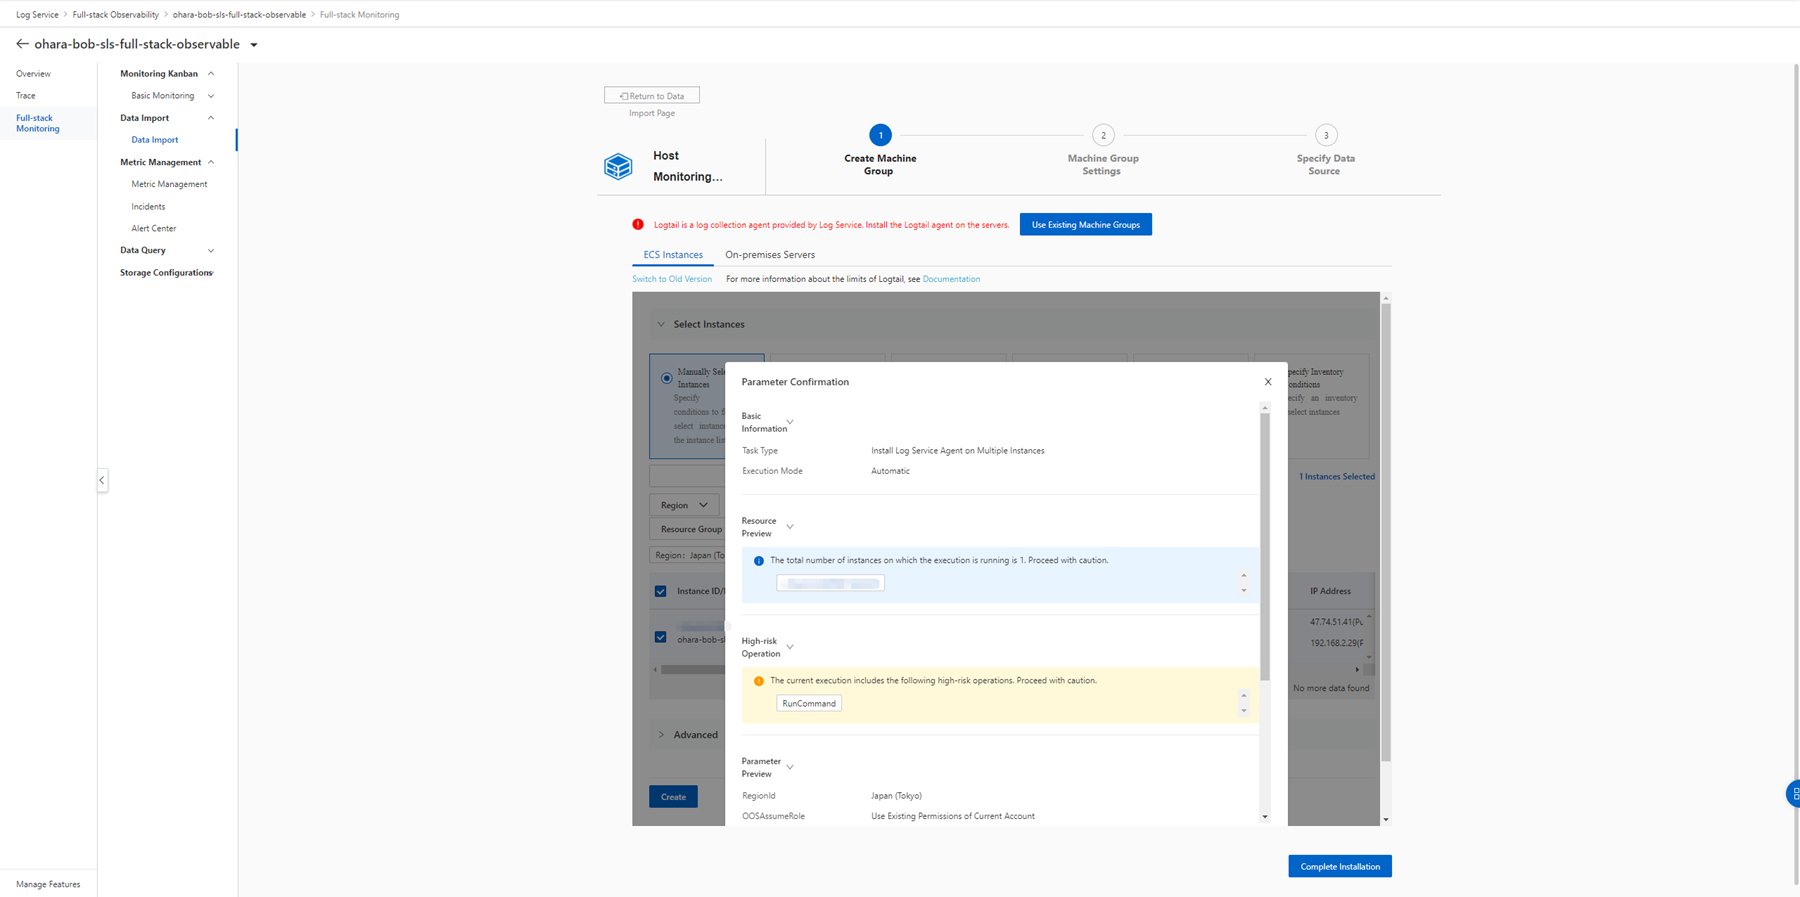
Create an ECS instance in the Japan (Tokyo) region.
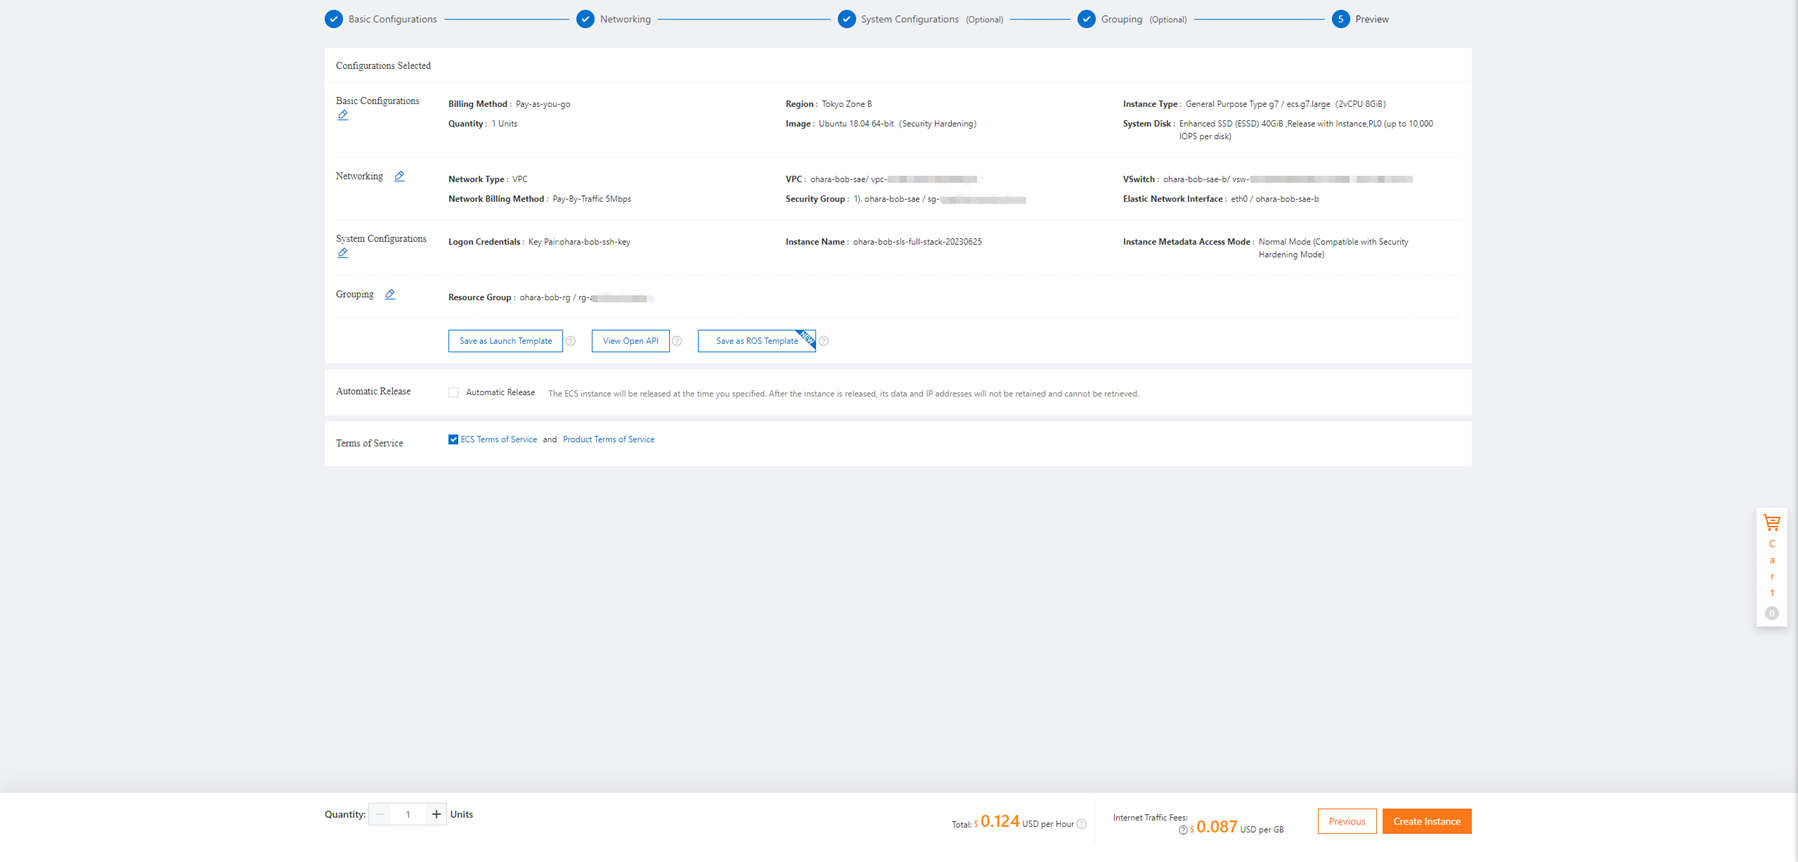

To collect monitoring data, you must configure data access on the destination resource. In the Host section, click the Enable icon to start the configuration process.
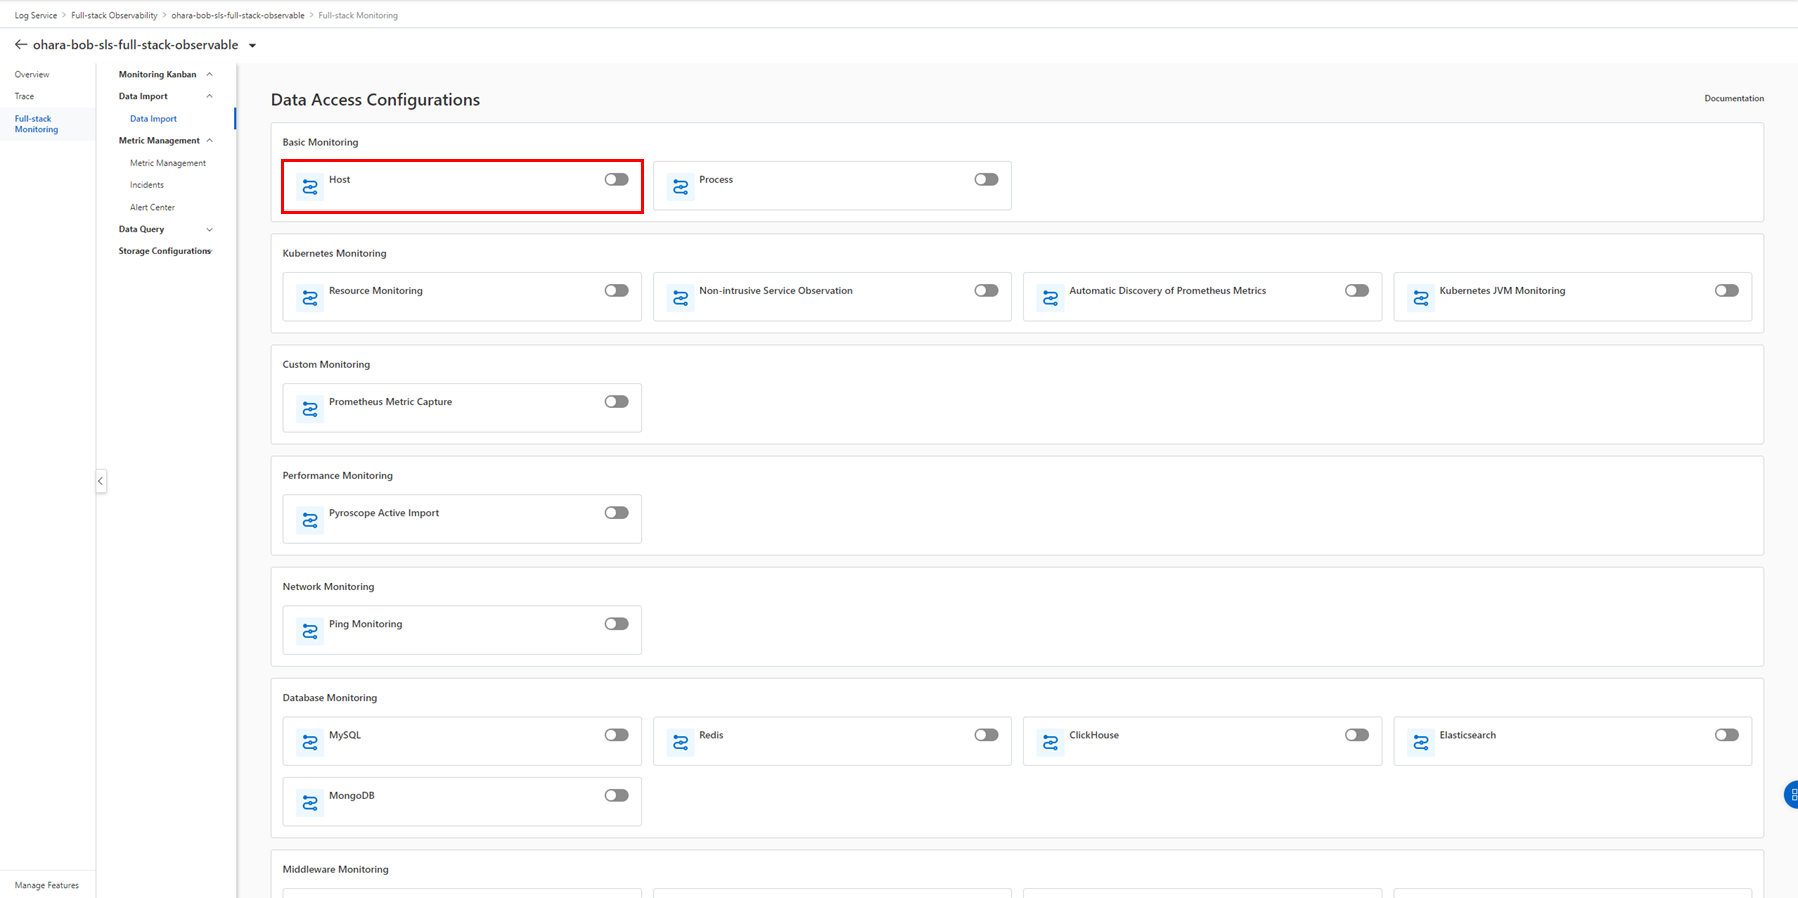
ECS instances are managed by Simple Log Service machine groups. If the instance to be used already belongs to a specific machine group, click Use Existing Machine Groups to skip the creation step.
There are many ways to filter existing ECS instances. Region, Status, and Resource Group can be used to find a prepared instance. Select the required instance and click Create to create a new machine group.
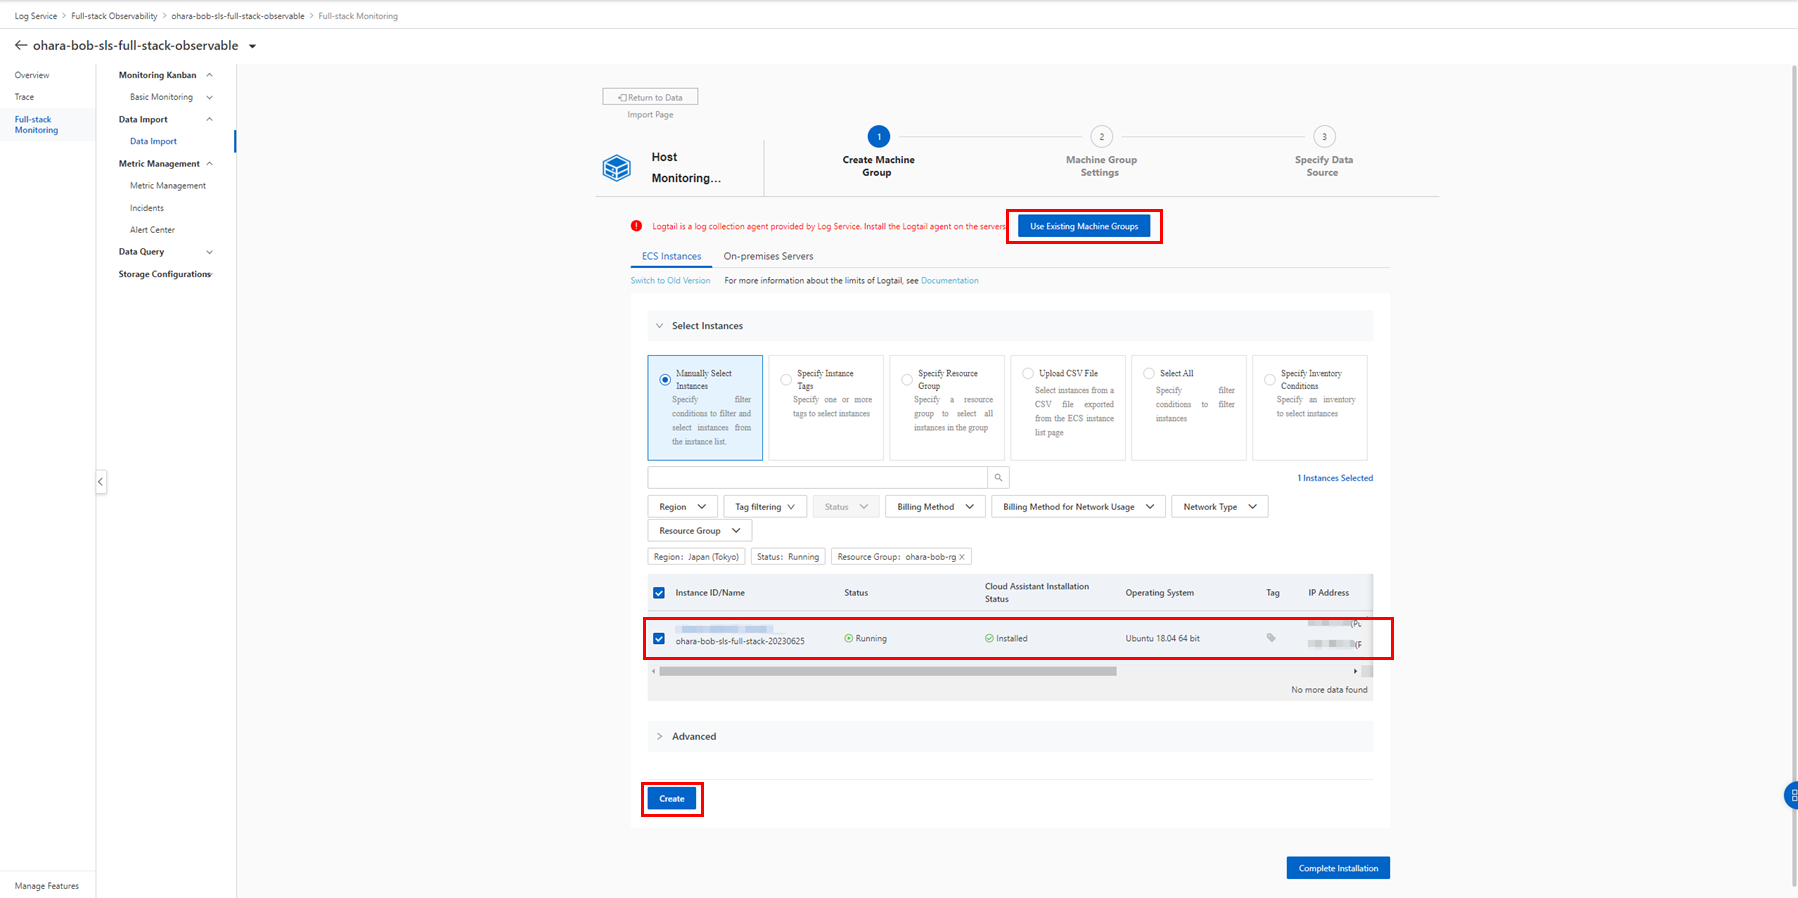
Review the information and click OK in the pop-up window. The system automatically installs Logtail in the ECS instance.
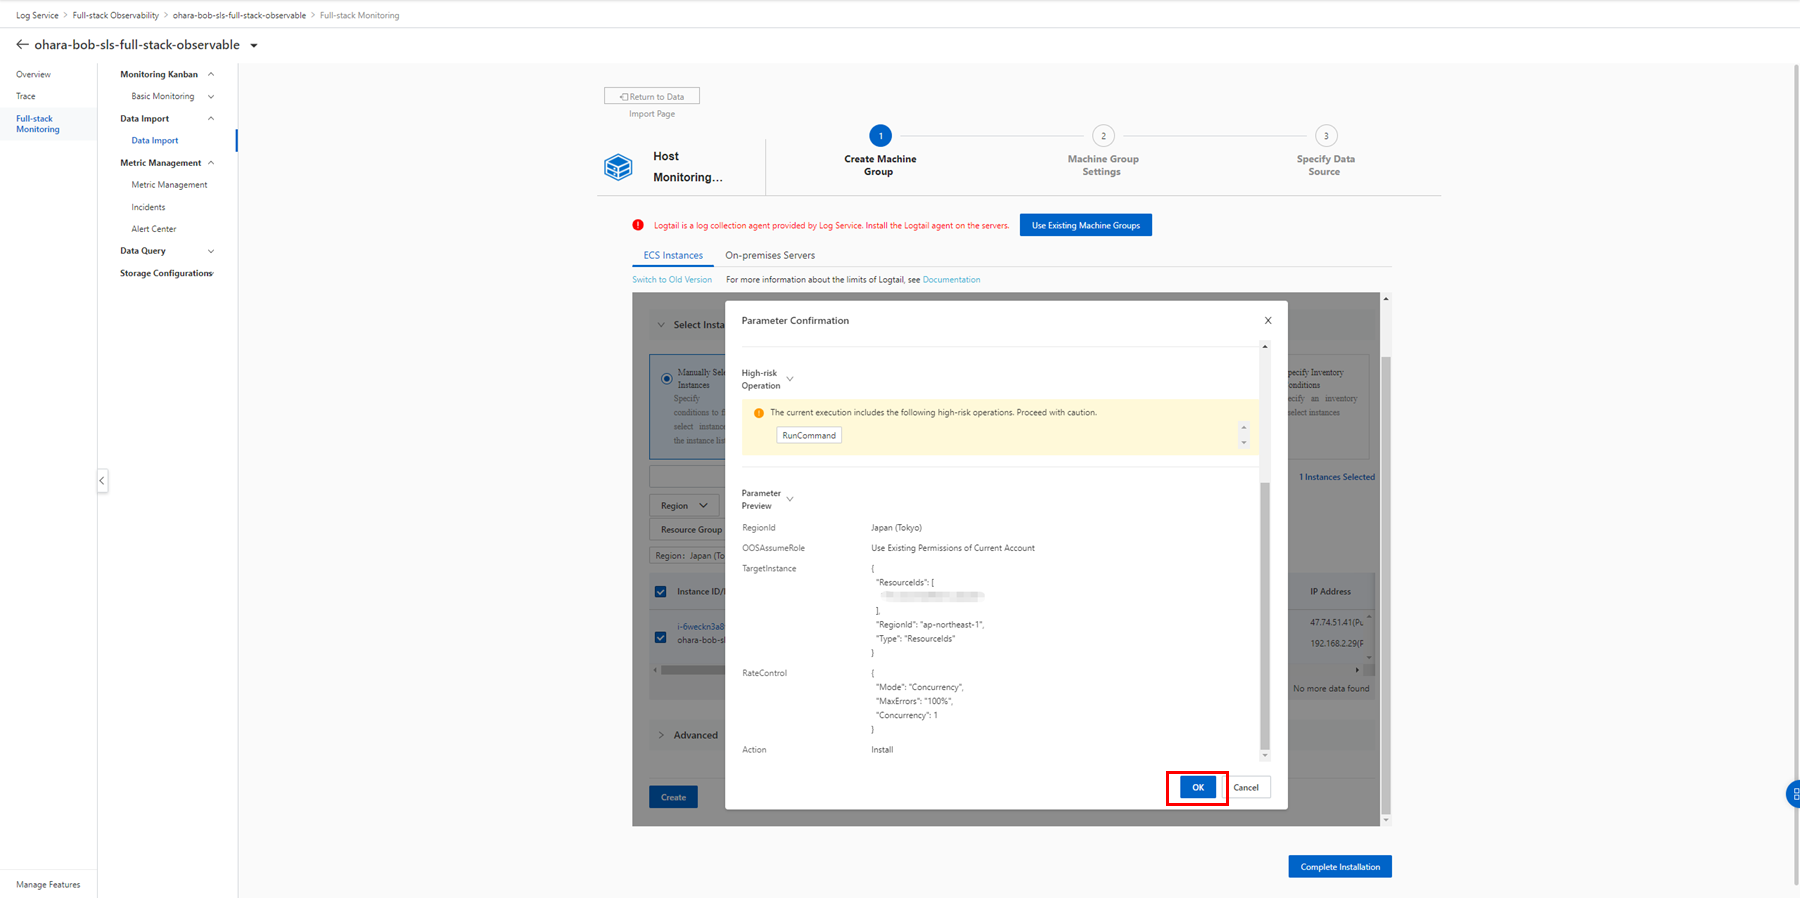
ECS instances within other Alibaba Cloud accounts, servers provided by other cloud platforms, or self-managed servers are not displayed in the instance list. In this case, please install Logtail manually.
Wait for the Logtail installation to complete. The results of the installation process are displayed. Then, click Complete Installation to continue to the next step.
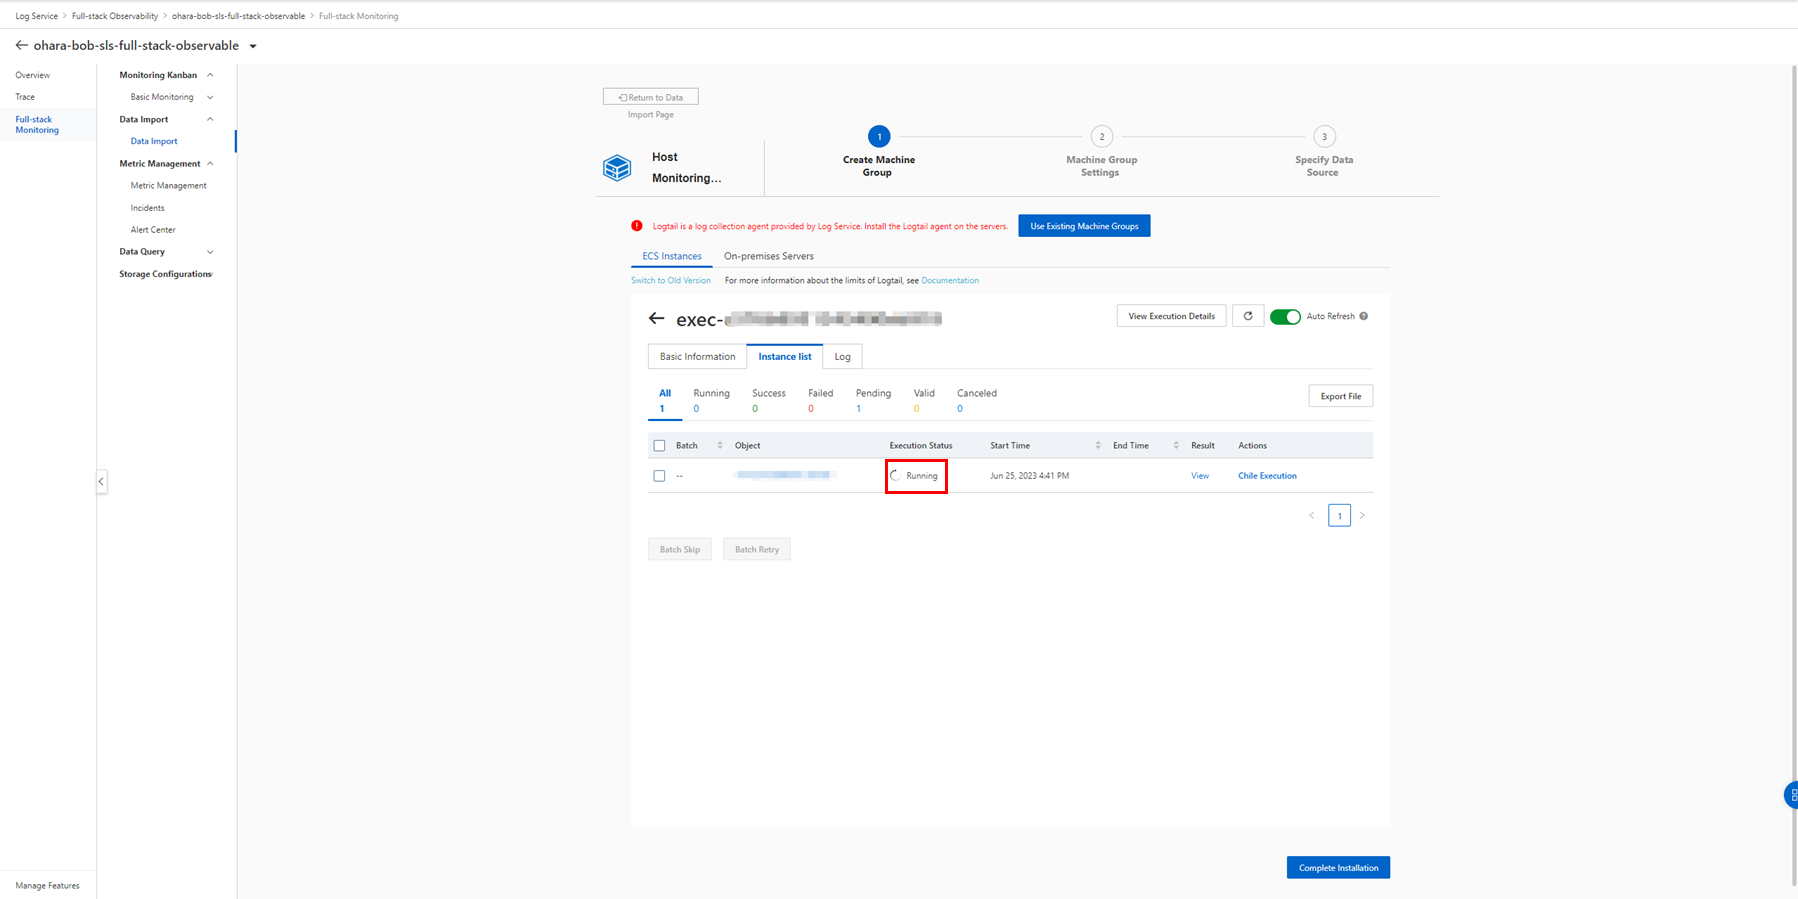
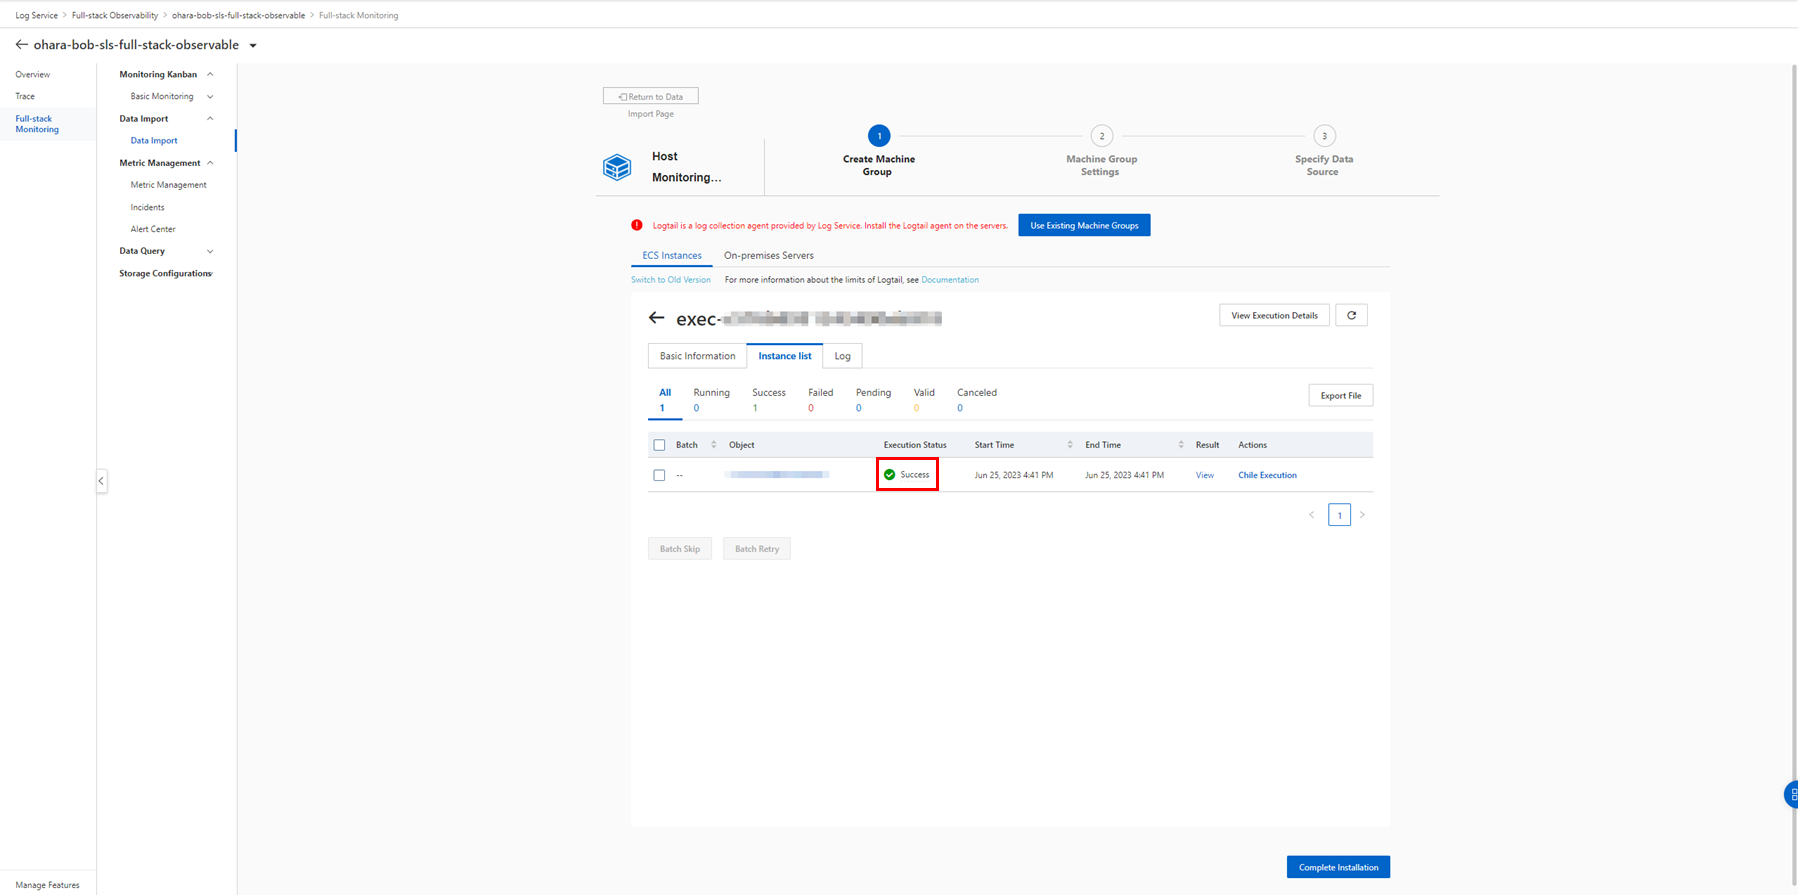
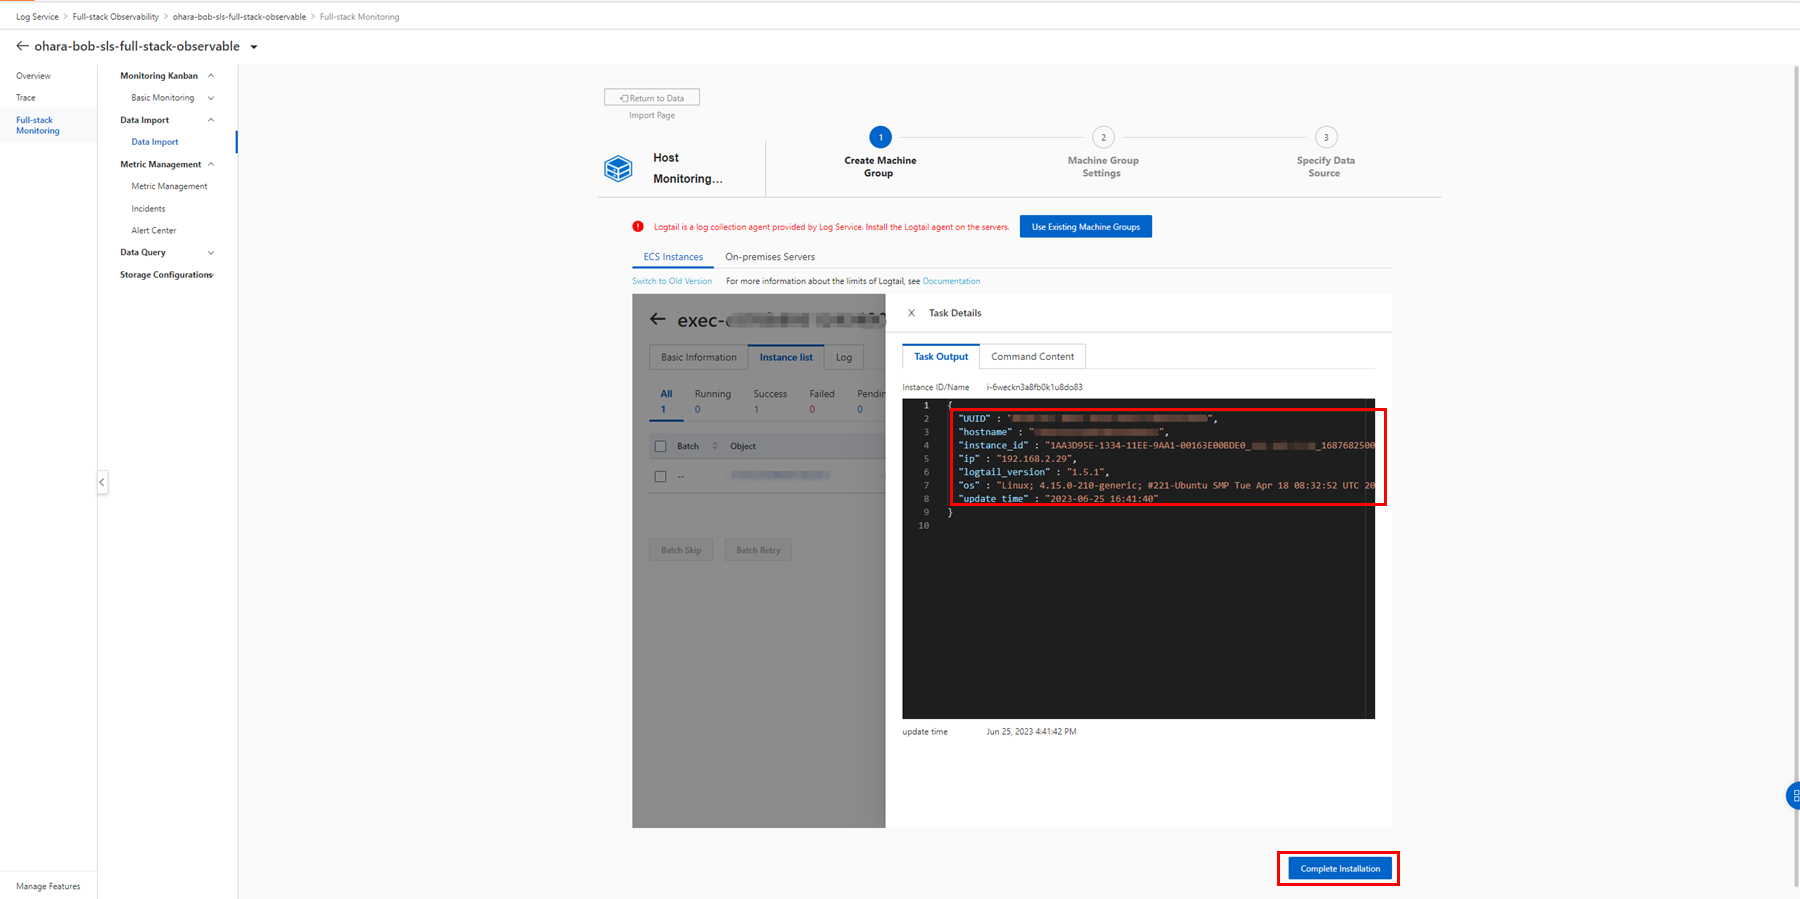
To identify a machine group, you can use both an IP address and a custom ID.

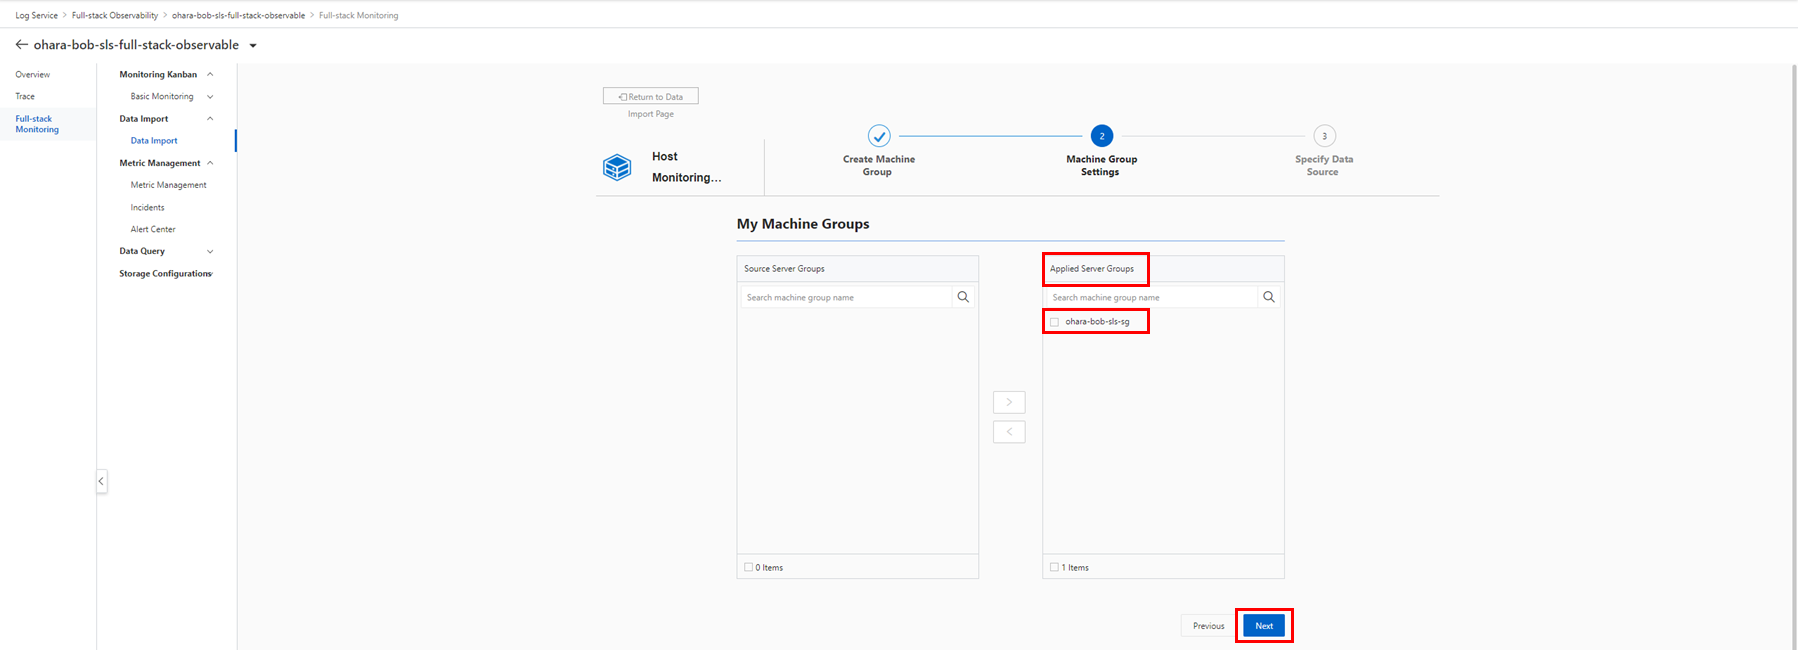
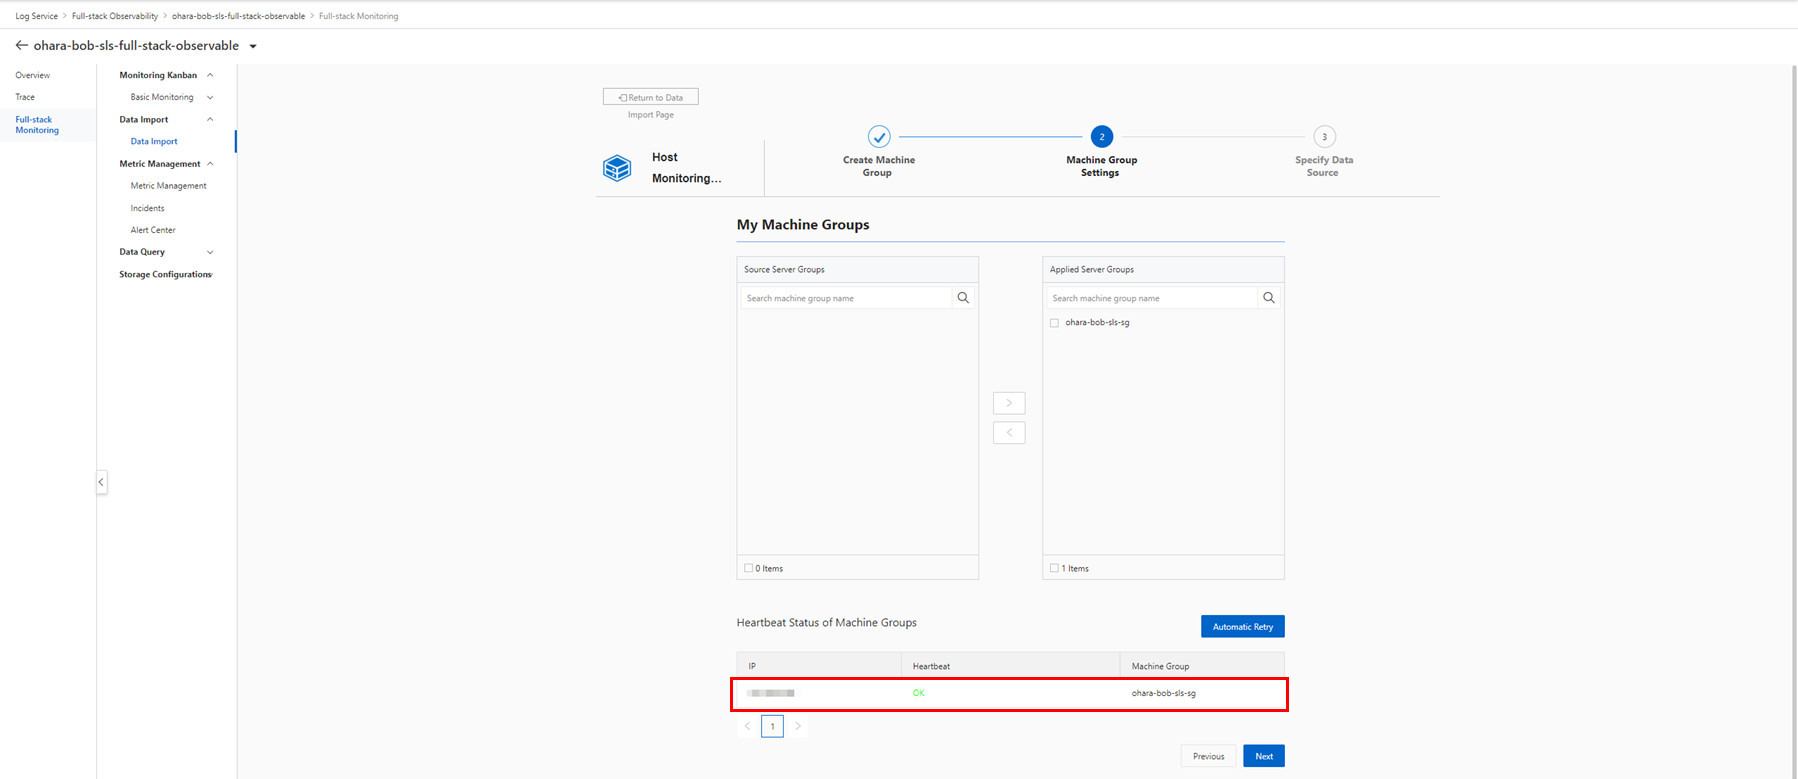
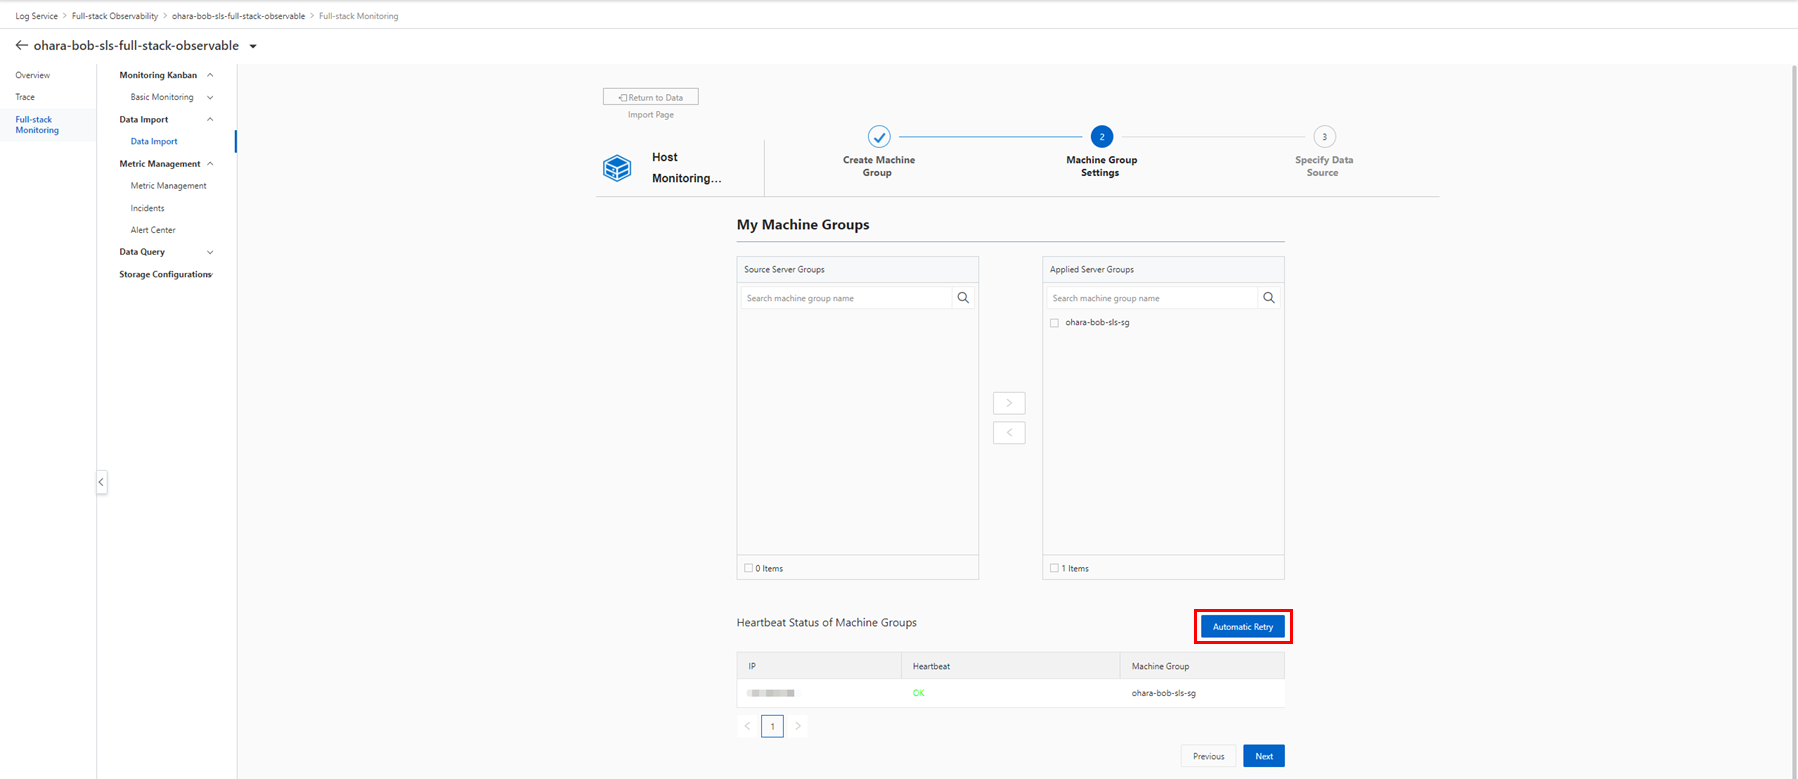
Move the created machine group or an existing machine group to Applied Server Groups. Then, click Next. The system checks the heartbeat of the installed Logtail in the step above.
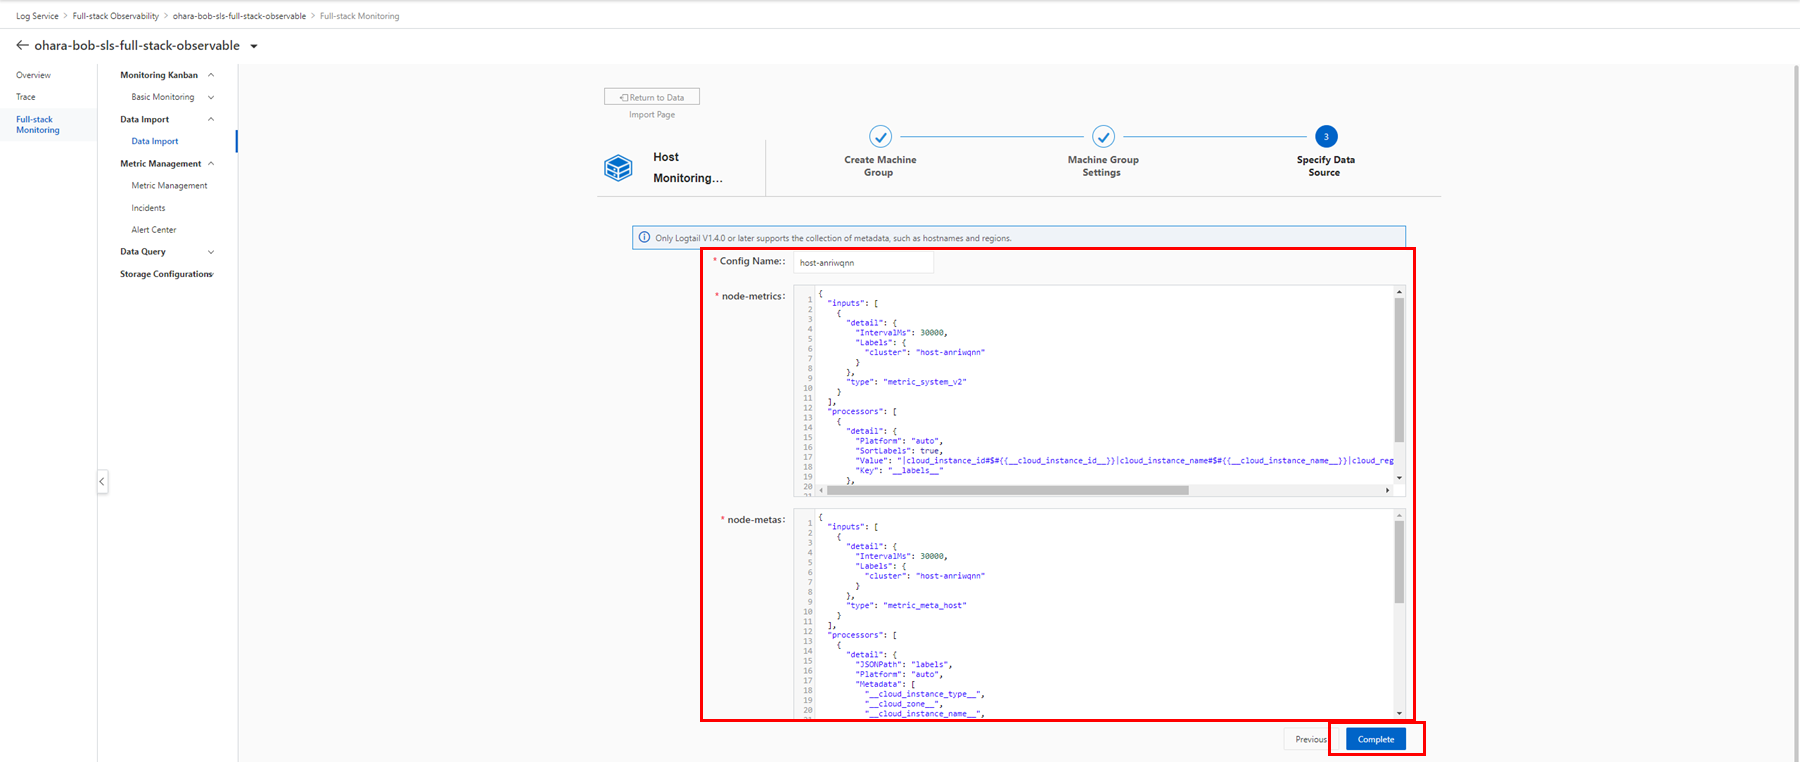
Simple Log Service supports two collection plug-ins for the host: node-metrics and node-metas. Advanced settings can be updated as needed. If everything looks good, click Complete to finish the configuration process.
The Host configuration is displayed in the list, and related Logstores are generated in the project at the same time.


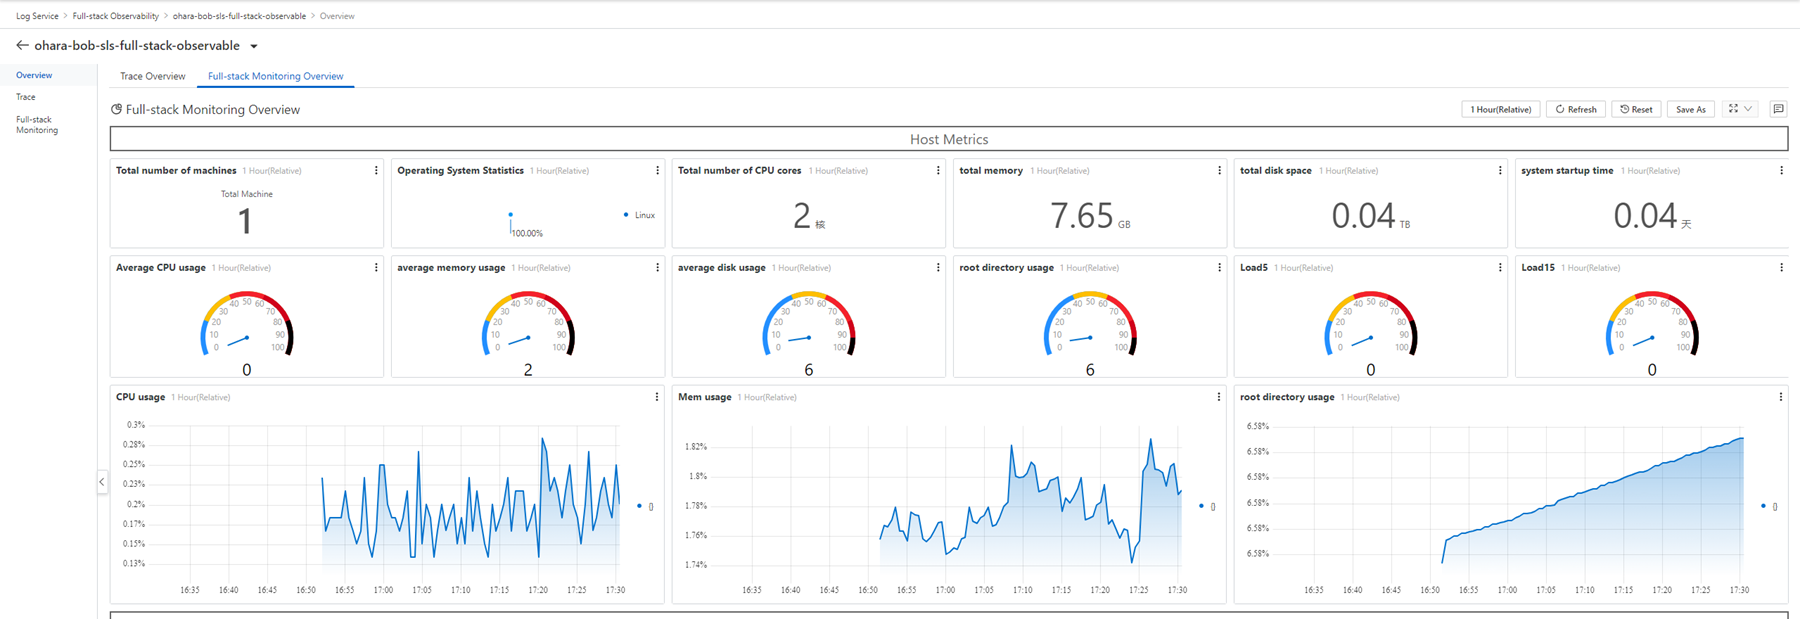
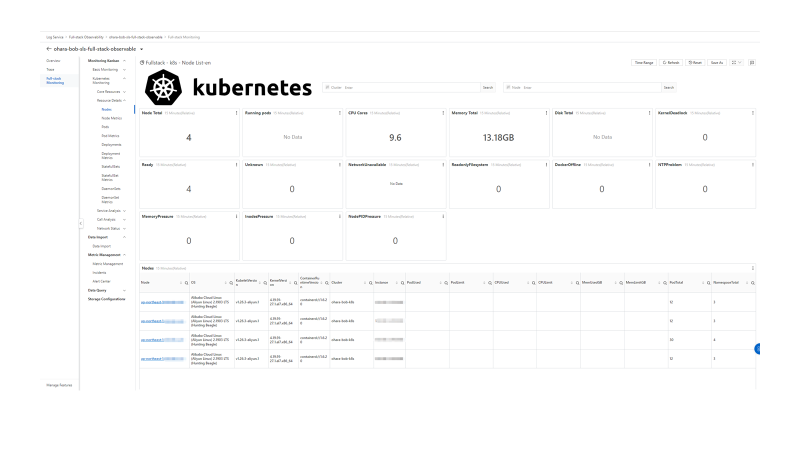
The monitoring data is collected and displayed in the Full-stack Observability instance.
To collect monitoring data for an ACK cluster, you must configure data access in the same way as before.
An ACK managed cluster provides monitoring capabilities on its own and does not allow access to the master node. This section uses an ACK-only cluster.
Related Reading:
Observability of an ACK Cluster: https://www.alibabacloud.com/help/en/container-service-for-kubernetes/latest/observability-overview
Prepare an ACK-only cluster and make sure that SSH logon is enabled.

Configure the logon method in the node pool configuration step. This is used later to access the master node.

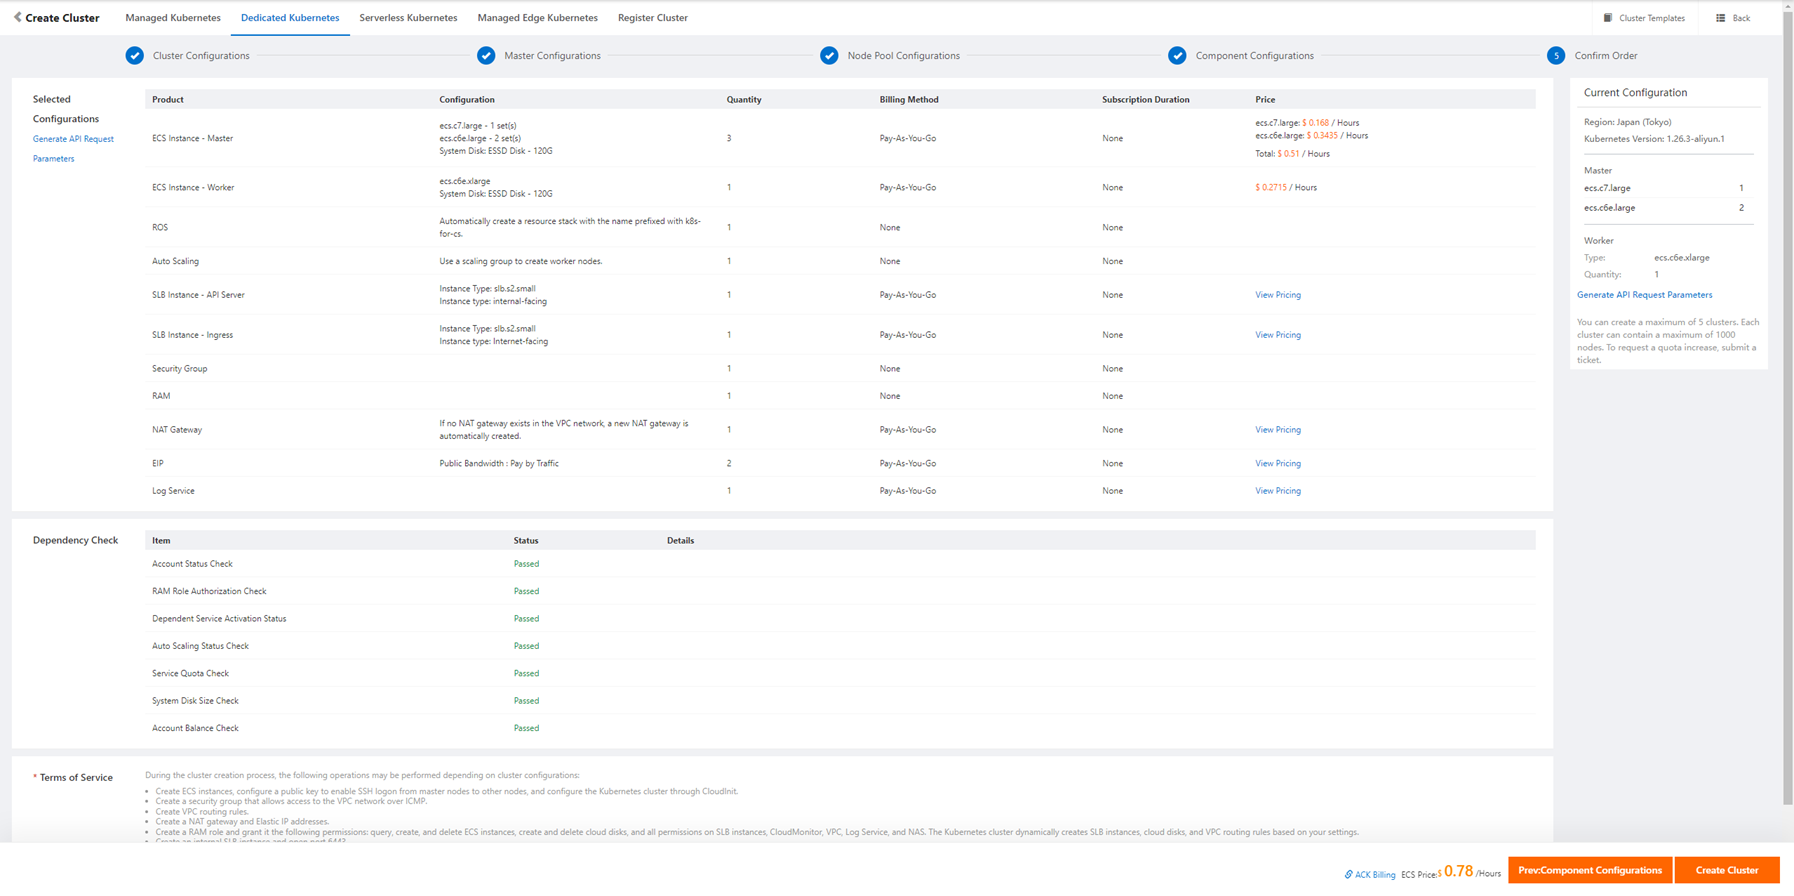
Related Reading:
Collect monitoring data from a Kubernetes cluster: https://www.alibabacloud.com/help/en/log-service/latest/perform-non-intrusive-monitoring
Wait until the dedicated cluster is ready.


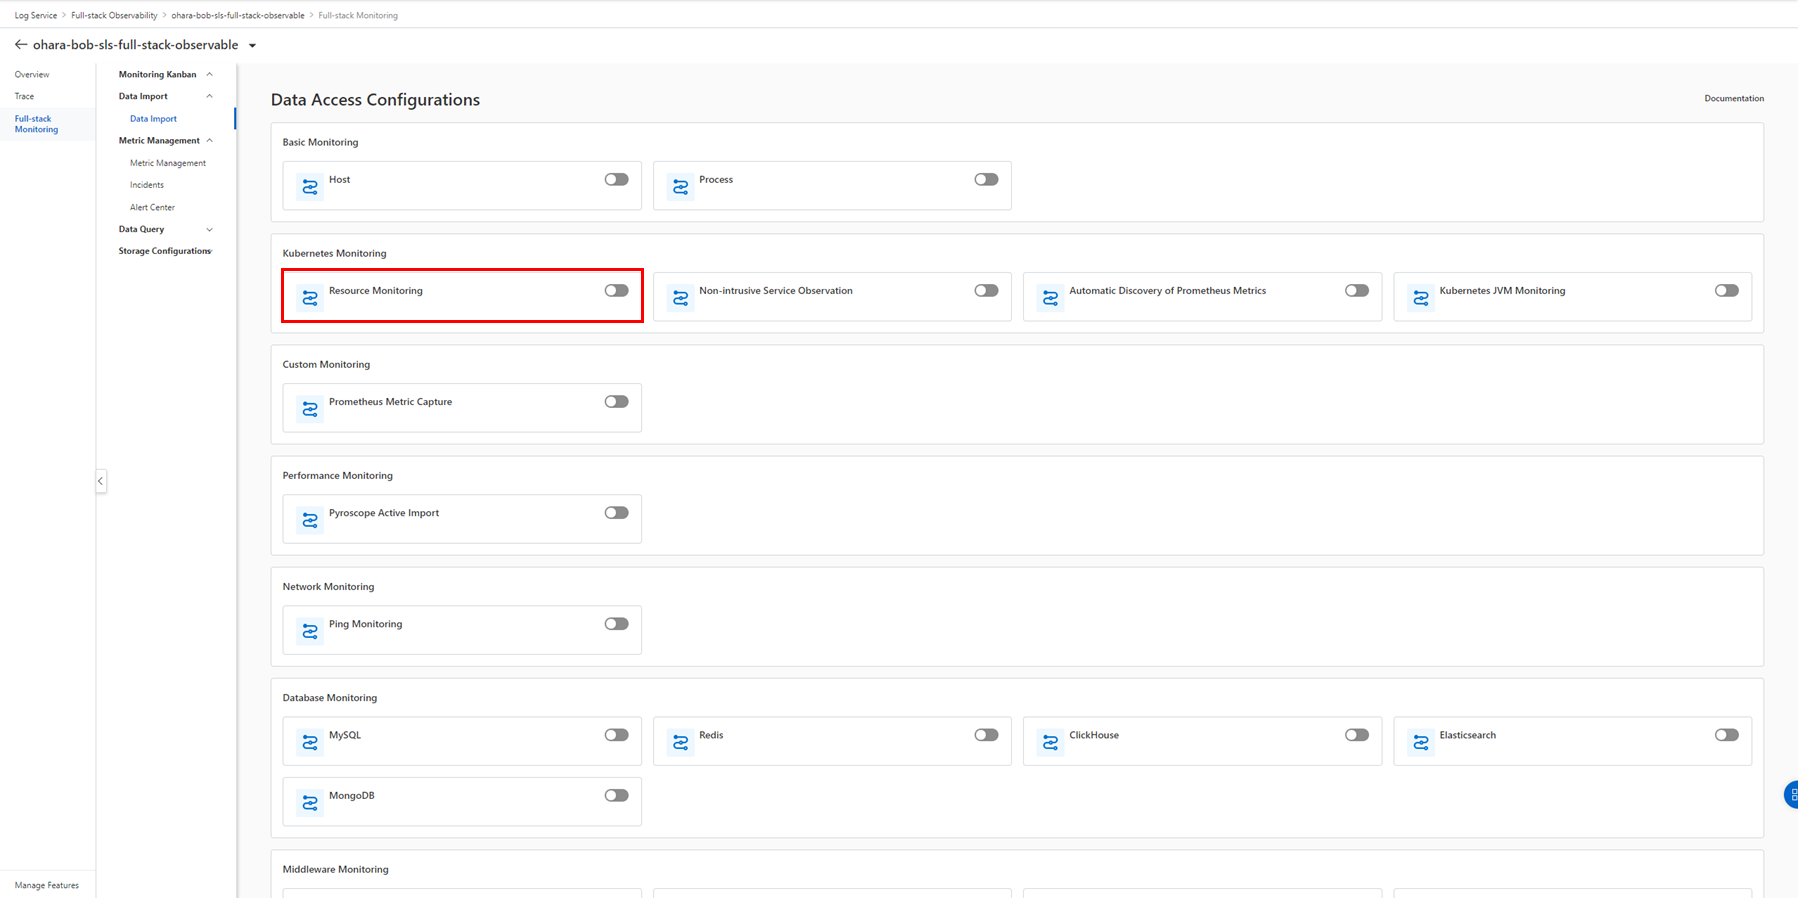
Enable Resource Monitoring in the Kubernetes Monitoring section.
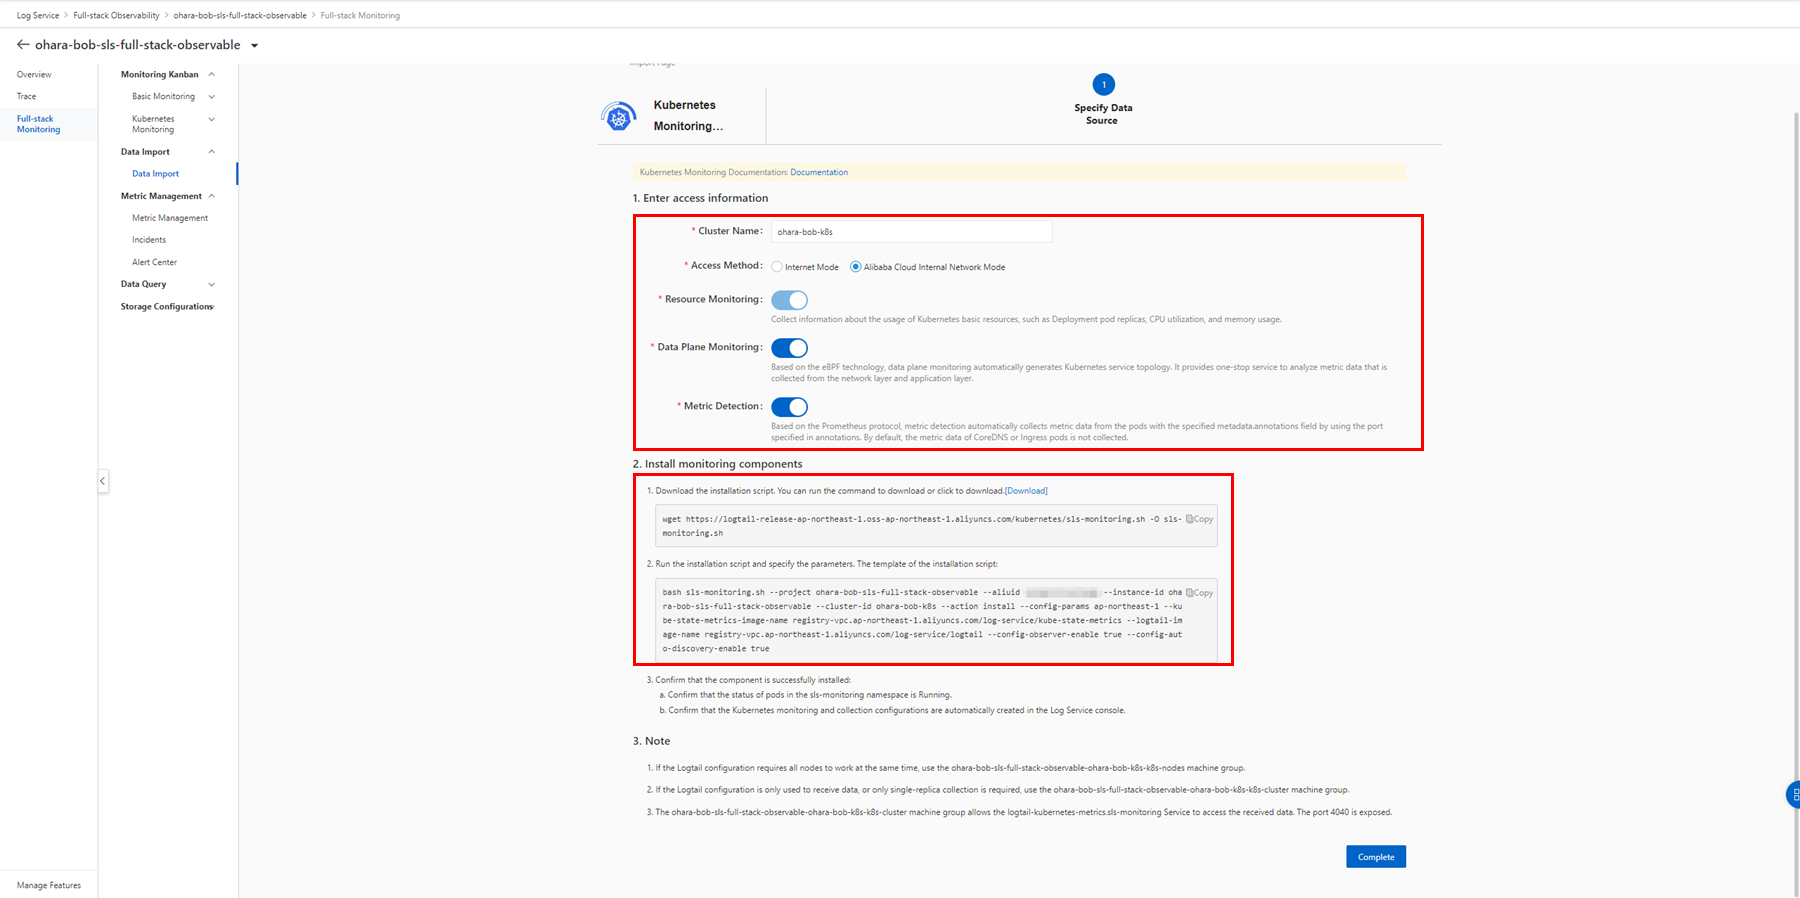
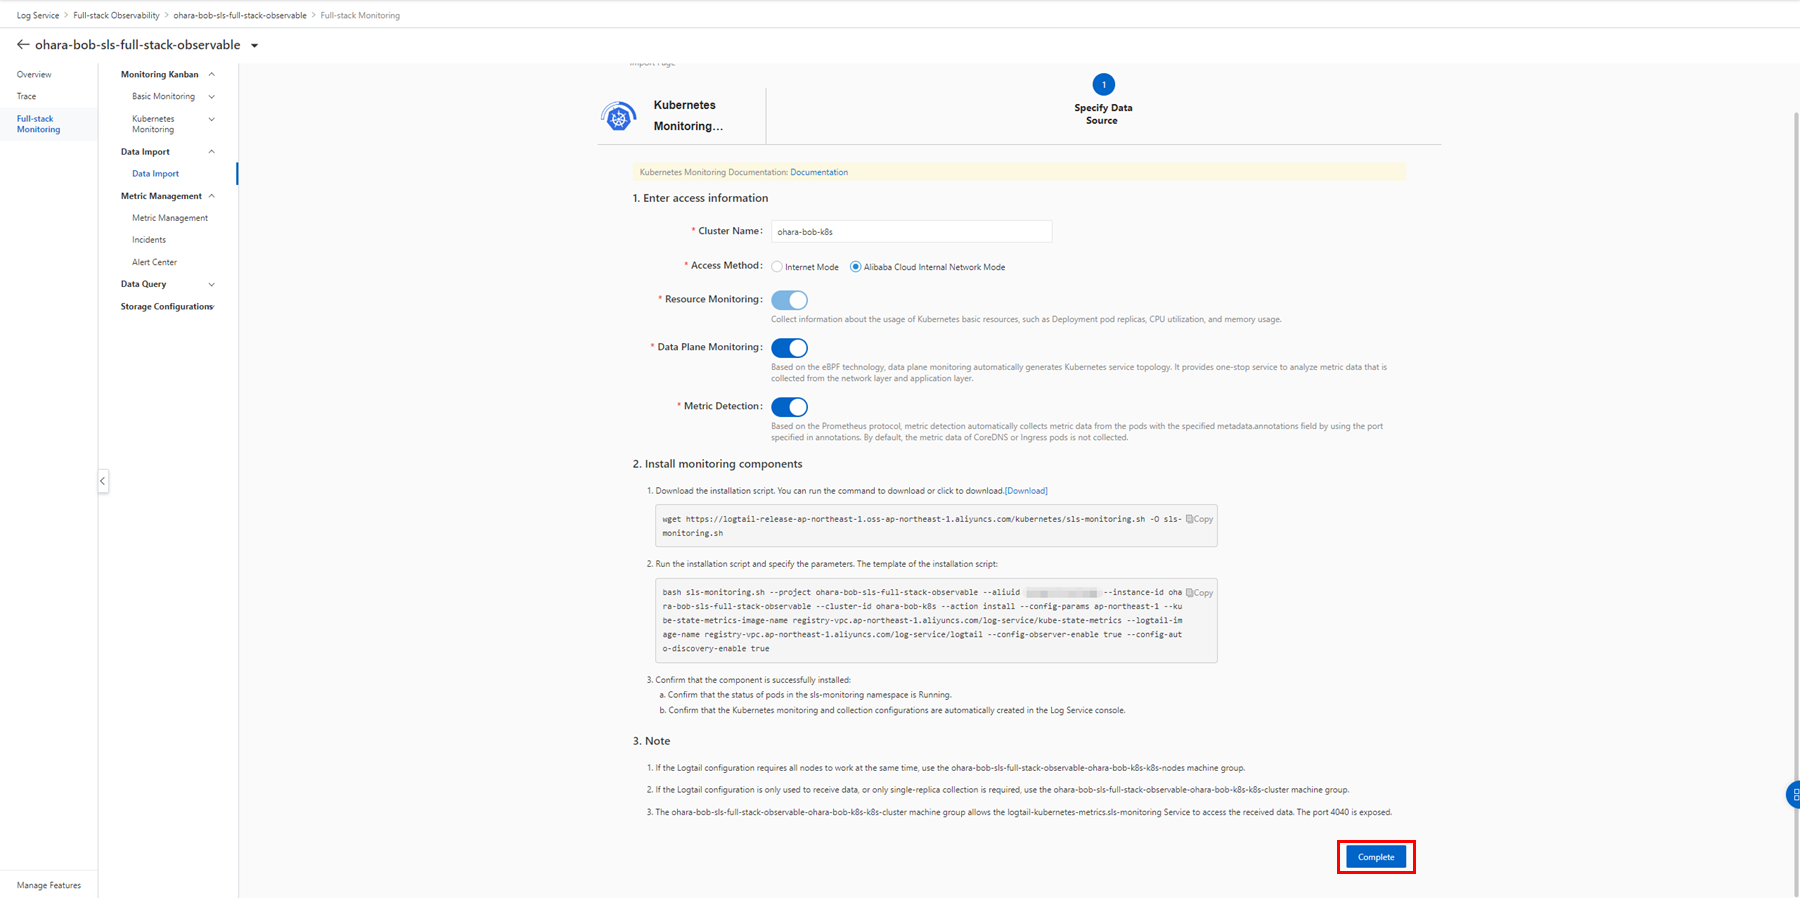
Set the access information. The installation command is automatically generated within the page. Alibaba Cloud Internal Network Mode is recommended since a cluster on the ACK service is being created in the same region. Enable Data Plane Monitoring and Metric Detection at the same time.
Access the master node based on the configuration.

Run the generated command to install and configure the Logtail service in the cluster.
wget https://logtail-release-ap-northeast-1.oss-ap-northeast-1.aliyuncs.com/kubernetes/sls-monitoring.sh -O sls-monitoring.sh

bash sls-monitoring.sh --project ohara-bob-sls-full-stack-observable --aliuid xxxxxx --instance-id ohara-bob-sls-full-stack-observable --cluster-id ohara-bob-k8s --action install --config-params ap-northeast-1 --kube-state-metrics-image-name registry-vpc.ap-northeast-1.aliyuncs.com/log-service/kube-state-metrics --logtail-image-name registry-vpc.ap-northeast-1.aliyuncs.com/log-service/logtail --config-observer-enable true --config-auto-discovery-enable true

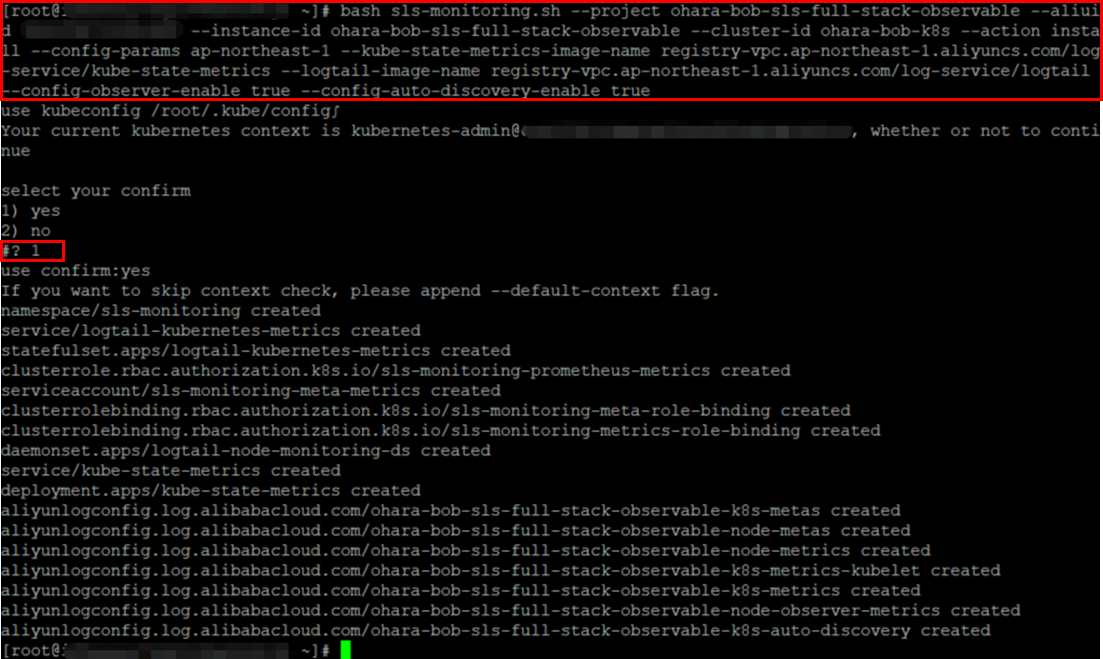
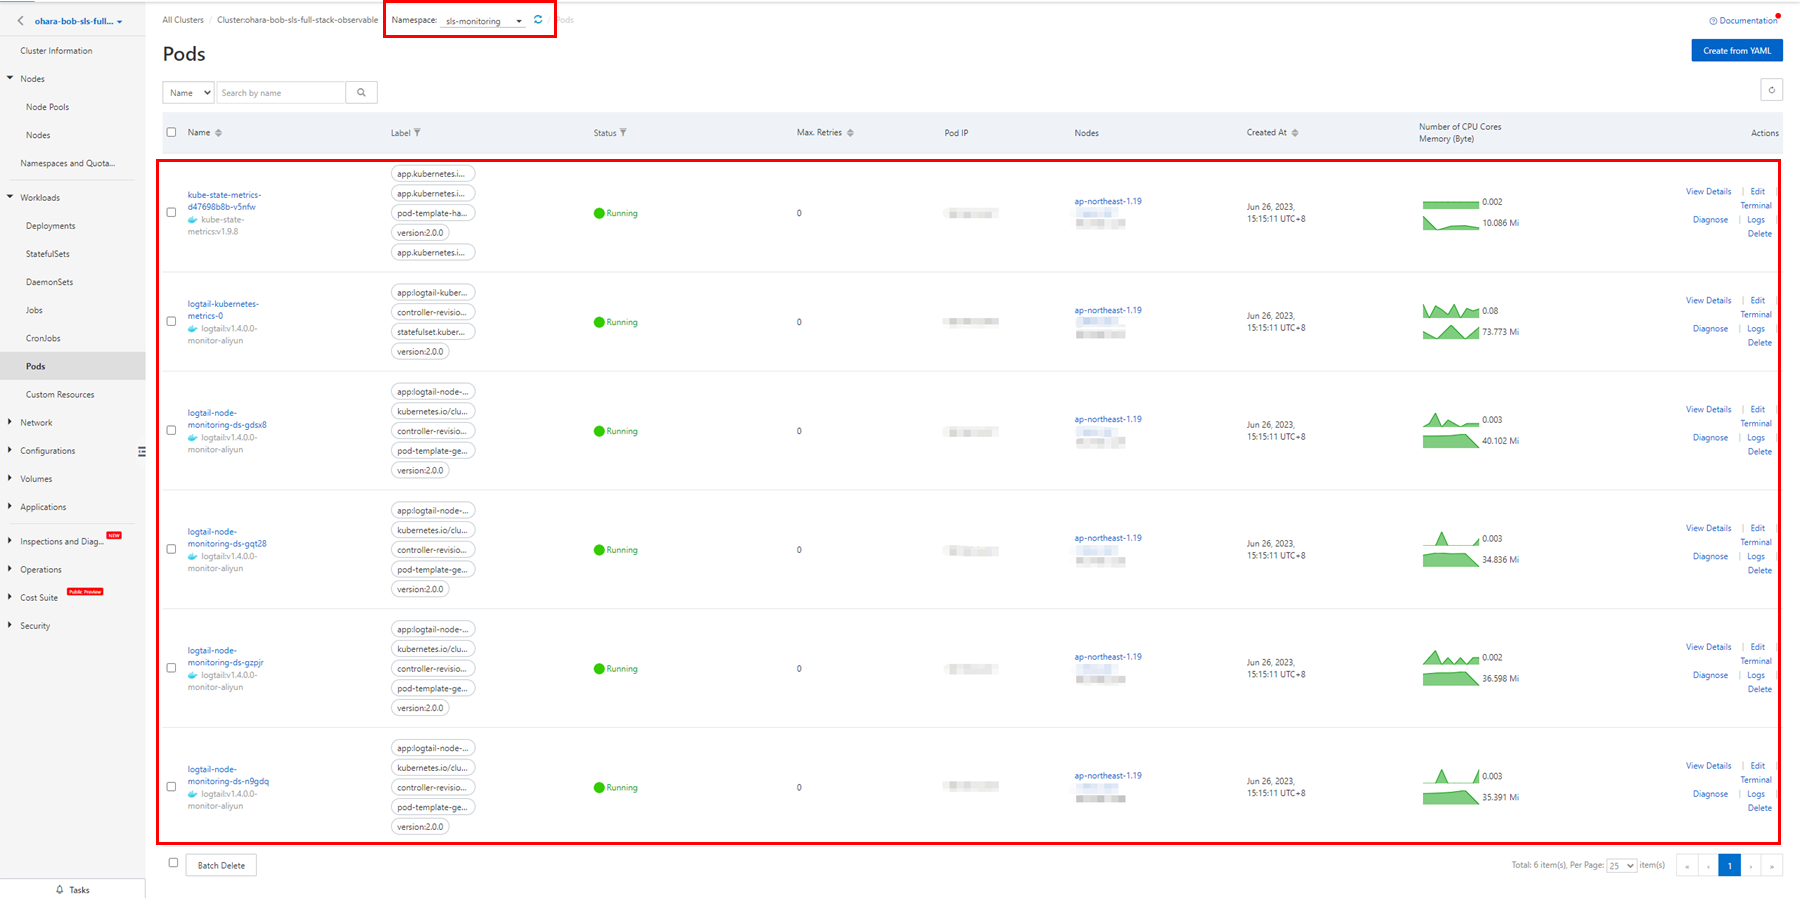
After the command is successfully executed, confirm that the sls-monitoring namespace exists. The Pod required should be in the Running state.

Click Complete in the console.
The configuration is successfully set and the related Logstores are also created.


Check the monitoring data collected on a Full-stack Observability instance.

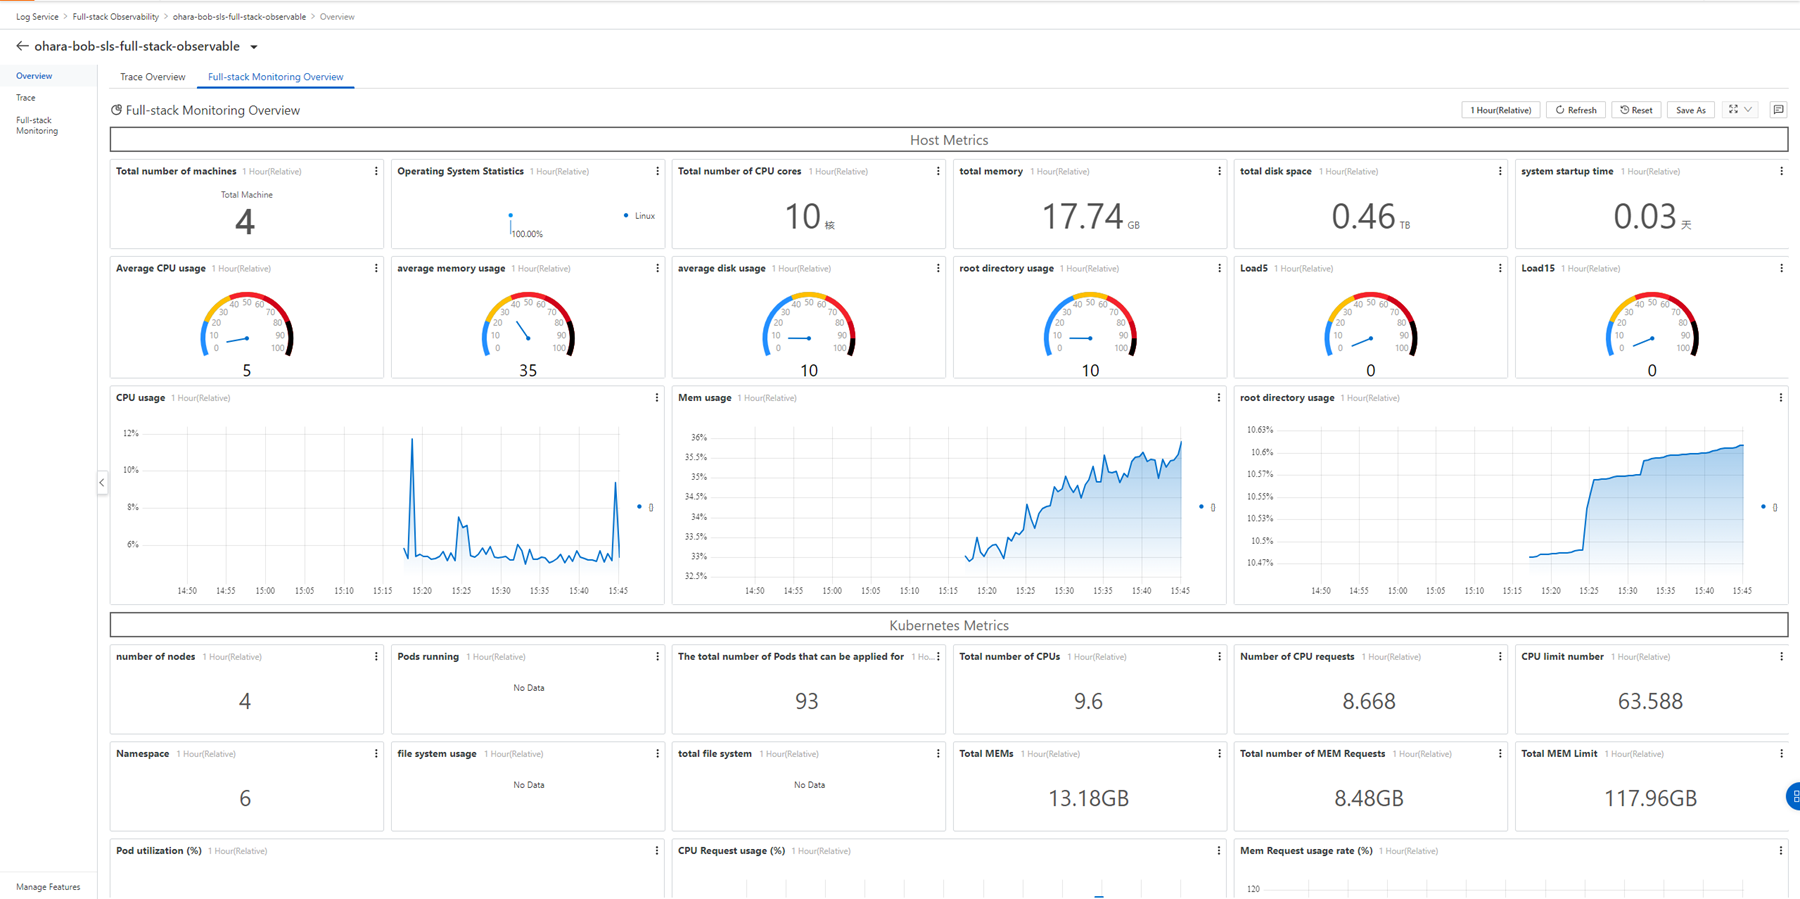
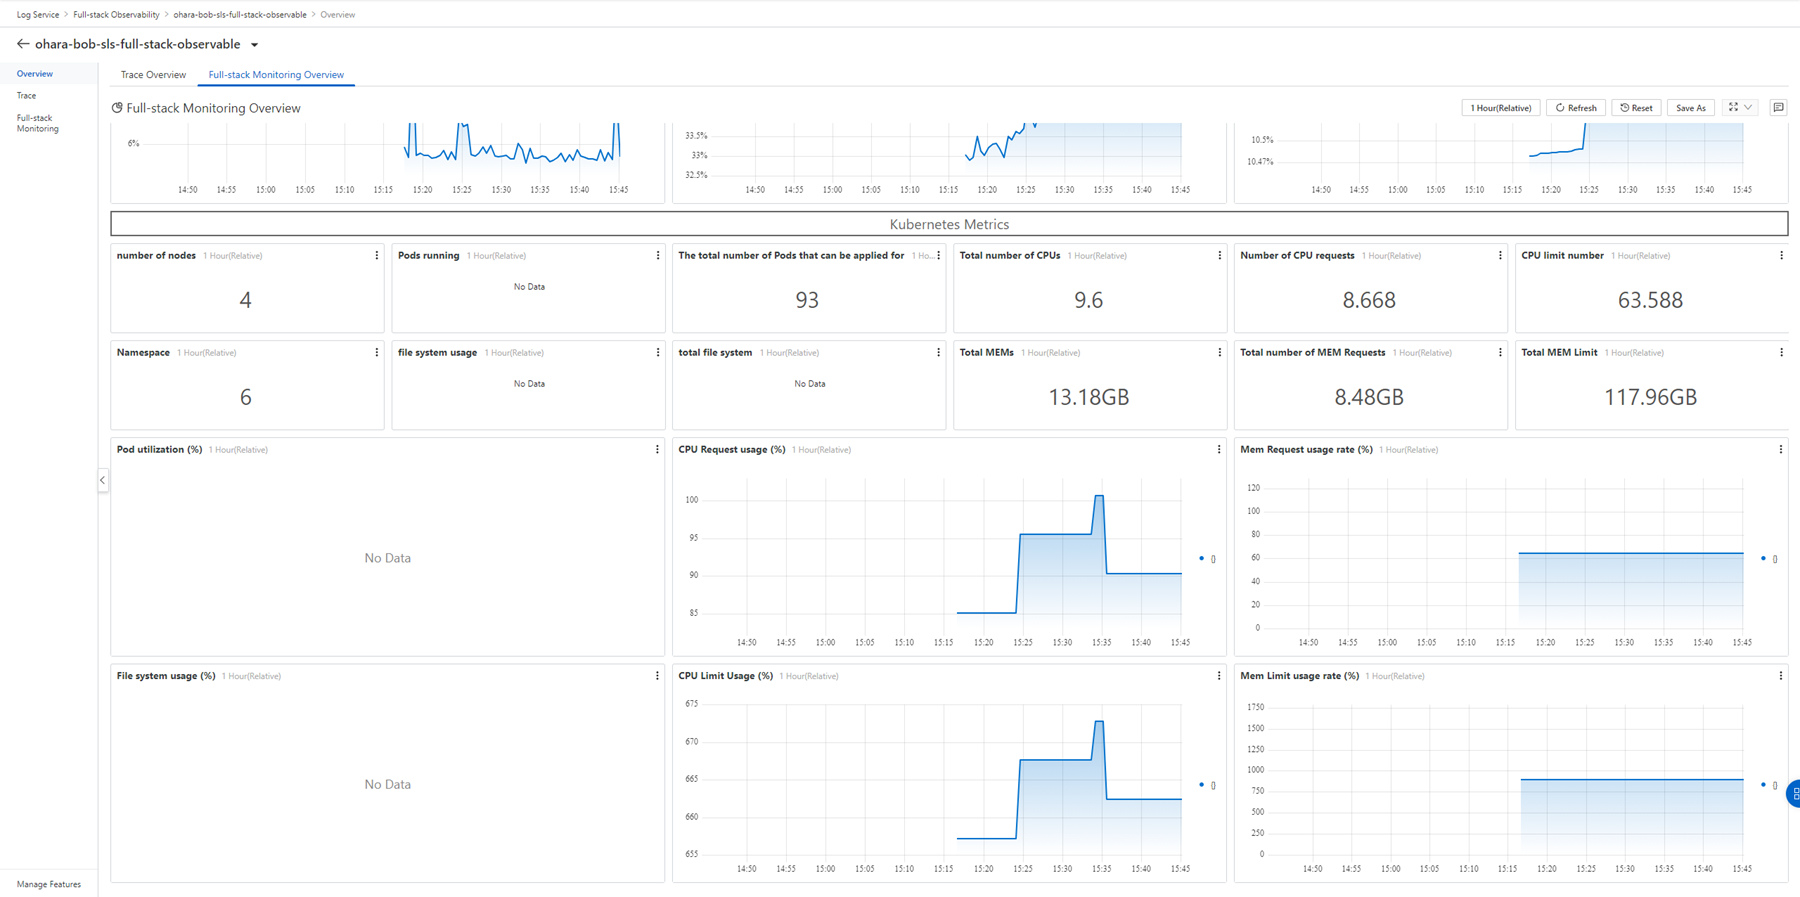
Existing data access settings can be easily disabled by clicking the icon that comes after a specific resource type.
An error message may appear in the process. Before disabling, make sure that there are no available resource configurations or other dependent configurations.
For example:
● If you disable data access for the Host, you must delete the configuration of the available resources.
● Before disabling the Resource Monitoring configuration of Kubernetes Monitoring, you need to disable Automatic Discovery of Prometheus Metrics and Non-intrusive Service Observation.


The data access of the configured host can be disabled by performing the following steps:


Heartbeat verification is used to check the installation status of Logtail. If a failed response is displayed on the page, you can troubleshoot according to the document.
If you install the Logtail service on the server for the first time and create a machine group, it is recommended to click Automatic Retry several times, and then check the reason.
Because the Logtail service is newly installed, it may not be ready when you access the verification page. After a retry, the heartbeat should be OK.
After the related features are enabled, SSH logon information is displayed in the basic information of the cluster.


If the cluster does not allow SSH logon, enable SSH port 22 on the binding SLB instance by following this document.

This article is a translated piece of work from SoftBank.
Disclaimer: The views expressed herein are for reference only and don't necessarily represent the official views of Alibaba Cloud.
An Introduction to Using Simple Log Service to Collect Logs from an ACK Cluster
Alibaba Cloud Native Community - January 19, 2026
Alibaba Cloud Native Community - October 22, 2025
Alibaba Cloud Native - June 21, 2024
Alibaba Cloud Native - October 23, 2024
Alibaba Cloud Native Community - January 8, 2026
Alibaba Cloud Native Community - July 22, 2022
 Managed Service for Grafana
Managed Service for Grafana displays a large amount of data in real time to provide an overview of business and O&M monitoring.
Learn More Managed Service for OpenTelemetry
Allows developers to quickly identify root causes and analyze performance bottlenecks for distributed applications.
Learn More Managed Service for Prometheus
Multi-source metrics are aggregated to monitor the status of your business and services in real time.
Learn More Application Real-Time Monitoring Service
Build business monitoring capabilities with real time response based on frontend monitoring, application monitoring, and custom business monitoring capabilities
Learn MoreMore Posts by H Ohara