By Zhizhen
Simple Network Management Protocol (SNMP) is used for network device management. The variety of network devices and the different management interfaces (such as command-line interfaces) provided by different manufacturers make network management more complicated. SNMP was created to solve this problem. As a standard network management protocol widely used on TCP/IP networks, SNMP provides a unified interface to achieve unified management of network devices with different types from different manufacturers. Users can keep an eye on the status and abnormal changes of network devices through the monitoring data of SNMP.
With the rapid development of network technology, the number of network devices grows geometrically, making it more difficult for network administrators to manage the devices. At the same time, as a complex distributed system, the network is expanding its coverage, making real-time monitoring and troubleshooting of these devices extremely difficult. The variety of network devices and the different management interfaces (such as command-line interfaces) provided by different manufacturers make network management more complicated.
SNMP was created to solve this problem. As a standard network management protocol widely used on TCP/IP networks, SNMP supports network management systems to monitor whether devices connected to the network need O&M. At the same time, SNMP adopts the polling mechanism to provide the most basic function sets, which is suitable for small, fast, and low-cost environments. Moreover, SNMP uses User Datagram Protocol (UDP) messages as its transport protocol, so it is supported by most devices. At the same time, it ensures that management information is transmitted at any two points, making it easy for administrators to retrieve information and troubleshoot at any node on the network.
After the development of the technology, three SNMP versions emerged: SNMPv1, SNMPv2c, and SNMPv3.
As the initial version of SNMP, it provides minimal network management functions. SNMPv1 adopts community authentication. It has low-level security and returns limited error codes in the message.
SNMPv2c also adopts community authentication. Based on SNMPv1, it introduces GetBulk and Inform operations to support more standard error code information and more data types (such as Counter64 and Counter32).
In terms of security, SNMPv3 provides authenticated encryption based on the User Security Module (USM) and access control based on the View-Based Access Control Model (VACM). SNMPv3 supports the same operations as SNMPv2c. Currently, v1 is less used, and v2c is generally used. If there is a need for security authentication, you can use v3.
An SNMP system consists of the following components: network management system (NMS), agent, managed object, and management information base (MIB). As shown in the figure, they together constitute the management model of SNMP and play a vital role in the architecture of SNMP.
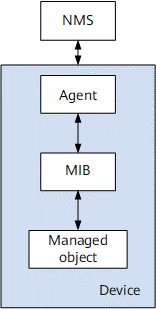
It is generally a variety of network management software, which can query or modify various information from the agent and accept the active push of the agent. In our scenario, it is SNMP exporter, which only queries information on the agent.
It is an agent on a managed device. It collects information about the managed device and reports it to the NMS.
It is a database that lists the items of data that a managed device can provide. Each item of data corresponds to a unique OID.
It includes switches, routers, firewalls, UPS, AP, and soft routing and can be regarded as a network device as long as SNMP is supported.
A device contains at least one managed object, which may be the device itself, hardware (a network port), or a collection of parameters.
It is used to locate a data item. OID is a string of numbers. For example, 1.3.6.1.2.1.1 represents a system, and the number is a tree structure, with roots on the left and leaves on the right. The front part is the manufacturer ID assigned by IANA, and the back is customized by each manufacturer, so the OID trees of different manufacturers' devices vary immensely. Please see the following figure for the OID tree structure.
Since SNMP can monitor a variety of devices and manufacturers, SNMP exporter is divided into many modules (such as network device if_mib, soft routing DD-WRT, paloalto_fw firewall). There are more than a dozen kinds, and the most commonly used is if_mib.
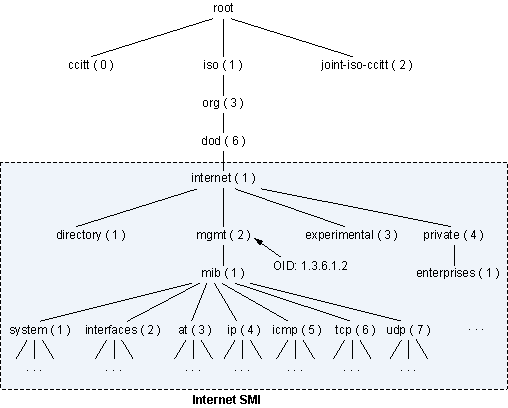
Different OIDs are used to distinguish different status data in the SNMP, so OIDs are very similar to the concept of metrics in Prometheus. SNMP Exporter transforms SNMP data into Prometheus metrics by querying the specified OID data from the Agent and mapping the data to readable metrics. SNMP Exporter provides a wide range of transformation configurations by default. In most scenarios, you can transform OIDs into readable metric data without additional configurations.
SNMP can help O&M personnel manage the network in a simple and effective way. First, SNMP helps O&M personnel collect information about the bandwidth usage of different devices on the network. Therefore, they can identify the trends or problems of network performance faster while troubleshooting. Second, SNMP collects different data provided by devices from different manufacturers. As SNMP Exporter provides compatibility as much as possible, and the default configuration contains common OID mappings of various manufacturers, covering major manufacturers and their network products on the market. The data collected can meet the requirements of most scenarios. Please see the related documentation of the Prometheus open-source community for more information.
In the current version, we support the metric data collection of if_mibmodule, and more module support will be available as needed.
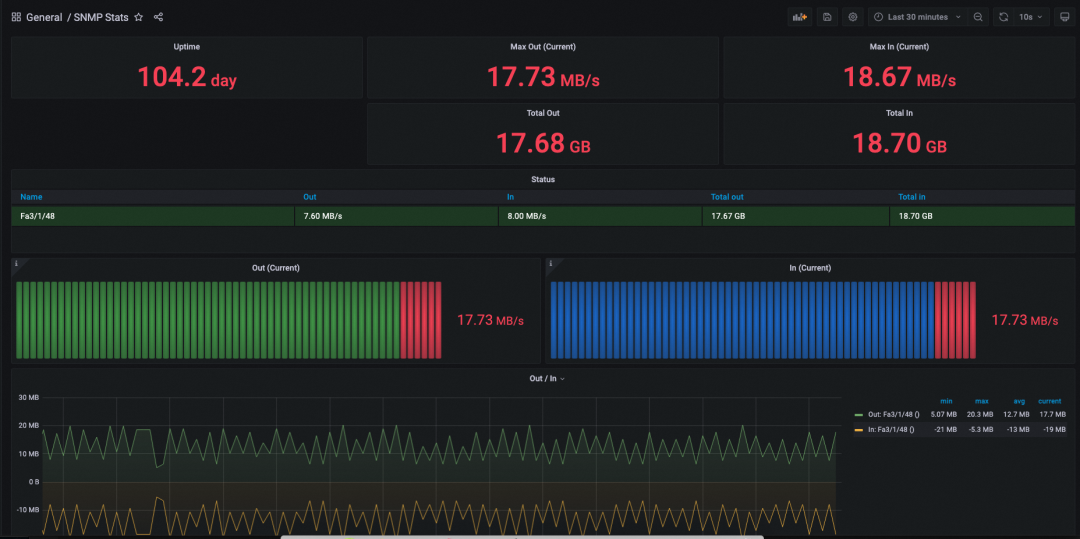
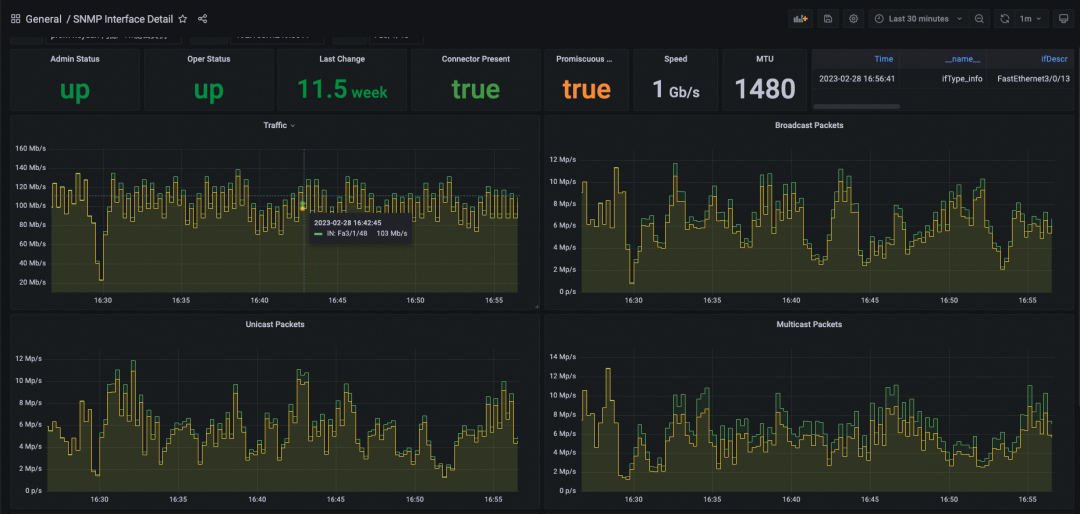
By default, the SNMP Status and SNMP Interface Detail dashboards are provided to monitor network traffic and other information in if_mib scenarios.
SNMP Status dashboard displays the overall status of the device, including the device runtime, current egress or ingress traffic, total egress and ingress traffic, real-time traffic information of each port, and traffic change trend.
SNMP Interface Detail dashboard displays the working details of each port. The details include the port status, whether the port is connected, port rate, MTU configuration, and the rate and packet number changes of various traffic (unicast and multicast).
Note: Before using the SNMP Interface Detail dashboard, you need to configure the DataSource to view in Variable.
Based on the previous description of major metrics, you can configure the following alert items for SNMP:
In the Prometheus instance for Container Service, SNMP is displayed in the integration center by default. You can access SNMP by choosing ARMS Console -- Instance Details Page -- Integration Center.
Click the SNMP icon to view the list of common metrics and the thumbnail of the dashboard. Note: Only some common metrics are listed due to the complexity of OID/MIB.
SNMP monitoring can be accessed through Click + Install. An SNMP exporter can be quickly pulled up only by entering the exporter’s name and device IP address. In general, it is unnecessary to modify the metrics path and metrics scrape interval. Keep the default values. The configurations are listed below:
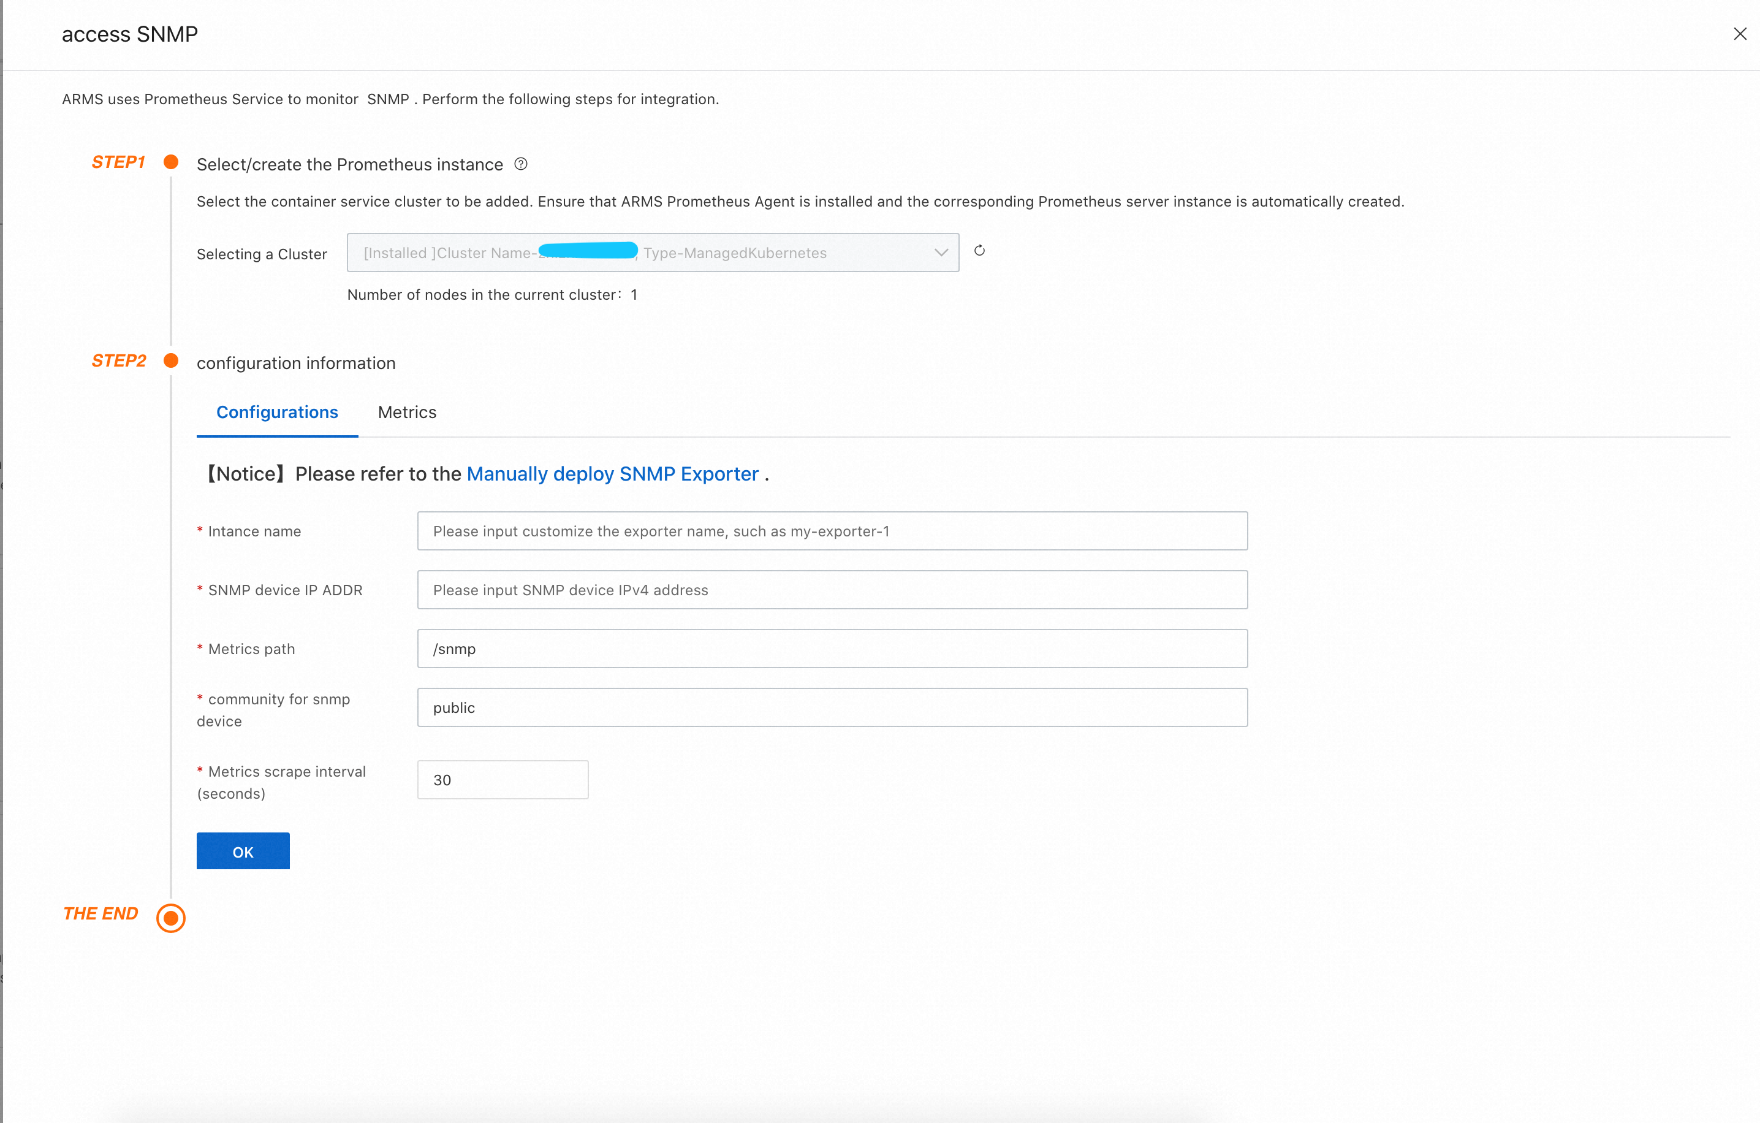
After clicking OK, a deployment named snmp-exporter-snmp-test-1 is added under the arms-prom namespace to your ACK cluster, and the collection job is automatically configured. At this time, you can see the newly configured collection job by choosing ARMS Console -- Instance Details Page -- Service Discovery -- Target. You can also click the Integration Center -- SNMP icon to view information (such as Target, Metrics, Dashboard, Alerts, Service Discovery, and Exporter).
View the Dashboard
To view SNMP dashboards, click ARMS Console -- Instance Details Page -- Dashboards, and then click the snmp_exporter to get the related dashboards. You can also click the SNMP icon in the Integration Center and click the Dashboards tab to view the corresponding dashboards.
When you install SNMP monitoring in the Integration Center, the rules related to the snmp_exporter alert group have been added by default, but they are not enabled. You need to modify the parameters and confirm that they are enabled. You can enter the rule adding page by clicking ARMS Console -- Instance Details Page -- Alert Rules -- Create Prometheus Alert Rule. Then, in the alert group, select snmp_exporter alert on duty and the alert rules you need to enable, confirm the parameter threshold, and save it. The creation of alert rules is completed.
Troubleshooting Methods for SNMP Metrics Not Collected
The main work of SNMP Exporter is metrics mapping, which can run stably, but SNMP metrics generally involve network devices, so there is a high probability of network problems. If the metrics cannot be collected, you can refer to the following troubleshooting methods.
1. Check the status of the Prometheus Target. If the Target is in the Unhealthy state, check whether the snmp-exporterpod is in the Running state. If the Target is in the Normal state, proceed to the next step.

2. View the snmp-exporterPOD logs and check whether there are error messages in logs. If it is a network problem that causes metrics not to be collected, it will be clearly reflected in the log, and you can troubleshoot it according to the error messages.

3. If there is no exception in logs, only an SNMP metric is missing and other SNMP metrics can be collected, it is probably because the device does not have this metric. We can use snmpwalk to assist in troubleshooting and confirmation.
a) All the data that SNMP Exporter can collect can be obtained through snmpwalk. Many Linux distributions do not have snmpwalk by default, so you need to install the package net-snmp-utils first.
b) Use snmpwalk on a machine that can connect to an SNMP device to get the raw device data

c) If snmpwalk still fails to obtain the data, you need to check with the device manufacturer whether the data is available.
As one of the mainstream observable open-source projects, Prometheus has been widely used by many enterprises. However, there are still various problems in the process of practical production. For example:
Alibaba Cloud Prometheus has been optimized in the following aspects to address these problems:
In order to further optimize the performance, Alibaba Cloud Prometheus Monitoring deploys the Agent on the user side to retain the native collection capability with the least amount of resources. Use the collection and storage separation architecture to improve the overall performance. Optimize the collection component to improve the single-replica collection capability and reduce resource consumption. Use multi-replica scale-out to evenly decompose collection tasks to implement auto scaling and solve the problem of open-source scale-out. The collection, data processing, and storage components support multiple versions to ensure the high availability of core data links. Elastic scale-out can be directly performed based on the cluster size. Data retransmission is supported to completely solve the logic problems and ensure data integrity and accuracy.
At the same time, to cope with query scenarios of large-scale data and long-time intervals, it can use DAG optimization and operator pushdown to improve the performance of large-scale data queries and support long-time queries within seconds. It can use Global DataSource and Global View to implement unified monitoring of multiple clusters and aggregate queries across clusters. It provides enterprise-level capability enhancement and reduces the IT O&M costs for enterprises to use Prometheus.
Cloud products provide observability in their respective consoles. However, their metrics and dashboards are scattered across consoles, and it is impossible to apply refined metric data. The Prometheus service provides the cloud product monitoring feature to display, query, and generate alerts for these data in a unified manner. This provides a more convenient daily O&M and monitoring interface for O&M teams.
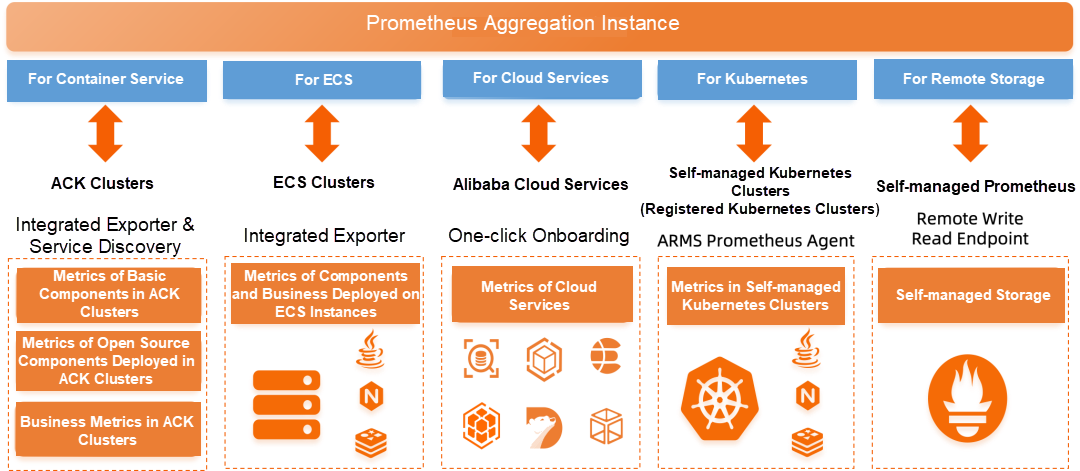
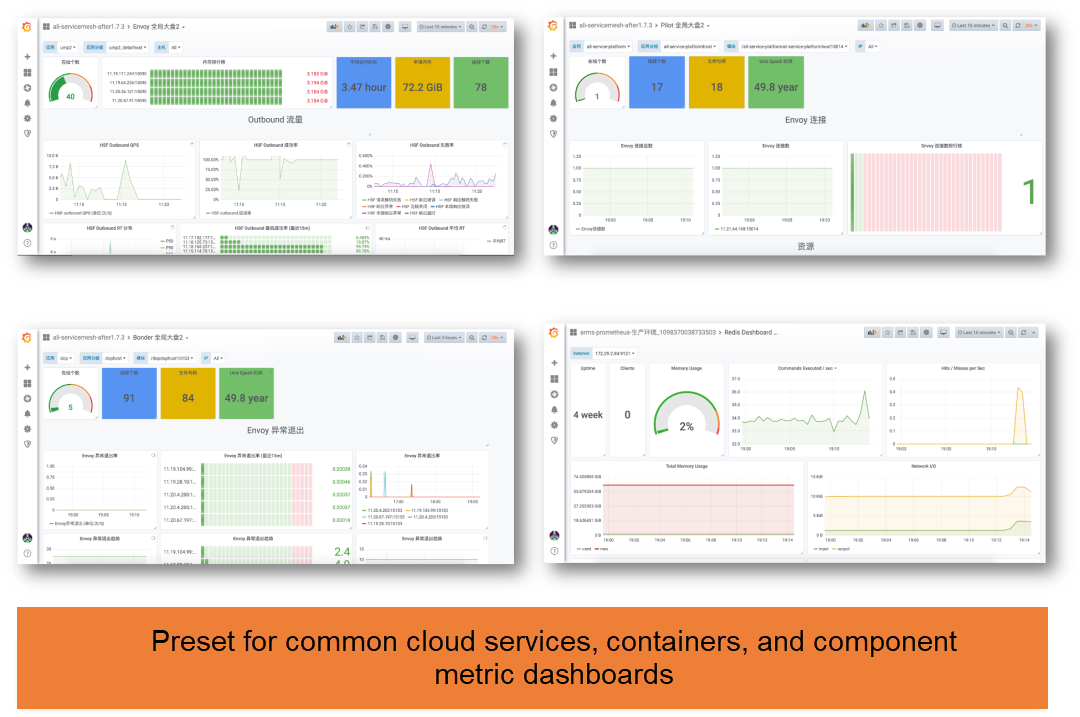
In order to display relevant metric charts better and faster, Alibaba Cloud Prometheus Monitoring provides a Grafana component to preset dashboard templates for common cloud services and applications (such as Application Real-Time Monitoring Service (ARMS), Cloud Monitor System (CMS), Log Service (SLS), and Alibaba Cloud Elasticsearch). It provides data source configurations and preset dashboards of various cloud services to display various observable data in a unified manner. For example, containers and Message Queue for Apache Kafka provide the GrafanaPro dashboard to help O&M refine metric observation. In addition to the preset dashboards, you can use Grafana to add new plug-ins, visual templates, and data sources to meet personalized O&M and monitoring requirements.
Alibaba Cloud Prometheus is seamlessly integrated with Alibaba Cloud Container Service. It provides one-click integration of metrics collection, user dashboards, and alert rules for SNMP devices. It is O&M-free and out-of-the-box. Currently, the SNMP metric collection feature is still being developed. You are welcome to try it out and put forward suggestions for improvement.
Observability | Best Practices for Monitoring NGINX Ingress Gateways with Prometheus

212 posts | 13 followers
FollowDavidZhang - January 15, 2021
Alibaba Cloud Native Community - December 13, 2023
Alibaba Cloud Native Community - December 11, 2023
Alibaba Cloud Native Community - July 22, 2022
Alibaba Clouder - April 12, 2021
Alibaba Cloud Native - August 14, 2024

212 posts | 13 followers
Follow Best Practices
Follow our step-by-step best practices guides to build your own business case.
Learn More Application Real-Time Monitoring Service
Build business monitoring capabilities with real time response based on frontend monitoring, application monitoring, and custom business monitoring capabilities
Learn More Managed Service for Prometheus
Multi-source metrics are aggregated to monitor the status of your business and services in real time.
Learn More Cloud-Native Applications Management Solution
Accelerate and secure the development, deployment, and management of containerized applications cost-effectively.
Learn MoreMore Posts by Alibaba Cloud Native