By Yanhong
The rapid advancement of cloud-native technologies, notably Kubernetes, has led to a transformation in R&D and O&M models. Enterprise software architecture has transitioned from monolithic services to distributed services and microservices. As businesses expand, enterprises are increasingly adopting multi-language, multi-framework, and multi-protocol microservices, resulting in complex software architecture. It is imperative for R&D personnel to swiftly identify issues using observability tools.
In order to address comprehensive application monitoring requirements, the Application Real-Time Monitoring Service (ARMS) has introduced the eBPF edition, leveraging eBPF technology to enhance the entire application monitoring system. The ARMS eBPF edition offers non-intrusive, language-independent observability.
For a detailed product introduction, see Optimal multi-language application monitoring: ARMS eBPF edition
The use of eBPF for observability mandates application layer protocol parsing. However, the complex nature of application layer protocols in cloud-based microservice software architectures presents significant challenges for protocol parsing. Traditional protocol parsing methods consume high CPU and memory resources, and often result in high error rates. In the ARMS eBPF edition, an efficient protocol parsing approach is introduced to achieve effective application layer protocol parsing.
eBPF (Extended Berkeley Packet Filter) is a powerful technology that enables developers to securely execute precompiled programs in the Linux kernel without altering the kernel source code or loading external modules. This unique capability positions eBPF as an ideal choice for developing modern, flexible, and efficient application monitoring tools.
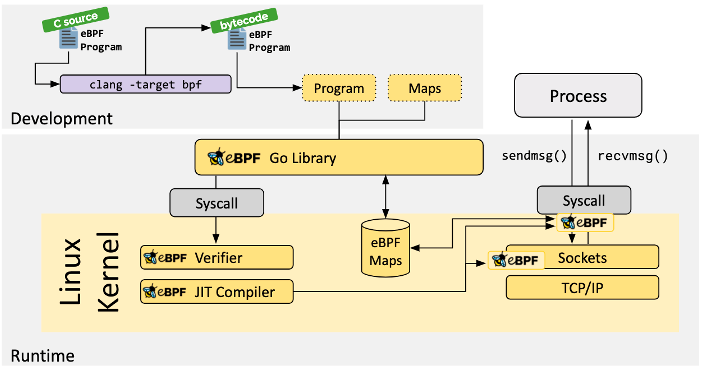
Figure 2.1 eBPF diagram
In terms of observability, the advantages of eBPF are particularly prominent:
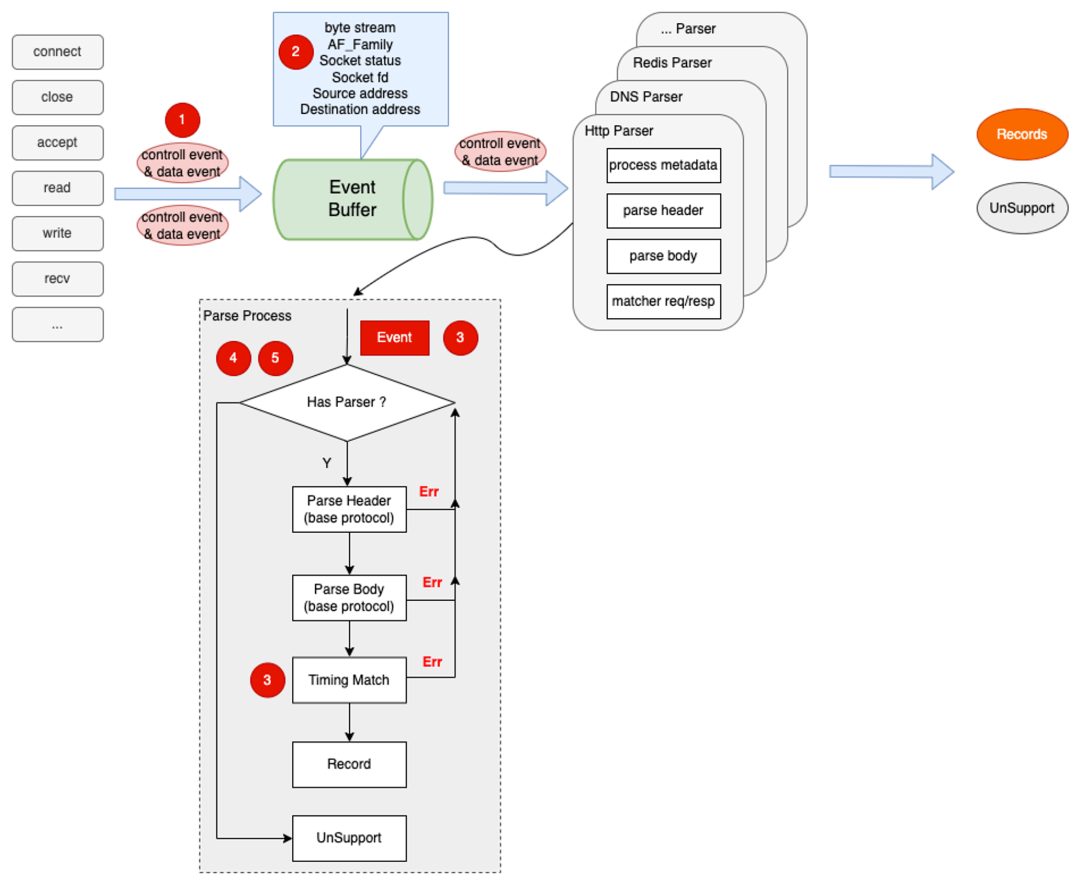
Figure 3.1 Traditional protocol parsing solution architecture
The traditional solution for data capturing and protocol parsing based on eBPF is mainly divided into three parts:
Data collection is mainly in the kernel state. Data passing is between the kernel state and the user state. Protocol parsing is in the user state. Specifically, the process of data collection is that eBPF uses kprobe or tracepoint to capture traffic events from the kernel. These events include control-level events such as those collected from calls such as connect and close. Data-level events are also included, such as those collected from read and write. After event data is collected, we need to pass the data from the kernel state to the user state for further processing. In eBPF, perf buffer (a special eBPF map) is used for data passing. After the data is stored in the entire perf buffer, protocol parsing is performed in the user state.
In the traditional parsing solution, the CPU and memory usage is too high, and so is the error rate in high-traffic scenarios. This is mainly reflected in the following three aspects:
To solve the problems in the traditional scheme mentioned earlier, this article proposes an efficient protocol parsing solution, which is divided into four parts:
Among them, the protocol parsing part is further divided into:
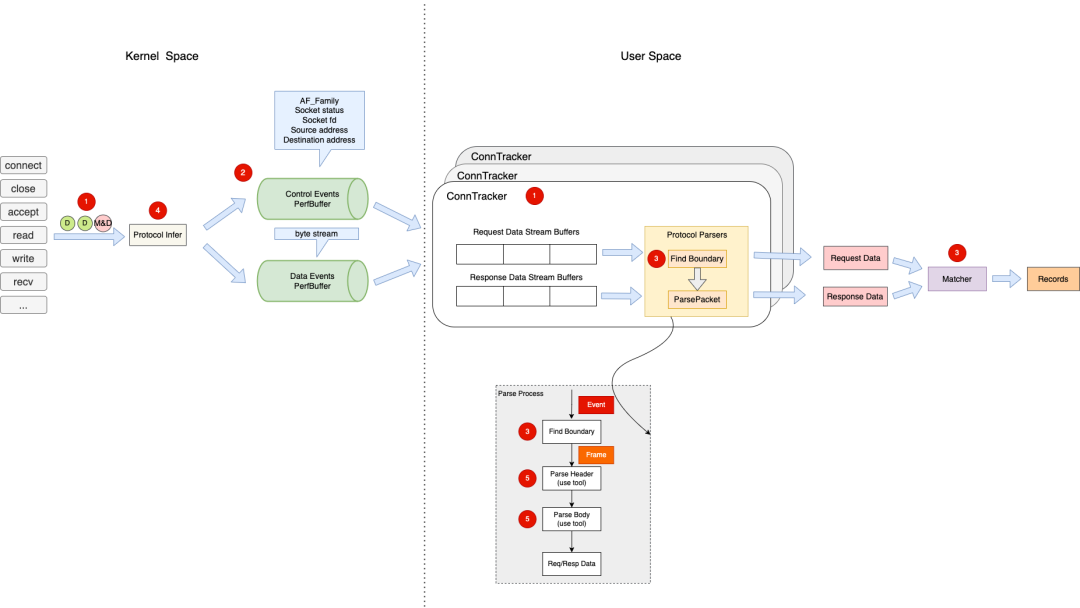
Figure 4.2 Efficient protocol parsing solution architecture
As shown in Figure 4.2, eBPF first collects data in the kernel state, and then performs protocol inference according to the protocol frame header. According to the result of the protocol inference, it can be preliminarily determined whether the data frame is a supported protocol. If the answer is "Yes", the data frame is passed to the user state for further parsing. Otherwise, no processing is performed. After simple event filtering, events are classified based on their type.
For example, control events are placed in the control event perf buffer, and data events are placed in the data event perf buffer. After events are passed to the user state, control events will be used for connection maintenance, and data events are placed in the send queue or the receive queue according to their data flow direction. Then, data in the queue is periodically divided into frames, which can cope with various scenarios such as single-send and multiple-receive, multiple-send and single-receive, as well as multiple-send and multiple-receive. After the data in a single frame is disassembled from the receive queue or the send queue (which is a data flow), it will be further parsed by matching the protocol type inferred in the kernel state and the corresponding protocol parser. After parsing the request and response, you need to match them to complete an observability record. The record will be used later to generate an observability span.
Subsequent sections of this chapter will further explain the key processes in Figure 4.2, namely the protocol inference and protocol parsing.
As its name implies, protocol inference is used to infer whether the protocol type is supported by checking the protocol frame header when a packet is collected. If it is a supported type, the data is passed to the user state for further processing.
Take the MySQL 5.7 protocol as an example. In the MySQL 5.7 protocol, the first frame could be one of the following types if it is a MySQL command frame, as shown in Figure 4.3. For more information about command frame types, see MySQL official documentation.
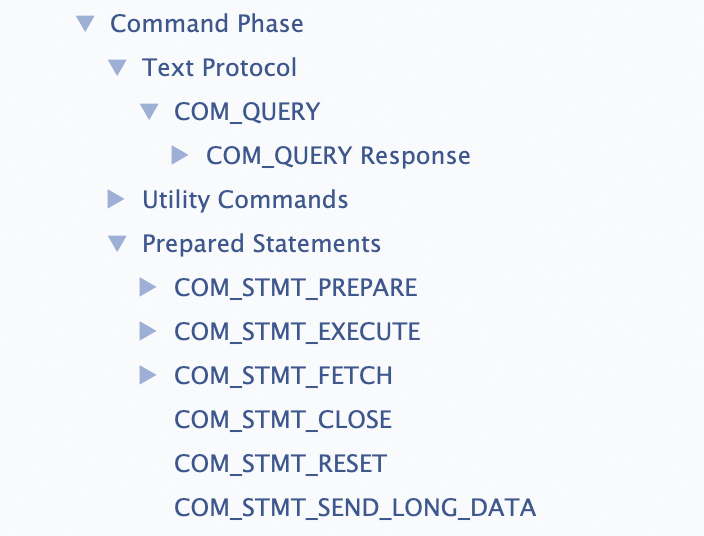
Figure 4.3 MySQL command frames
However, whether it is the MySQL protocol needs to be confirmed when entering the user state for parsing. On this basis, you can first make a simple inference in the kernel. The simple inference code is as follows:
static __inline enum protocol_type_t infer_mysql(const char* buf, size_t count) {
  static const uint8_t query = 0x03;
  static const uint8_t connect = 0x0b;
  static const uint8_t stmtPrepare = 0x16;
  static const uint8_t stmtExecute = 0x17;
  static const uint8_t stmtClose = 0x19;
     if (buf[0] == connect || buf[0] == query || buf[0] == stmtPrepare || buf[0] == stmtExecute ||
            buf[0] == stmtClose) {
          return request;
        }
  return unknown;
}The entire protocol parsing process is mainly performed in the conn tracker component. Its main capabilities include:
Specifically, in the persistent connection scenario, the basic metadata information of each data transmission, such as source IP, source port, dest IP, and dest port, is always the same. As shown in Figure 4.4, if we can maintain the connection information in the user state, then we do not have to place the related metadata in the perf buffer every time. We only need to pass the connection ID, which further reduces network bandwidth usage.
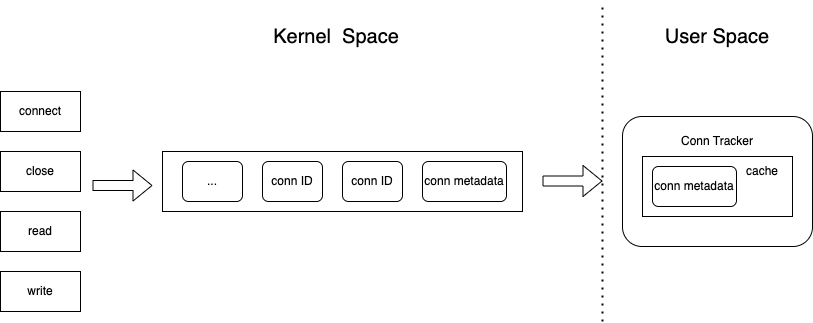
Figure 4.4 Conn tracker for connection maintenance
Moreover, some protocols such as the MySQL protocol, and some MySQL-related information such as version number, code, and other information only send packet information when the connection is established for the first time. If the connection information is not maintained in the user state, the metadata will not be parsed.
The data collected in the kernel will be placed in two queues, the receive queue and the send queue. They can also be perceived as data flows. Decomposing the data of each frame from the entire data flow is a prerequisite for protocol parsing. The basic idea is to make a judgment based on the end frame identifier of each protocol, such as the EOF frame information of MySQL response. Figure 4.5 is a schematic diagram of MySQL protocol framing.

Figure 4.5 MySQL protocol framing
After the data of each frame is decomposed, protocol parsing is performed according to each protocol.
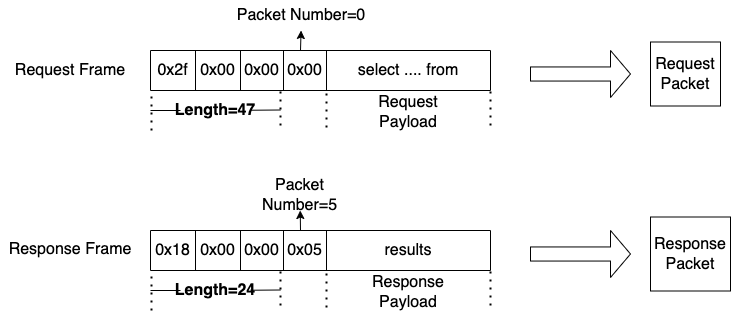
Figure 4.6 MySQL protocol parsing
In observablility, a complete request-response record is required. Take the MySQL protocol as an example. As the MySQL protocol is in chronological order, the time sequence of requests can correspond to the time sequence of responses, which always ends with EOF. EOF frames are in the following format.

Figure 4.7 MySQL response end frame (EOF)
For more information, see MySQL official documentation[2].

Figure 4.8 MySQL request-response matching
In recent years, eBPF-based products have become a focal point of observability research due to the characteristics of eBPF, which include high performance, low overhead, and non-intrusiveness. Protocol parsing is necessary for eBPF-based application monitoring. Currently, traditional protocol parsing methods suffer from high CPU and memory overhead, as well as high error rates. Therefore, an efficient protocol parsing framework has been proposed and officially released in the ARMS eBPF edition. Upon successful access, application monitoring dashboards will appear, as shown in the following figures.
The GitHub address of the test project used: alibabacloud-microservice-demo
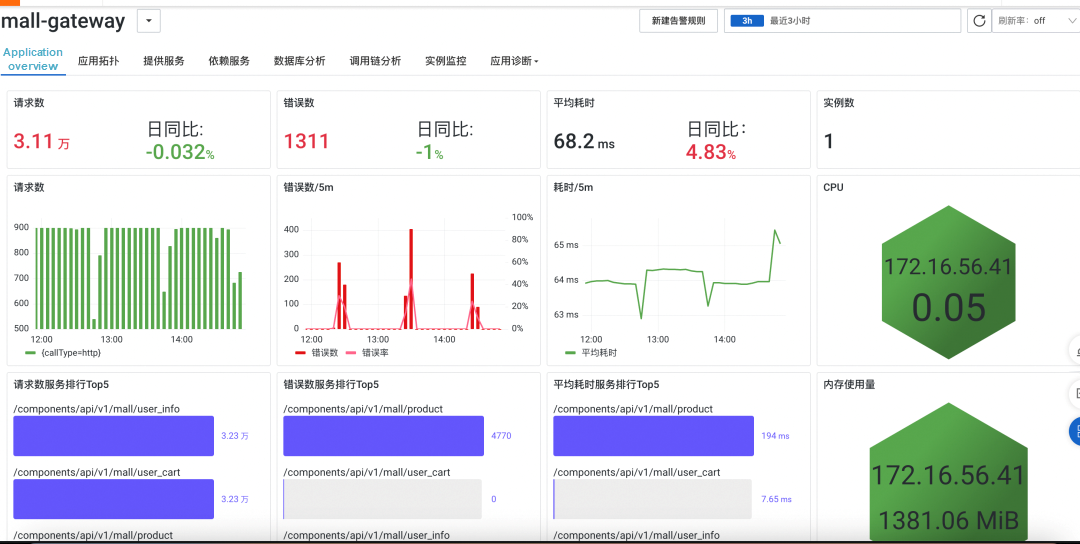
Figure 5.1 ARMS eBPF edition-Overview
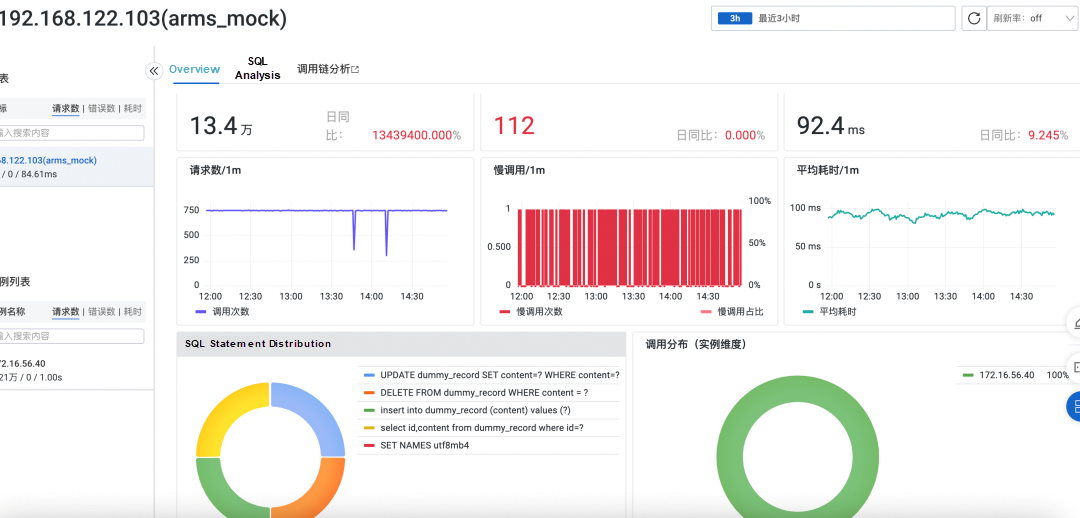
Figure 5.2 ARMS eBPF edition-Database analysis
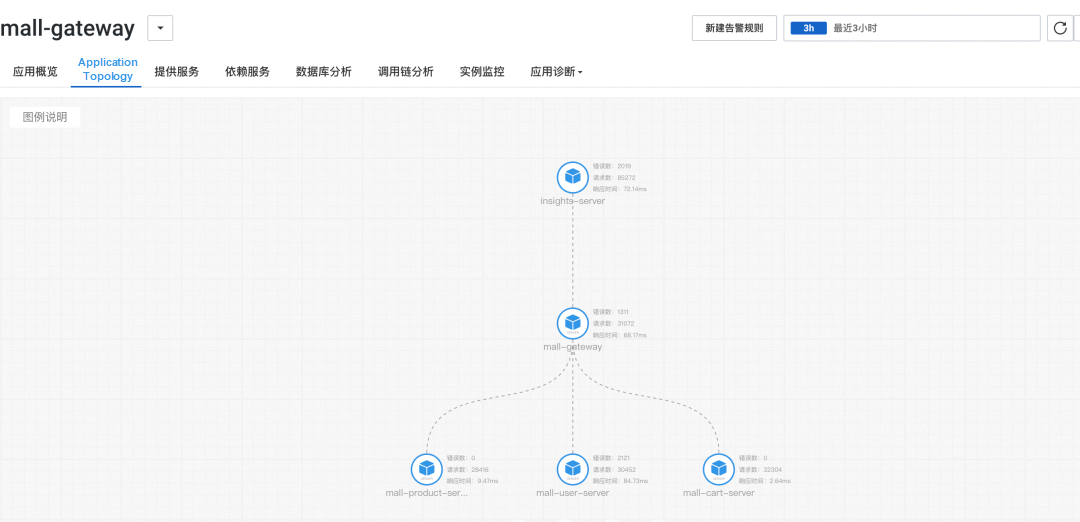
Figure 5.3 ARMS eBPF edition-Application topology
Exploring How Elastic Scheduling and Virtual Nodes Meet Instant Compute Demands
Practices for Distributed Elasticity Training in the ACK Cloud-native AI Suite

212 posts | 13 followers
FollowAlibaba Cloud Native - March 6, 2024
Alibaba Cloud Native Community - April 18, 2025
Alibaba Cloud Native - March 6, 2024
Alibaba Cloud Native Community - April 26, 2024
Alibaba Cloud Native Community - March 11, 2026
Alibaba Cloud Native Community - July 26, 2022

212 posts | 13 followers
Follow Application Real-Time Monitoring Service
Build business monitoring capabilities with real time response based on frontend monitoring, application monitoring, and custom business monitoring capabilities
Learn More Alibaba Cloud Linux
Alibaba Cloud Linux is a free-to-use, native operating system that provides a stable, reliable, and high-performance environment for your applications.
Learn More Managed Service for Prometheus
Multi-source metrics are aggregated to monitor the status of your business and services in real time.
Learn More Real-Time Livestreaming Solutions
Stream sports and events on the Internet smoothly to worldwide audiences concurrently
Learn MoreMore Posts by Alibaba Cloud Native