By Xiayu and Xiheng
Container network jitter is one of the most challenging network issues to locate and resolve because it occurs infrequently and within a short time frame. Additionally, continuous monitoring of the network status in Kubernetes clusters is crucial for efficient cluster operation and maintenance.
KubeSkoop leverages eBPF technology to provide real-time network monitoring capabilities at the pod level with low overhead and hot-pluggable features. It not only fulfills the requirements for daily network monitoring but also enables quick identification and resolution of network problems through corresponding probes. KubeSkoop offers Prometheus-based metrics and Grafana dashboards, as well as exceptional event disclosure capabilities using command lines and Loki to provide detailed information about the problematic scenario.
This article will cover the following topics:
• How do applications in containers receive or send data packets?
• Challenges in troubleshooting network problems and the limitations of traditional network troubleshooting tools.
• A brief introduction to KubeSkoop and its network monitoring component (KubeSkoop exporter).
• Detailed description of the probes, metrics, and events of the KubeSkoop exporter based on different kernel modules.
• General process of using the KubeSkoop exporter for daily monitoring and exception troubleshooting.
• Future plans for the KubeSkoop exporter.
In a network, data is transmitted in packets. In the Linux system, a data packet needs to go through multiple layers of the kernel for processing before it can be received or sent by an application.
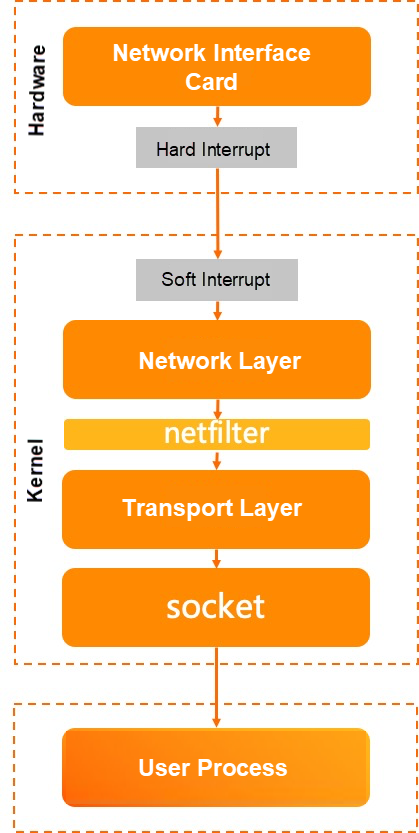
Let's look at the reception process:
• When the network card driver receives a network packet, it triggers an interrupt.
• After the kernel's ksoftirqd is scheduled, it retrieves the data and enters the protocol stack for processing.
• The packet enters the network layer and goes through netfilter for processing before entering the transport layer.
• Once the transport layer processes the packet, it places the payload of the packet into the socket receiving queue, wakes up the application process, and yields the CPU.
• When the application process is scheduled, the user state of data collection is processed through a system call.
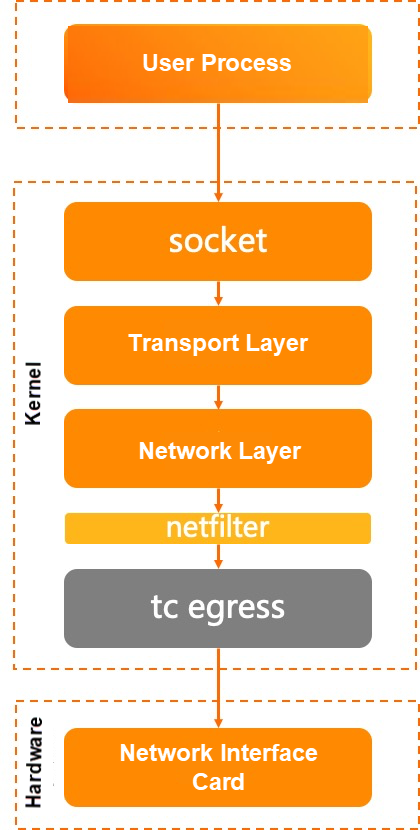
Let's look at the sending process:
• The application writes data to the socket send queue through a system call.
• In kernel mode, the socket invokes the transport layer to send packets.
• The transport layer assembles the packets and calls the network layer to send them.
• After being processed by netfilter, the packets enter tc egress.
• tc qdisc sequentially calls the network card driver to send the packets.
In the reception process, we didn't pay attention to the tc processing, but in the sending process, we emphasized it as it is also one of the common causes of packet loss in links.
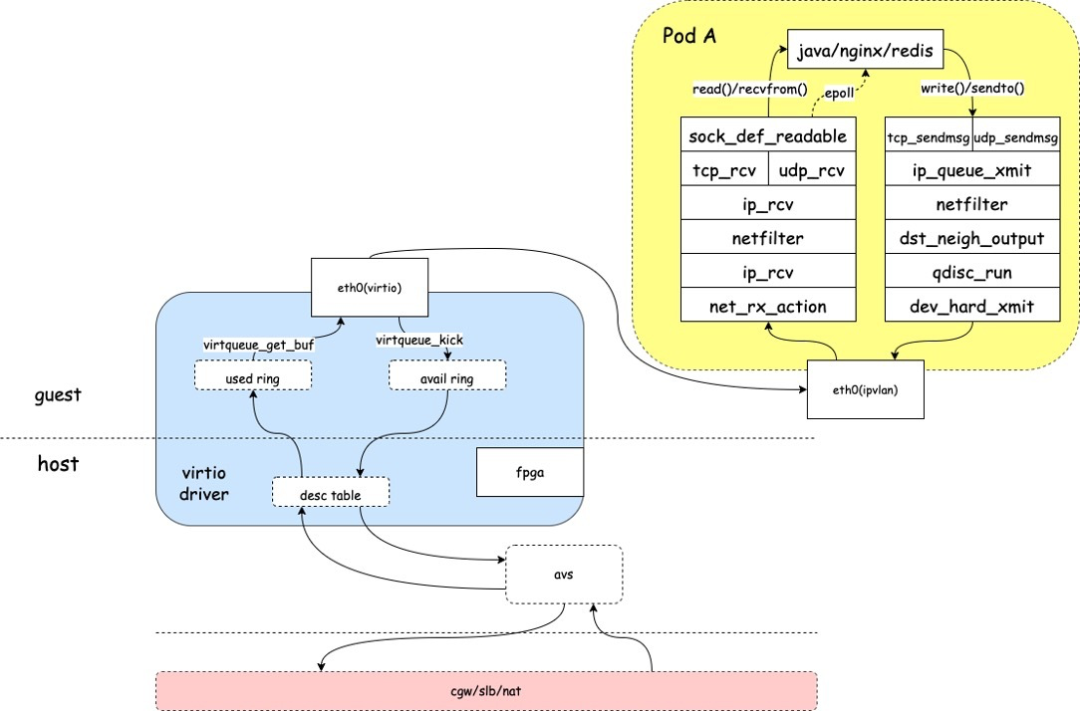
As seen from the above explanation, a packet needs to go through complex processing steps in the Linux kernel. The kernel's network subsystem has numerous modules, and the code is extensive and complex, which adds to the difficulty of troubleshooting network problems. The long path from packet receiving to sending poses considerable challenges in locating problems. Additionally, network-related systems have various parameters and intricate configurations. Some network issues arise due to restrictions on these functions or parameters, requiring significant time for problem identification. Moreover, system disk, scheduling, and business code defects can manifest as network problems, necessitating comprehensive observation of the system's status.
Next, let's introduce common network troubleshooting tools in the Linux environment and the technologies behind them.
The tools provided by net-tools can be used to view network statistics, including the current state of the network and abnormal statistics count.
These tools obtain the current network status and exception count through the /proc/snmp and /proc/netstat files in procfs. They are known for their high performance and low overhead, but they provide limited information and cannot be customized.
Procfs is a virtual file system provided by Linux that offers system operation information, process information, and counter information. User processes access the files provided by procfs, such as /proc/net/netstat or /proc//net/snmp, through the write() or read() system call functions. The procfs implementation in the kernel returns information to the user through the virtual file system vfs.
Similar commands to the net-tools toolkit include nstat, sar, and iostat.
The ip and ss tools in the iproute2 toolkit also provide various utility tools for viewing network statistics and network status. However, their principle is different from tools like netstat as they obtain information through netlink. Compared to net-tools, they can provide more comprehensive network information and better scalability, but their performance is slightly lower than using procfs.
Netlink is a special socket type in Linux that allows user programs to communicate with the kernel through standard socket APIs. User programs send and receive data through sockets of the AF_NETLINK type, and user requests are processed in the kernel through the socket layer.
Similar commands include tc, conntrack, and ipvsadm.
bcc-tools offers a variety of observation tools in kernel mode, including network, disk, and scheduling. Its core implementation is based on eBPF counting, which provides strong extensibility and good performance, but it has a higher usage threshold compared to the above tools.
eBPF is a relatively new technology in Linux and has gained significant attention in the community. It is a small virtual machine in the kernel that allows users to dynamically load and run their own code in the kernel. The kernel verifies the security of the program and ensures that custom eBPF code does not cause kernel abnormalities.
Once an eBPF program is loaded into the kernel, it can exchange data with user-state programs through maps. User processes can retrieve map data through the bpf() system call in the user state, and the eBPF program can also use kernel APIs to actively update map data for communication between the kernel and user processes.
Similar tools to bcc-tools include bpftrace, systemtap, and others.
The preceding tools provide rich status information to help troubleshoot network problems in the system, they have limitations in complex cloud-native container scenarios:
• Most traditional tools observe based on the local host or network namespace, making it challenging to target specific containers.
• Observing complex topologies without sufficient kernel troubleshooting experience can be difficult.
• Catching occasional problems in real-time is challenging with these tools.
• Although these tools provide a wealth of information, the correlation between the information is not always clear.
• Some observation tools themselves may introduce performance issues.
| procfs | netlink | eBPF | |
| Usability | High | Medium | Medium |
| Cloud-native adaptation | Low | Low | Low |
| Scalability | Low | Medium | High |
| Performance sensitive | Low | Medium | Medium |
| Traceability | Not supported | Not supported | Not supported |
| Ease of use | Low | Medium | High |
Based on the complex links of Linux network processing mentioned above, as well as the limitations of traditional tools in cloud-native container scenarios and the network observation requirements of cloud-native environments, the KubeSkoop project was created.
Before we delve into the network monitoring aspect of KubeSkoop, let's have an overview of the project as a whole.
KubeSkoop is an automatic diagnosis system for container network problems. It offers quick diagnostics for persistent network issues, such as DNS resolution exceptions and service inaccessibility. It also provides real-time monitoring for network jitter issues, such as increased latency, occasional resets, and packet loss. KubeSkoop includes features like quick end-to-end diagnostics, network station latency analysis, and identification and backtracking of network exceptional events.
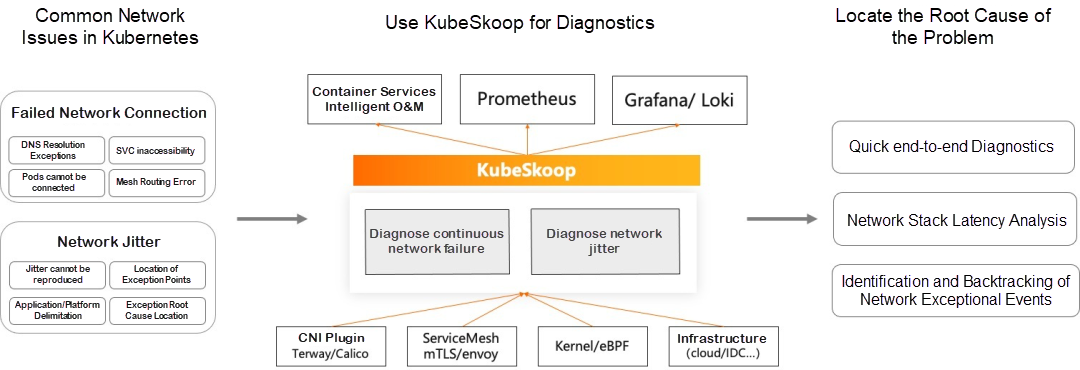
In this article, we will focus on the network monitoring capability of KubeSkoop.
KubeSkoop exporter monitors container network exceptions by utilizing multiple data sources such as eBPF, procfs, and netlink. It provides pod-level network monitoring capability and offers network monitoring metrics, network exceptional event records, and real-time event streams. The exporter covers complete protocol stacks, including drivers, netfilter, and TCP, as well as dozens of exception scenarios. It can also connect with observable systems like Prometheus and Loki on the cloud.
For different modules in the kernel, the KubeSkoop exporter provides various probes to collect information. It also supports hot plugging and loading probes on demand. The enabled probes will present the collected statistics or network exceptions in the form of Prometheus metrics or exceptional events.
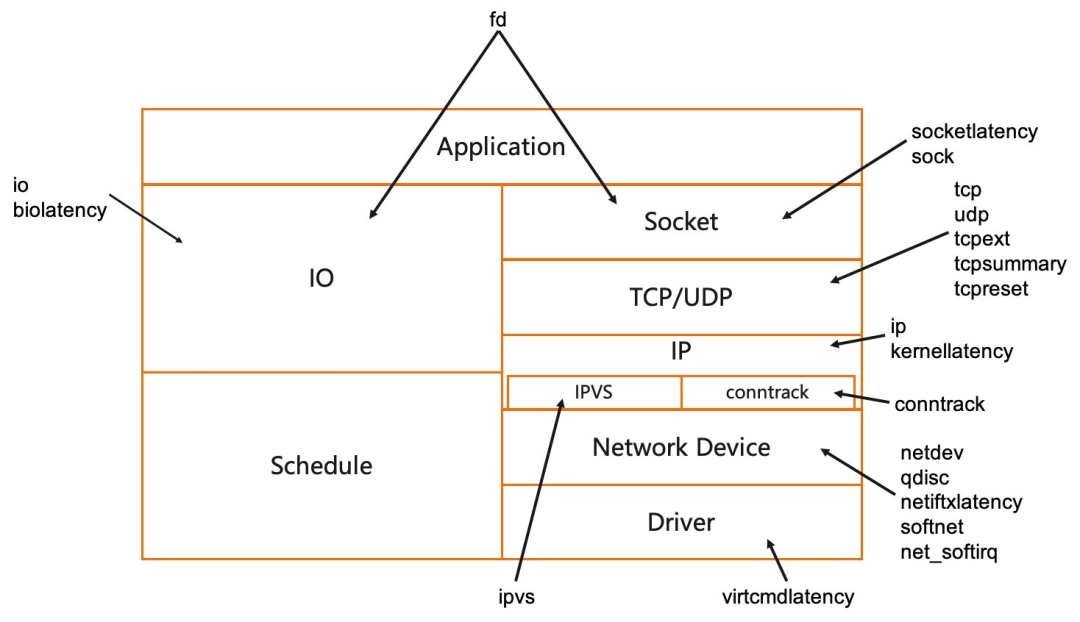
The KubeSkoop exporter offers a variety of probes for different modules in the kernel, catering to various observation requirements and network problems.
Metrics provide statistical data summarizing key information about the network from the perspective of pods, such as the number of connections and retransmissions. This information allows you to track the network status changes over time and gain a better understanding of the current network condition within the container.
Events are generated when network exceptions occur, such as packet loss, TCP reset, and data processing latency. Compared to metrics, events provide more detailed information about the specific scenarios where problems occur, including the exact location of packet loss and detailed latency statistics. Events are particularly useful for in-depth observation and problem localization in specific network exceptions.
In this section, I will describe the probes currently offered by KubeSkoop, including their functions, applicable scenarios, overheads, and the metrics or events they provide.
For further information on probes, metrics, and events, please refer to the KubeSkoop documentation available at https://kubeskoop.io
The socketlatency probe tracks the symbols related to sockets and the upstream and downstream in the kernel to gather information about the latency of user state data from socket data preparation to data reading, and from socket data reception to passing it to the TCP layer for processing. This probe primarily focuses on the latency of user state data reading when the data reaches the socket layer. The probe provides metrics and events related to socket read or write latency.
Overhead: High
Applicable scenarios: When there is suspicion that the process is slow in reading data due to reasons such as delayed scheduling and processing.
Common problems: Network jitter caused by CPU overrun in a container process.
The data for the sock probe is collected from the /proc/net/sockstat file. The sock probe provides statistics on sockets in pods, including the number of sockets in different states of TCP (inuse, orphan, and tw), and memory usage. Issues such as application logic and system parameter configuration can cause socket and tcpmem exhaustion, leading to connection failures and impacting concurrency performance. This probe has very low overhead, making it suitable for monitoring the general state of connections on a daily basis.
Overhead: Low
Applicable scenarios: Daily monitoring of connection status, socket leaks, reuse, and excessive socket memory usage.
Common problems: Continuous increase in memory usage due to socket leaks. Connection failures or occasional RST events caused by excessive connections, reuse, and tcpmem exhaustion.
Basic information about the TCP or UDP protocol layer is collected from the /proc/net/netstat and /proc/net/snmp files. This includes the number of new TCP connections or successful connections, the number of retransmitted packets, and the count of UDP protocol errors. tcpext also provides more detailed TCP metrics, such as statistics on sent RST packets. This probe provides key information for exceptions related to TCP/UDP connections, such as uneven load, connection establishment failure, and abnormal connection closure. It serves as a probe based on procfs to collect information and can be used for daily observation of traffic status.
Overhead: Low
Applicable scenarios: Daily monitoring of TCP and UDP status. Collection of information related to TCP connection exceptions, connection establishment failures, reset packets, and DNS resolution failures.
Common problems: Abnormal closure of application connections and latency jitter caused by retransmissions.
The tcpsummary probe communicates with the kernel using netlink messages (SOCK_DIAG_BY_FAMILY) to obtain all TCP connection information within the pod. It then aggregates the TCP connection status and the status of the send and receive queues to generate metrics. Please note that in high-concurrency scenarios with a large number of connections, there may be significant overhead.
Overhead: Medium
Applicable scenarios: The status information of TCP connections is provided in scenarios such as occasional latency and connection failures.
Common problems: Packet loss caused by a hung user-state process and accumulated receive queues.
The tcpreset probe generates events by tracing the tcp_v4_send_reset and tcp_send_active_reset calls in the kernel. It records socket information and status when an RST packet is sent in a TCP connection. The same information is recorded when the tcp_receive_reset is called, which is when an RST packet is received. Since this probe traces the cold path in the kernel, it has low overhead. We recommend enabling this probe only when a tcp reset issue occurs.
Overhead: Low
Applicable scenarios: Trace the reset location in the kernel when a TCP connection is reset.
Common problems: The timeout period between the client and the server causes occasional connection reset.
The IP probe collects IP-related information metrics from the /proc/net/snmp file. It includes counters for cases where the routing destination address is unreachable and the length of the data packet is less than the length indicated in the IP header. These counters can help determine cases where packet loss occurs due to the above two reasons. The probe has very low overhead, and we recommend enabling it for daily monitoring scenarios.
Overhead: Low
Applicable scenarios: Daily monitoring of IP-related status, and problems such as packet loss.
Common problems: Packet loss caused by unreachable destination due to incorrect routing settings on the node.
The kernellatency probe records the time of multiple key points in the packet receiving and sending process. It calculates the processing latency of packets in the kernel and provides metrics for the latency in processing received and sent packets. It also generates events, including the processing time between the packet quintuple and various points in the kernel. This probe involves time statistics for all packets and a large number of map query operations, making it expensive. Therefore, we recommend enabling this probe only when related problems occur.
Overhead: High
Applicable scenarios: Connection timeout and network jitter
Common problems: High kernel processing latency caused by too many iptables rules.
The ipvs probe collects information from the /proc/net/ip_vs_stats file and provides statistical counts related to IPVS (IP Virtual Server). IPVS is a part of the Linux kernel that implements Layer 4 load balancing. It is used in kube-proxy IPVS mode. The metrics provided by the probe include the number of IPVS connections and the number of inbound/outbound packets and data bytes. This probe is suitable for daily monitoring of IPVS statistics and can be used as a reference for troubleshooting network jitter or connection establishment failures when accessing the service IP address.
Overhead: Low
Applicable scenarios: Daily monitoring of IPVS-related status.
Common problems: None
The conntrack probe provides statistics for tracking conntrack modules through netlink. Using the netfilter framework provided by the kernel, the conntrack module tracks data traffic above the network layer. It records information such as the creation time, number of packets, and number of bytes for each connection. It also allows for upper-layer operations, such as nat, based on information matching. The metric of the probe provides a statistical count of the entries in each state in the current conntrack, as well as the number of current entries and the upper limit of entries in the conntrack. However, it should be noted that the probe may have a significant overhead in high concurrency scenarios due to the need to traverse all conntrack entries.
Overhead: High
Applicable scenarios: Connection establishment failures, packet loss, and conntrack streaming.
Common problems: Connection establishment failure and packet loss caused by conntrack overflow.
The netdev probe collects /proc/net/dev files to provide network device-level statistical metrics. It includes information such as the number of sent/received bytes, number of errors, number of packets, and number of lost packets. The probe is usually used to identify network problems in a broader scope and is valuable in scenarios such as occasional TCP handshake failures. The probe has a very low overhead and is recommended to be enabled on a daily basis.
Overhead: Low
Applicable scenarios: Daily monitoring, network jitter, packet loss at the bottom of the device, and so on.
Common problems: Network jitter or connection failure caused by network device packet loss.
The qdisc probe uses netlink to provide statistical metrics for tc qidsc. It includes statistics on the traffic passing through qdisc and statistics on the qdisc queue status. tc qdisc is a module used to control the traffic of network devices in the Linux kernel. It controls the sending of data packets based on scheduling rules. The qdisc rules on the network card may lead to packet loss or high latency. The probe has a low overhead and is recommended to be enabled on a daily basis.
Overhead: Low
Applicable scenarios: Daily monitoring, network jitter, and packet loss.
Common problems: Packet loss due to qdisc queue overrun and network jitter.
The netiftxlatency probe tracks the key positions in the kernel's network device processing and calculates the latency. It mainly focuses on the time consumed by qdisc to process packets and the time consumed by the underlying device to send packets. It provides statistics on the number of packets whose latency exceeds a certain threshold and exceptional events containing the packet quintuple information. The probe calculates the latency of all packets, resulting in a high overhead. It is recommended to enable the probe when latency issues occur.
Overhead: High
Applicable scenarios: Connection timeout and network jitter.
Common problems: Latency increases due to underlying network jitter.
The softnet probe collects data from the /proc/net/softnet_stat file interface in the kernel and aggregates metrics at the pod level. It integrates the data packets collected by the network card using CPU processing. It represents the state of the soft interrupt processing process in which data packets enter the Linux kernel from the network card device. It provides an overview of the received and processed data packets. We recommend enabling this probe as it has minimal overhead for identifying network problems at the node level.
Overhead: Low
Applicable scenarios: Daily monitoring, and is able to help with node-level network issues.
Common problems: None
The net_softirq probe collects scheduling and execution duration data for two types of network-related interrupts (netif_tx and netif_rx) through kernel mode programs. It includes the time from the initiation of a soft interrupt to the start of execution, and the time from the start of execution to the completion of the execution of a soft interrupt. It also provides statistics on packets that exceed a certain threshold as metrics or events.
Overhead: High
Applicable scenarios: Occasional latency and network jitter.
Common problems: Network jitter caused by soft interrupt scheduling latency due to CPU contention.
The virtcmdlatency probe calculates the execution time of the method (virtnet_send_command) specified by the kernel to call virtualization. It measures the time taken by the virtual machine to execute the virtualization call. It provides metrics and events whenever a latency occurs. virtio is a common virtualization network solution. Due to its paravirtualization feature, the operation of the virtual machine on the network card device driver may be delayed due to the blocking of the underlying physical machine. This probe has a high overhead. We recommend enabling it when suspecting network jitter caused by the host.
Overhead: High
Applicable scenarios: Occasional latency and network jitter.
Common problems: Network jitter caused by resource contention between underlying physical machines.
The FD probe collects the handles of all processes in a pod to obtain the number of file descriptors and socket file descriptors that are opened in the pod processes. The probe needs to traverse all the FDs of the processes, resulting in high overhead.
Overhead: High
Applicable scenarios: FD leakage and socket leakage.
Common problems: Because the socket is not closed by the user-mode program, leakage is generated, which causes TCP OOM. The TCP OOM further results in network jitter.
The IO probe collects data from the file interface provided by /proc/io to represent the rate and total amount of file system I/O performed by a single pod. The metrics provided by the probe include the number of file system read and write operations, as well as the number of bytes. Some network problems may be caused by other processes on the same node performing a large amount of I/O, resulting in slow response to user processes. In such cases, you can enable the probe for verification as needed, and use it for daily monitoring of pod I/O.
Overhead: Low
Applicable scenarios: Increased latency and retransmission due to slow response to user processes.
Common problems: Network jitter caused by a large number of file reads and writes.
The biolatency probe tracks the execution time of block device read and write calls in the kernel. It identifies executions that exceed a certain threshold as exceptional events. If the I/O latency of a device increases, it may affect the business processing of user processes, resulting in network jitter. If you suspect that a network exception is caused by I/O latency, you can enable this probe. The probe needs to count the read and write operations of all block devices. The overhead is medium. We recommend enabling it as needed.
Overhead: Medium
Applicable scenarios: Network jitter and increased latency caused by slow I/O reads and writes
Common problems: Network jitter caused by block device read/write latency.
The KubeSkoop exporter is useful for both daily monitoring and troubleshooting network exceptions. In the following section, I will provide a brief introduction on how to use it in different scenarios.
For daily monitoring, it is recommended to use Prometheus to collect the metrics provided by the KubeSkoop exporter. Optionally, you can use Loki to collect logs for exceptional events. The collected metrics and logs can be displayed on the Grafana dashboard. KubeSkoop exporter also provides pre-built Grafana dashboards that you can use directly.
After configuring the metrics collection and dashboards, you will also need to configure the KubeSkoop exporter itself. In daily monitoring, to avoid impacting business traffic, you can selectively enable low-overhead probes such as porcfs-based probes and some netlink and eBPF-based probes. If you are using Loki, you will also need to configure its service address and enable it. Once these preparations are complete, you will be able to see the enabled metrics and events on the dashboard.
In daily monitoring, it is important to pay attention to exceptions in sensitive metrics. For example, abnormal increases in the number of new connections, connection establishment failures, or reset packets. For these metrics that clearly indicate exceptions, you can configure alerts to quickly troubleshoot problems and restore normal operation.
When you suspect network exceptions based on daily monitoring, service alerts, or error logs, it is important to classify the types of network exceptions, such as TCP connection failures, network latency, and jitter. Simple classification can help establish the direction for troubleshooting.
Based on the different types of problems identified, you can enable the appropriate probes. For example, if you are experiencing network latency and jitter, you can enable the socketlatency probe to focus on the latency of applications reading data from the socket, or enable the kernatency probe to track latency within the kernel.
Once these probes are enabled, you can use the configured Grafana to observe the metrics or event results exposed by the probes. You can also use pod logs or the inspector command in the exporter container to observe exceptional events. If the results of the enabled probes are not abnormal, or if you cannot determine the root cause of the problem, you can consider enabling other probes to further assist in problem localization.
Based on the obtained metrics and exceptional events, you will eventually identify the root cause of the problem. The root cause may be due to adjustments in system parameters or issues within the user's program. You can make adjustments to these system parameters or optimize the program code based on the identified root cause.
This sharing focuses on the network monitoring capabilities of the KubeSkoop project. It provides an overview of the metrics offered by the KubeSkoop exporter and general methods for daily use and troubleshooting. It can help you better observe and troubleshoot network problems using the project.
The KubeSkoop project is still in its early stages. If you encounter any problems while using it, you can raise an issue on the Github project homepage [1] to communicate with us. We also encourage your participation in the project to contribute to its development!
[1] Github project homepage
https://github.com/alibaba/kubeskoop
Building Microservices Applications Based on Static Compilation

677 posts | 56 followers
FollowAlibaba Cloud Native Community - December 13, 2023
Alibaba Cloud Native Community - December 11, 2023
Alibaba Cloud Native Community - December 11, 2023
Alibaba Container Service - November 15, 2024
OpenAnolis - March 25, 2026
OpenAnolis - September 4, 2025

677 posts | 56 followers
Follow Container Service for Kubernetes
Alibaba Cloud Container Service for Kubernetes is a fully managed cloud container management service that supports native Kubernetes and integrates with other Alibaba Cloud products.
Learn More Container Compute Service (ACS)
A cloud computing service that provides container compute resources that comply with the container specifications of Kubernetes
Learn More ACK One
Provides a control plane to allow users to manage Kubernetes clusters that run based on different infrastructure resources
Learn More Cloud-Native Applications Management Solution
Accelerate and secure the development, deployment, and management of containerized applications cost-effectively.
Learn MoreMore Posts by Alibaba Cloud Native Community