By Zaifeng
As one of the most popular relational database management systems, MySQL has existed in the backend storage of many systems and is widely used in all walks of life. At the same time, as the core component of application services, the database directly affects the operation of application services. The bottleneck of the database is often the bottleneck of the entire system. Therefore, it is essential to monitor MySQL. Detecting exceptions in MySQL operation in a timely manner can improve system availability and user experience. Therefore, it is an important task for the O&M Team to observe the key metrics of MySQL and monitor the availability and performance of databases in real-time.
Before building a MySQL metric observation system, we need to sort the dimensions and metrics we pay attention to in the daily O&M process to complete the task better and faster. Google proposes Latency, Traffic, Saturation, and Errors as the golden metrics for system monitoring. As MySQL emerges as a resource service system, we refine the metrics from five dimensions: availability, database connection, query, traffic, and file.
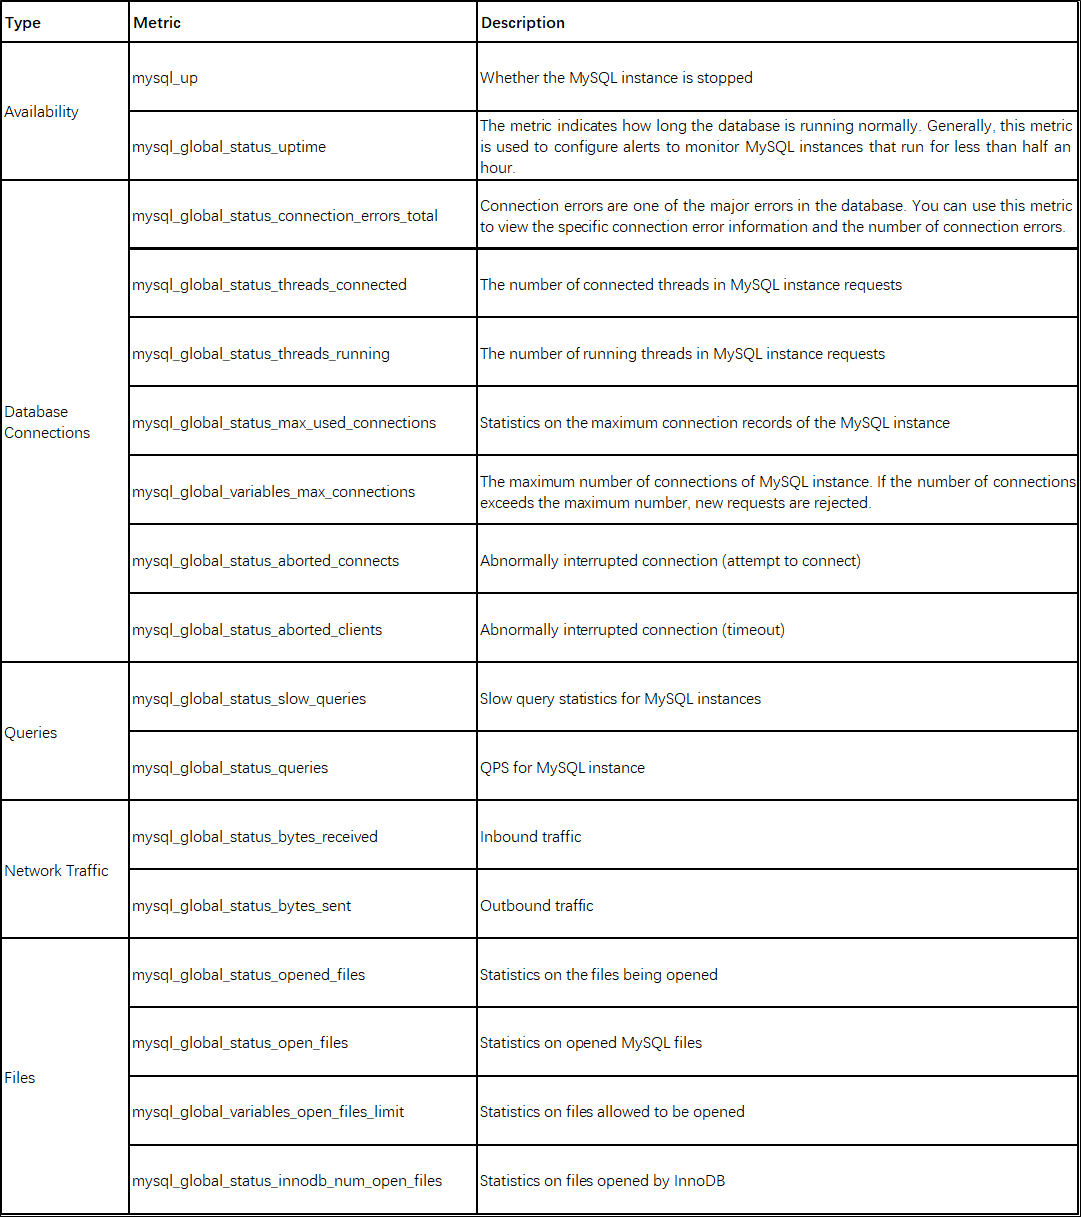
After designing the required observation metrics, we can select the corresponding observation tools. As the most popular database, MySQL has a wide range of monitoring tools for us to choose from (such as MySQL Enterprise Monitor, Prometheus, and other database-based, commercial, open-source tools with different attributes).
Prometheus has become the best choice for MySQL metric monitoring in the cloud-native era, as it meets enterprise-level requirements (such as open-source friendliness, avoiding vendor lock-in, and building a multi-cloud full-stack observable system). Prometheus has MySQL Exporter specially designed and developed by the community for collecting MySQL database monitoring metrics.
Compared with self-managed Prometheus, Alibaba Cloud Prometheus needs to deploy Exporter, pass in the connection information of MySQL instances, configure service discovery, and create dashboards. Alibaba Cloud Prometheus Monitoring integrates with MySQL Exporter quickly and provides an out-of-the-box dedicated monitoring dashboard and alerts. It makes configurations and operations automatic, reducing the workload of configuration services.
Based on Alibaba Cloud practices, it transforms the common MySQL alert rules into preset templates to help O&M teams quickly build kanban and alert systems without worrying about refining their experience or selecting alert metrics.
mysql_up{${instance}} != 1mysql_global_status_uptime{${instance}} < 1800rate(mysql_global_status_slow_queries{${instance}}[5m]) > 0rate(mysql_global_status_connection_errors_total{${instance}}[5m]) > 0100 * mysql_global_status_threads_connected{${instance}}
/ mysql_global_variables_max_connections{${instance}} > 90Note: When the usage reaches a certain threshold, the MySQL instance starts to reject connections. You can solve the problem by increasing the number of connections. However, before you increase the number of connections, be sure to check the number of files that can be opened on the current system using the following statement:
mysql_global_variables_open_files_limit - mysql_global_variables_innodb_open_filesrate(mysql_global_status_innodb_log_waits{${instance}}[5m])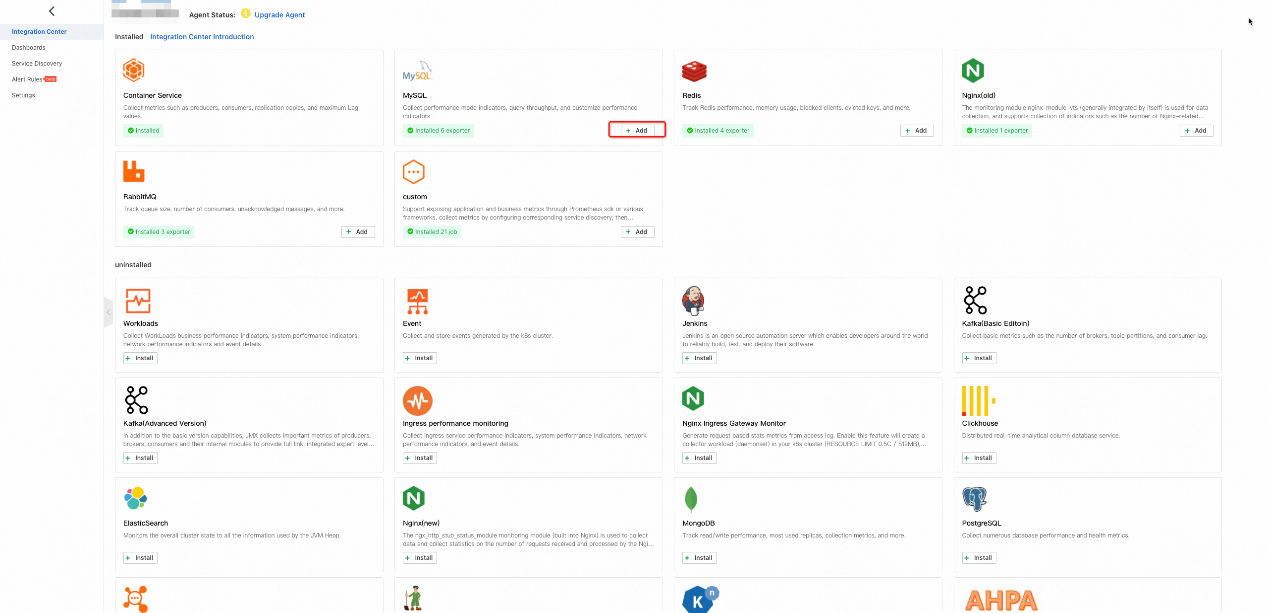
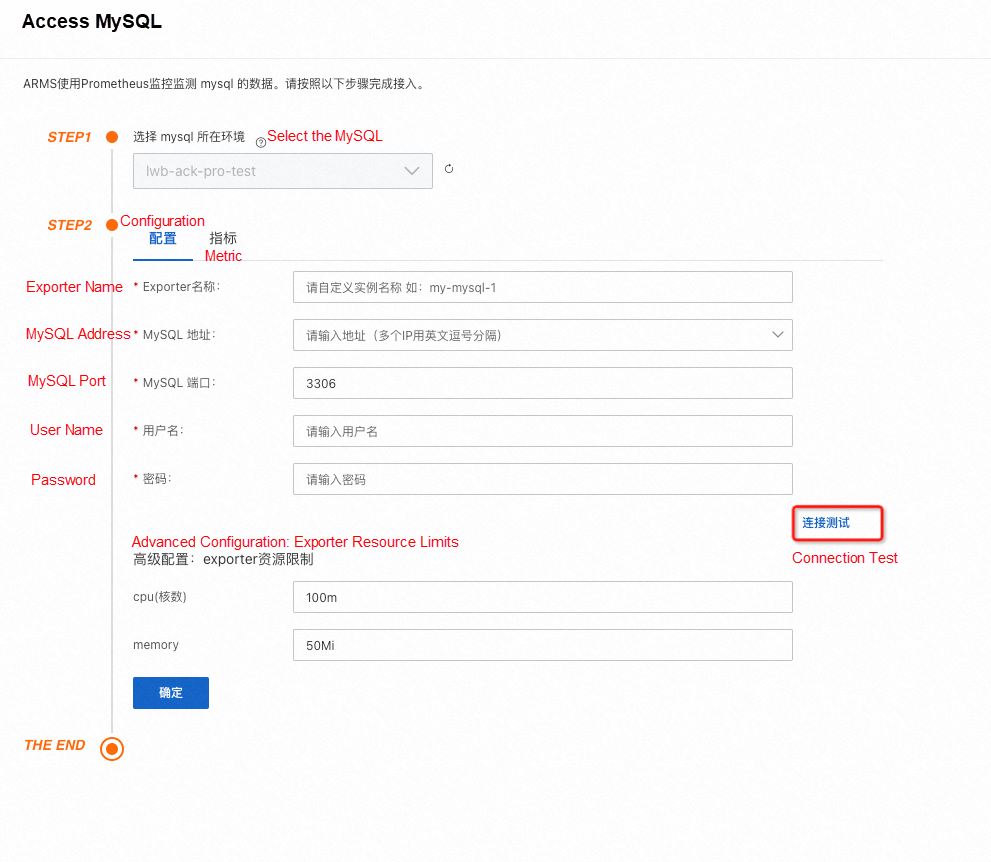
Note: Connectivity can be checked through the connection test.
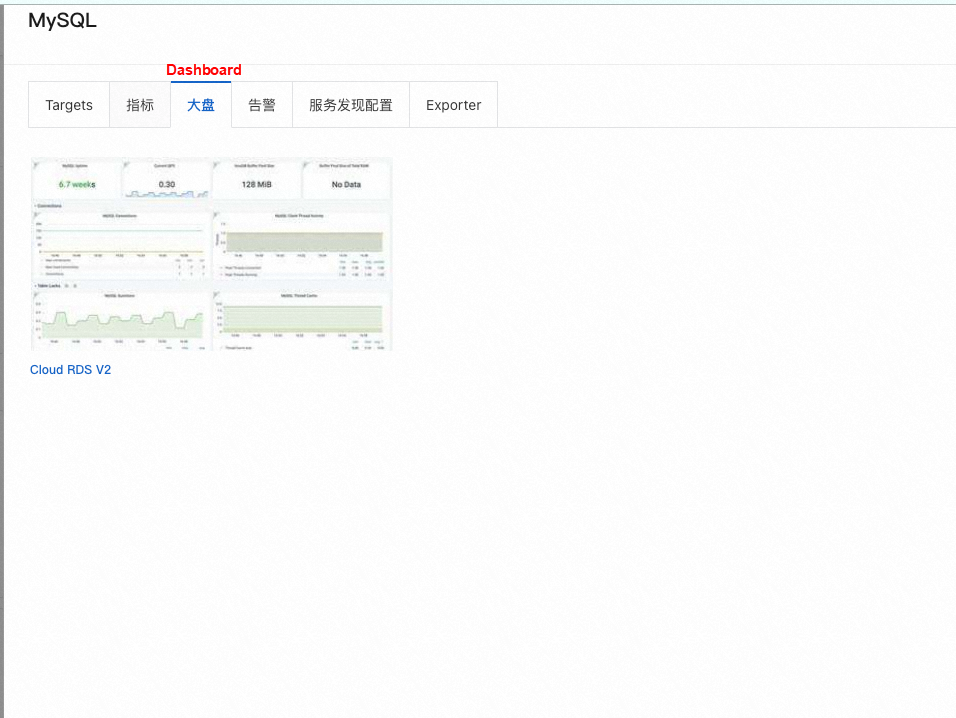
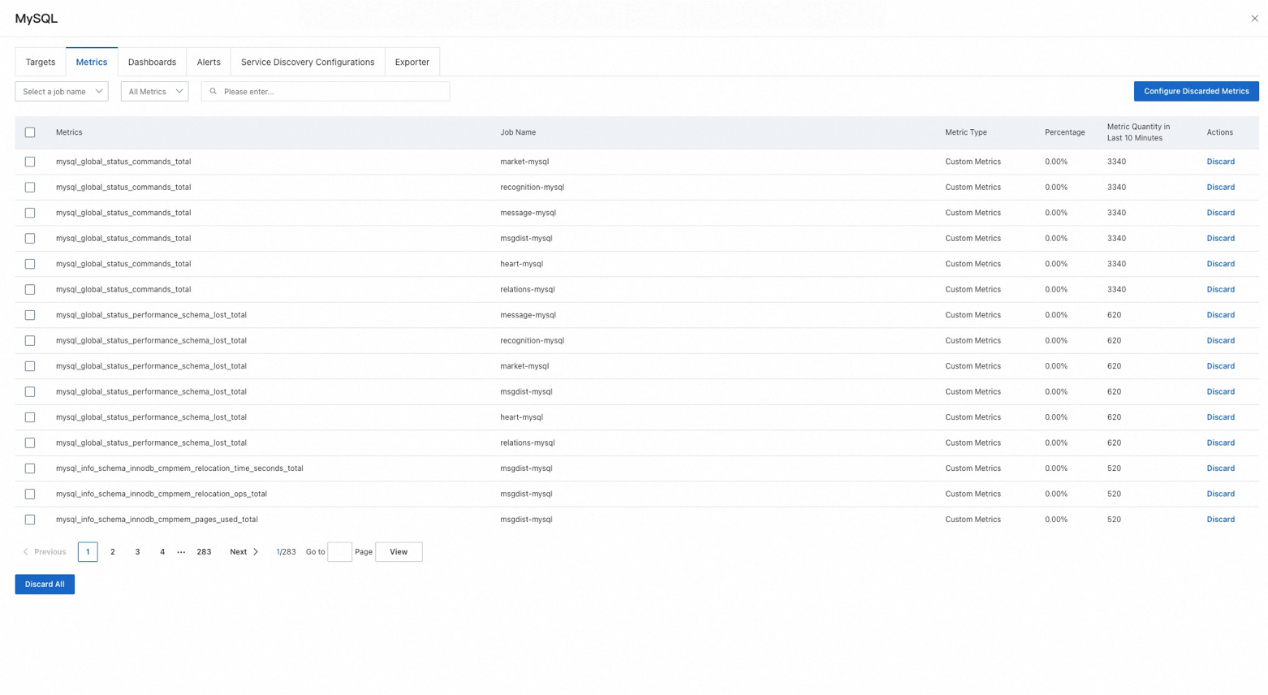
Alibaba Cloud Prometheus Service provides many default Prometheus alert rules, focusing on hotspot metrics for MySQL integration.
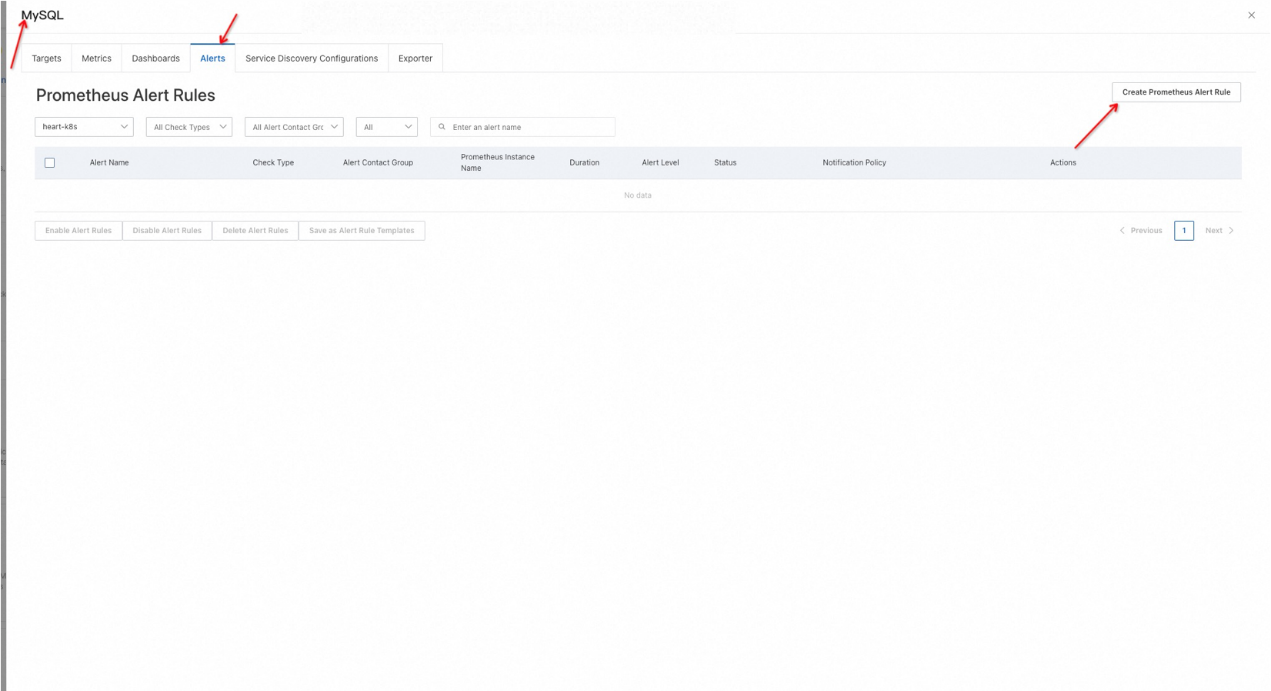
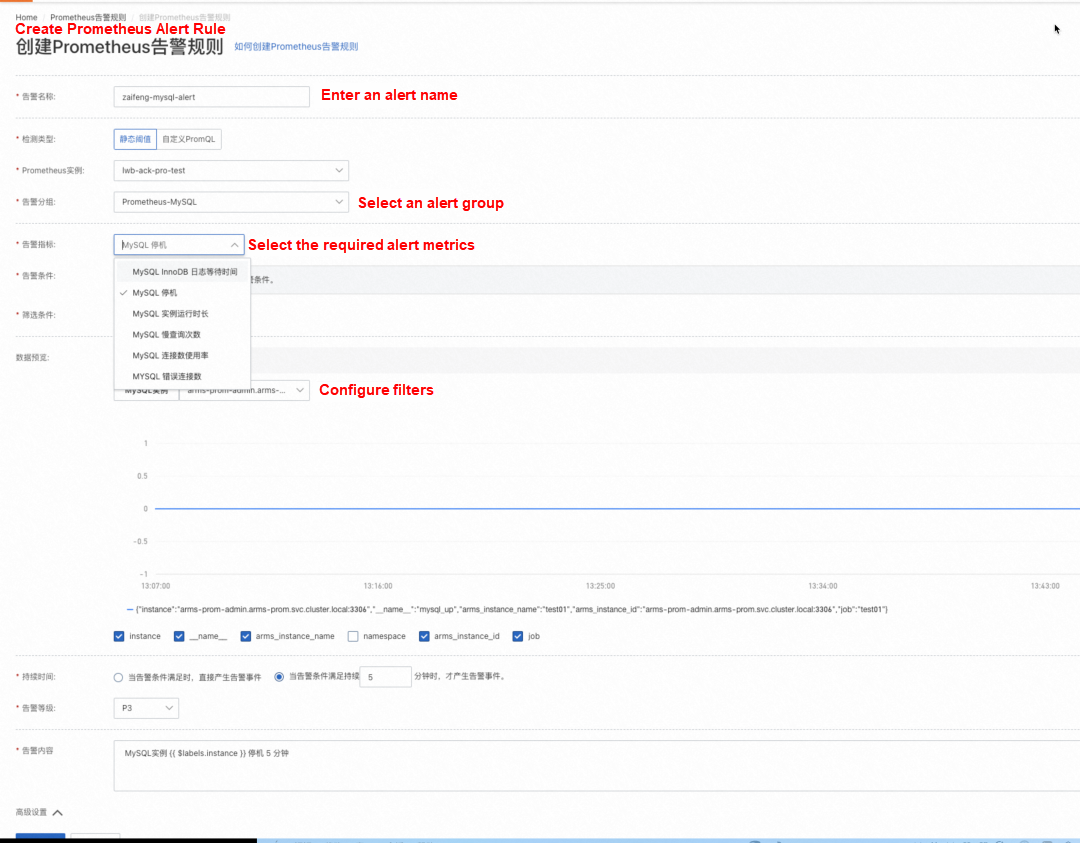
Prometheus Service creates a MySQL monitoring dashboard based on hot metrics. You can use the dashboard to view monitoring data (such as availability, database query, network traffic, connections, and memory).


Alibaba Cloud Prometheus Service is a fully managed observation service built based on the cloud-native observability standard, open-source Prometheus. By default, it integrates common cloud services and is compatible with mainstream open-source components. The service provides comprehensive observation of businesses, applications, middleware, and systems. In addition, it uses an out-of-the-box Grafana dashboard and intelligent alerting feature to optimize probe performance and system availability, helping enterprises quickly build a comprehensive metric observation system. Therefore, enterprises can quickly identify and locate problems in businesses, reduce the impact of faults on businesses, and eliminate the workload of system construction and routine maintenance, thus effectively improving the efficiency of O&M and observation.
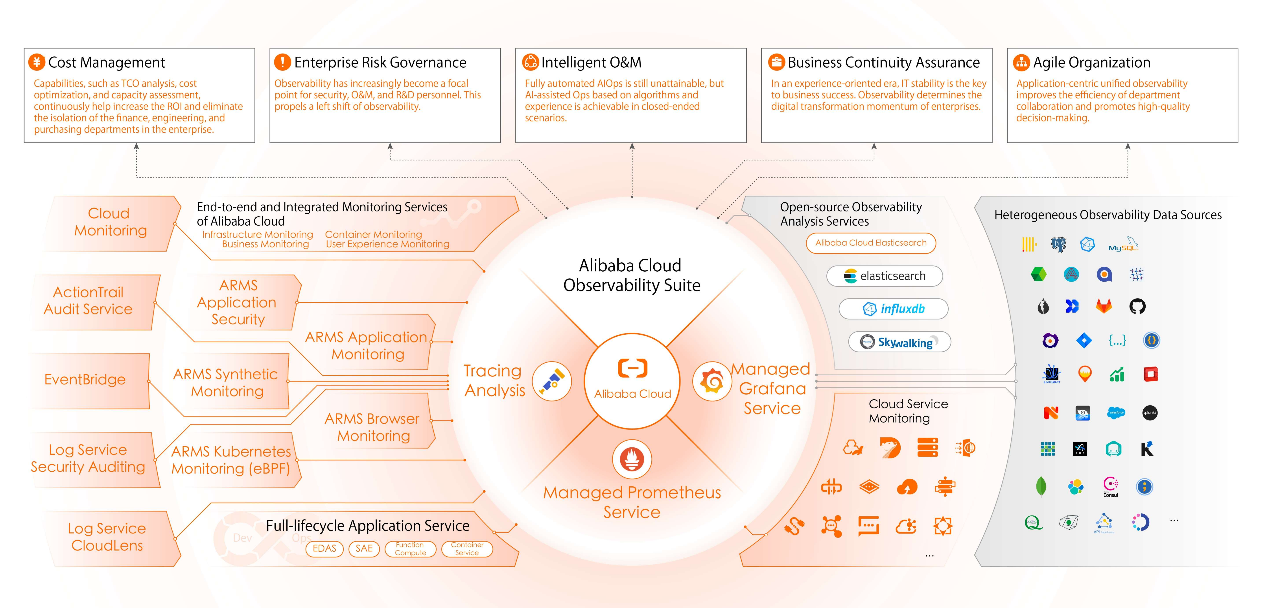
At the same time, as an important component of Alibaba Cloud Observability Suite (ACOS), Prometheus is integrated with Grafana and Tracing Analysis to form an observable data layer that supports storage and analysis of metrics and trace data and integration of heterogeneous data sources. Prometheus also allows you to view dashboards, configure the alerting feature, and explore data with the standard PromQL or SQL syntax. Also, it gives data value to different scenarios (such as IT cost management, enterprise risk governance, intelligent O&M, and business continuity assurance), so observable data can go beyond observation.
Observability | What Metrics Should We Focus on When We Use Prometheus Service to Monitor SNMP?
Observability | How to Use Prometheus to Achieve Observability of Performance Test Metrics

212 posts | 13 followers
FollowAlibaba Cloud Native - November 6, 2024
Alibaba Cloud Native - September 11, 2023
Alibaba Cloud Native - March 6, 2024
Alibaba Cloud Community - October 9, 2022
Alibaba Developer - April 7, 2020
Alibaba Cloud Native - March 1, 2024

212 posts | 13 followers
Follow Best Practices
Follow our step-by-step best practices guides to build your own business case.
Learn More PolarDB for MySQL
Alibaba Cloud PolarDB for MySQL is a cloud-native relational database service 100% compatible with MySQL.
Learn More Cloud-Native Applications Management Solution
Accelerate and secure the development, deployment, and management of containerized applications cost-effectively.
Learn More AnalyticDB for MySQL
AnalyticDB for MySQL is a real-time data warehousing service that can process petabytes of data with high concurrency and low latency.
Learn MoreMore Posts by Alibaba Cloud Native