By Hong Wen
E-MapReduce (EMR) is a cloud-native open-source platform that integrates various big data computing and storage engines like Hadoop, Hive, Spark, Flink, Presto, ClickHouse, StarRocks, Delta, and Hudi. This article explains how to monitor big data in EMR using Prometheus Service.
EMR is increasingly adopted by enterprises as a big data processing solution. Built on Alibaba Cloud's ECS, EMR leverages open-source Apache Hadoop and Apache Spark ecosystems to easily analyze and process data. It can also integrate with cloud data storage systems and databases like Alibaba Cloud OSS and RDS, enabling quick setup of open-source big data services such as Hadoop, Spark, Flink, Kafka, and HBase.
The core of EMR is the cluster, which can be a Hadoop, Flink, Druid, or ZooKeeper cluster comprising one or more ECS instances. For instance, a Hadoop cluster consists of daemon processes like NameNode, DataNode, ResourceManager, and NodeManager running on ECS instances. Many big data components have numerous metrics that need to be monitored, posing challenges for O&M and SRE engineers. Hence, it is important to understand which metrics to focus on for different EMR components.
EMR metrics include HOST, HDFS, YARN, Hive, Kafka, Zookeeper, ClickHouse, and Flink. Let's introduce them one by one.
Provides monitoring metrics for ECS nodes, such as CPU, memory, disk, load, network, and socket.
Hadoop Distributed File System (HDFS) is suitable for distributed reading and writing of large-scale data, especially in scenarios with more reads and fewer writes. HDFS metrics include HOME, NameNodes, DataNodes, and JournnanlNodes.
YARN is the core component of the Hadoop system. YARN manages resources in Hadoop clusters, and schedules and monitors jobs in the clusters. YARN metrics include HOME, Queue, ResourceManager, NodeManager, TimeLineServer, and JobHistory.
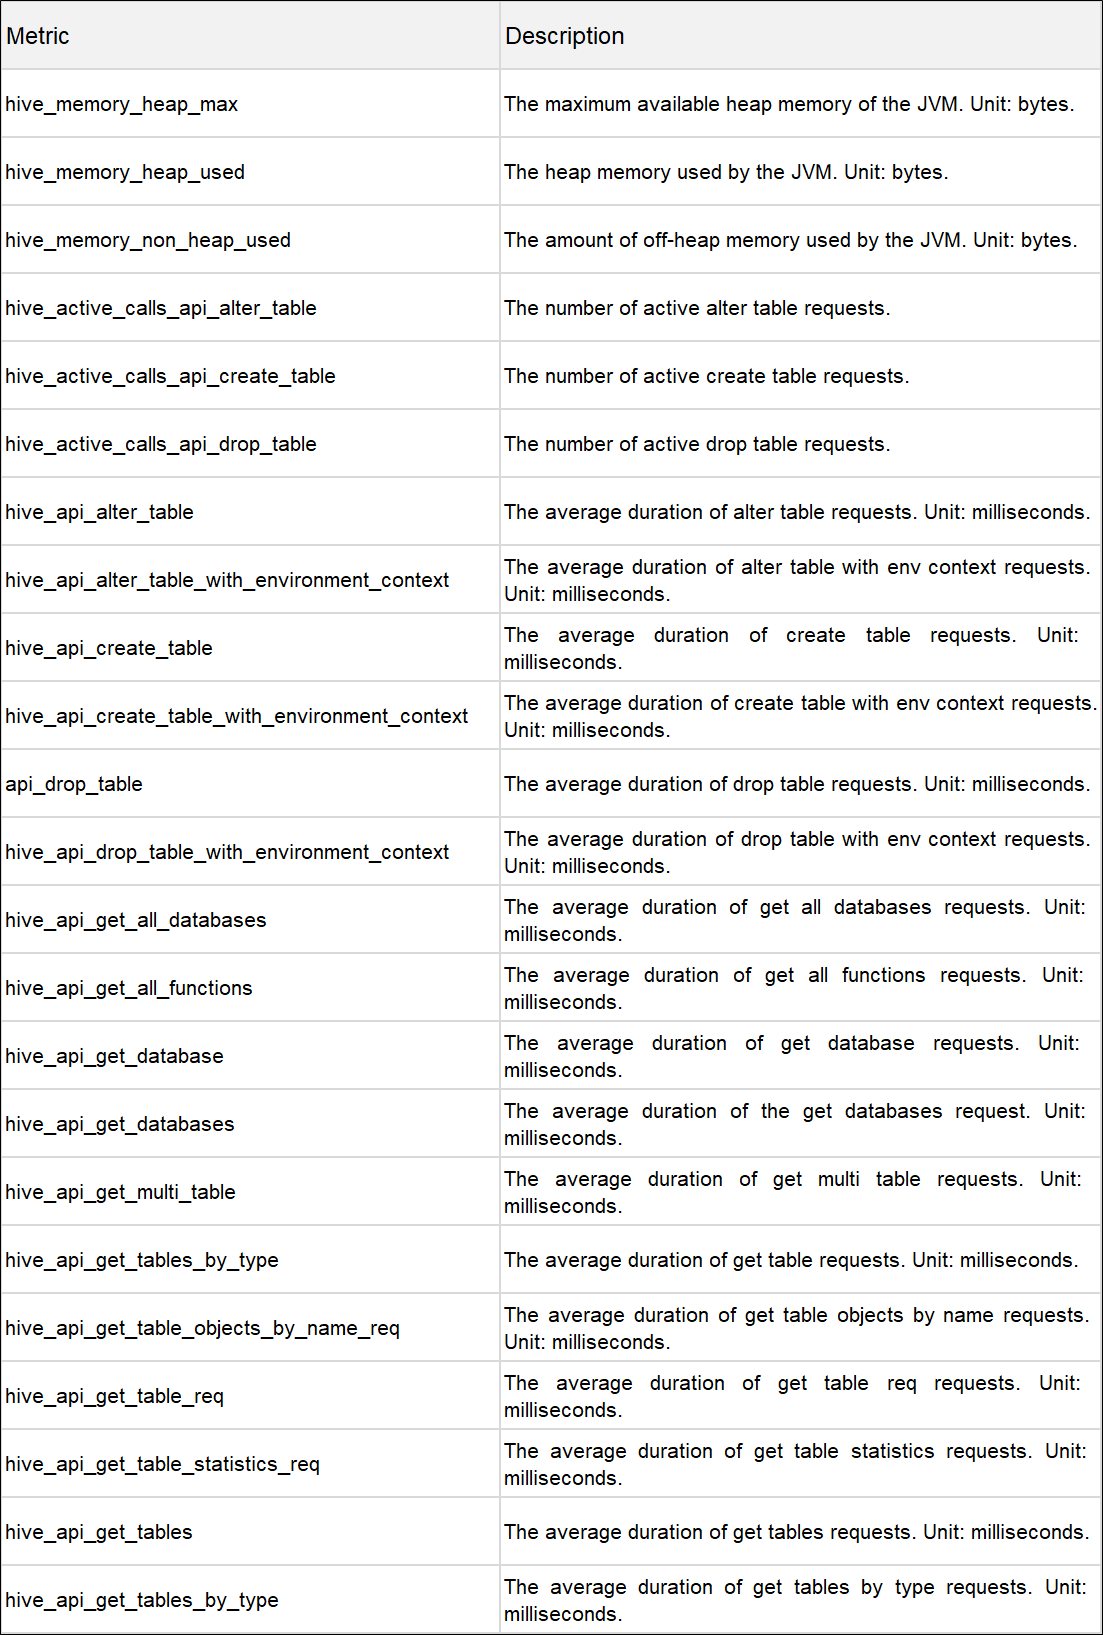
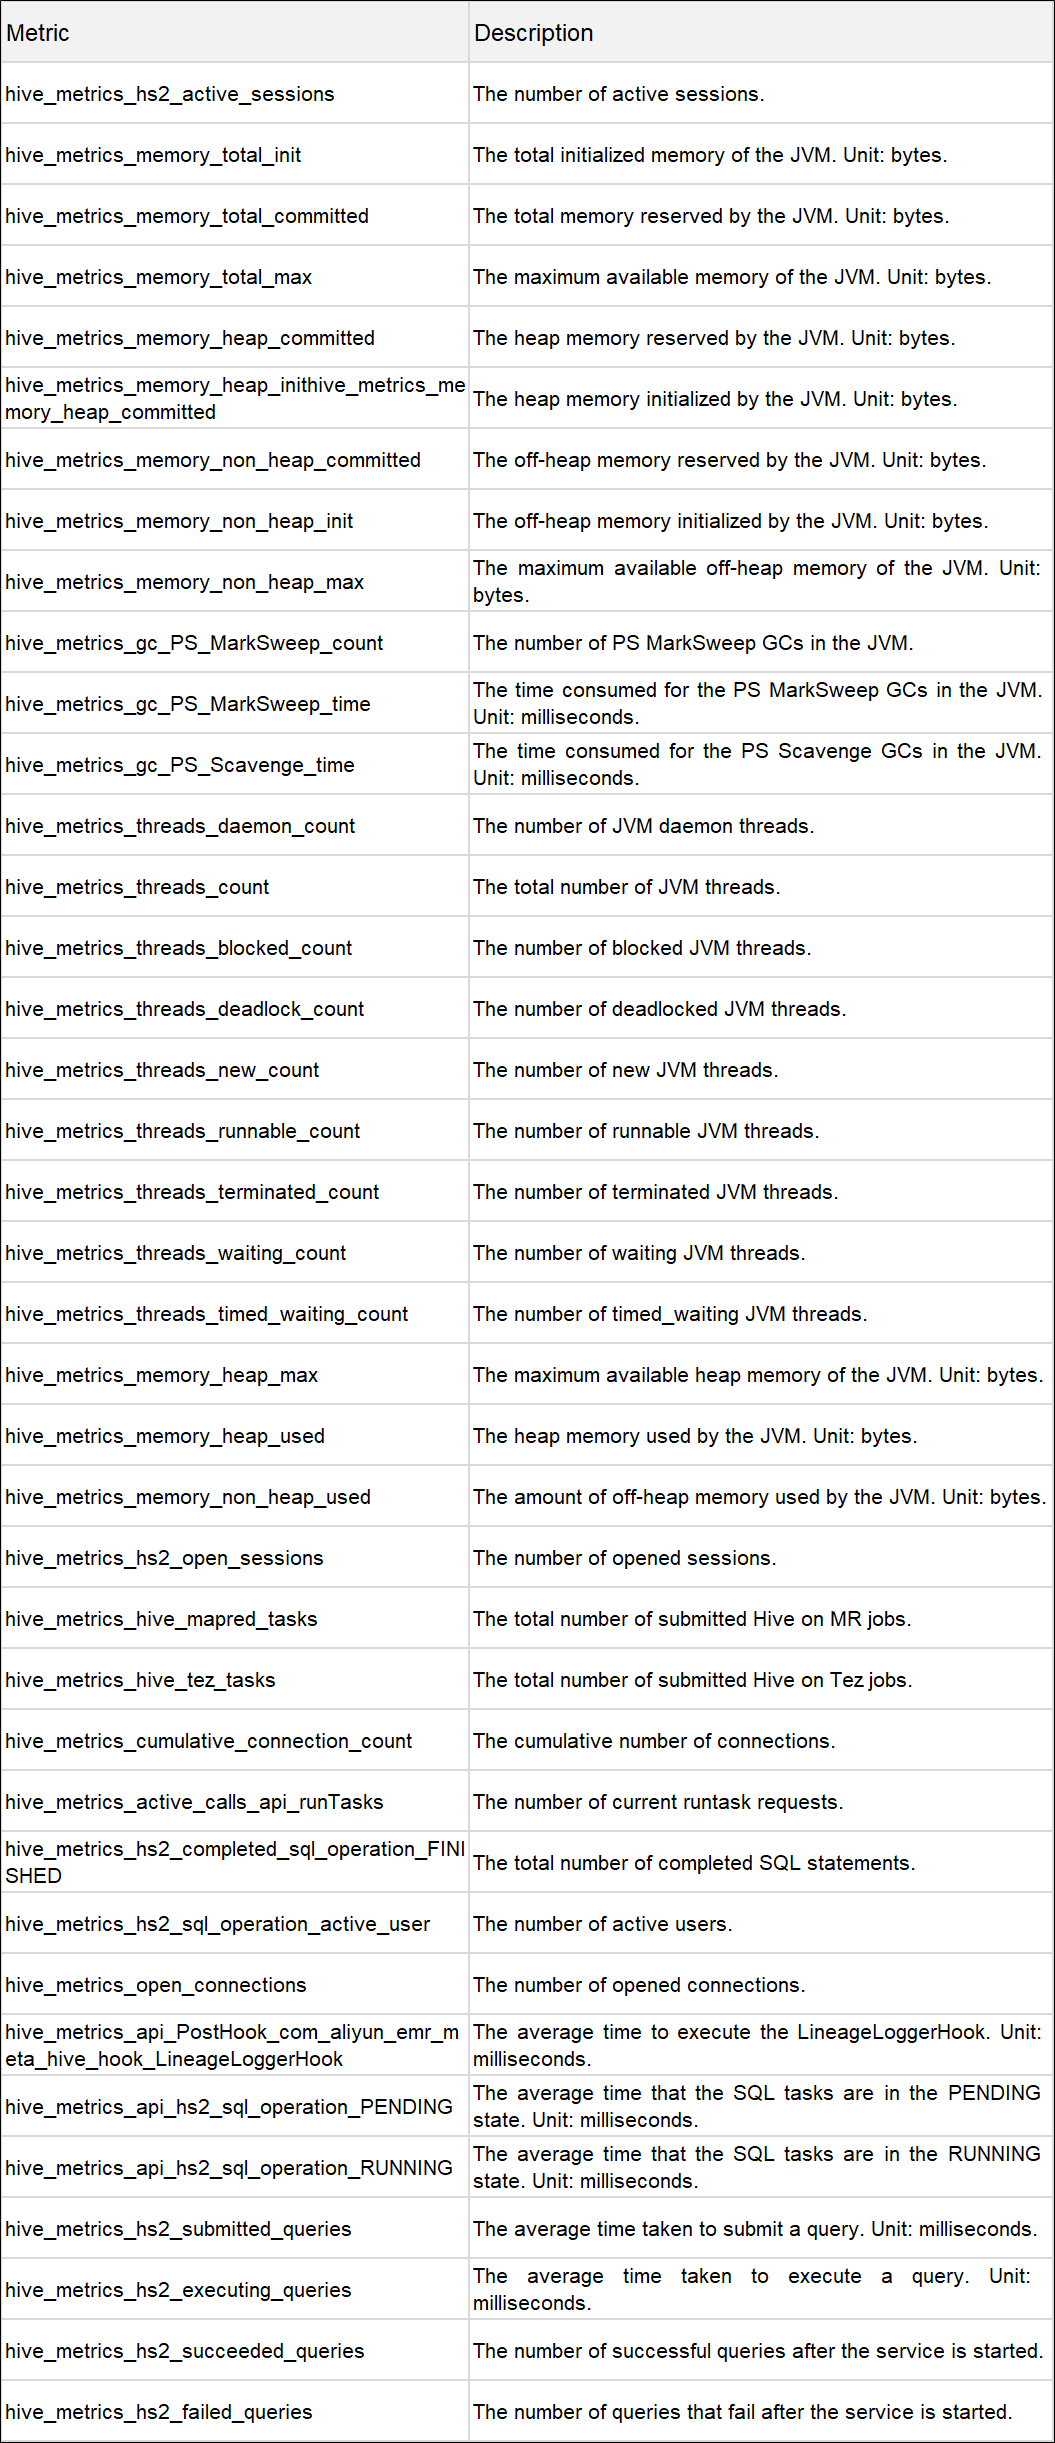
Hive is a Hadoop-based data warehouse framework. It is used to extract, transform, and load data and manage metadata in big data scenarios. Hive consists of HiveServer2 (HiveQL query server), Hive MetaStore (metadata management module), and Hive Client. Its metrics include HiveMetaStore and HiveServer2.
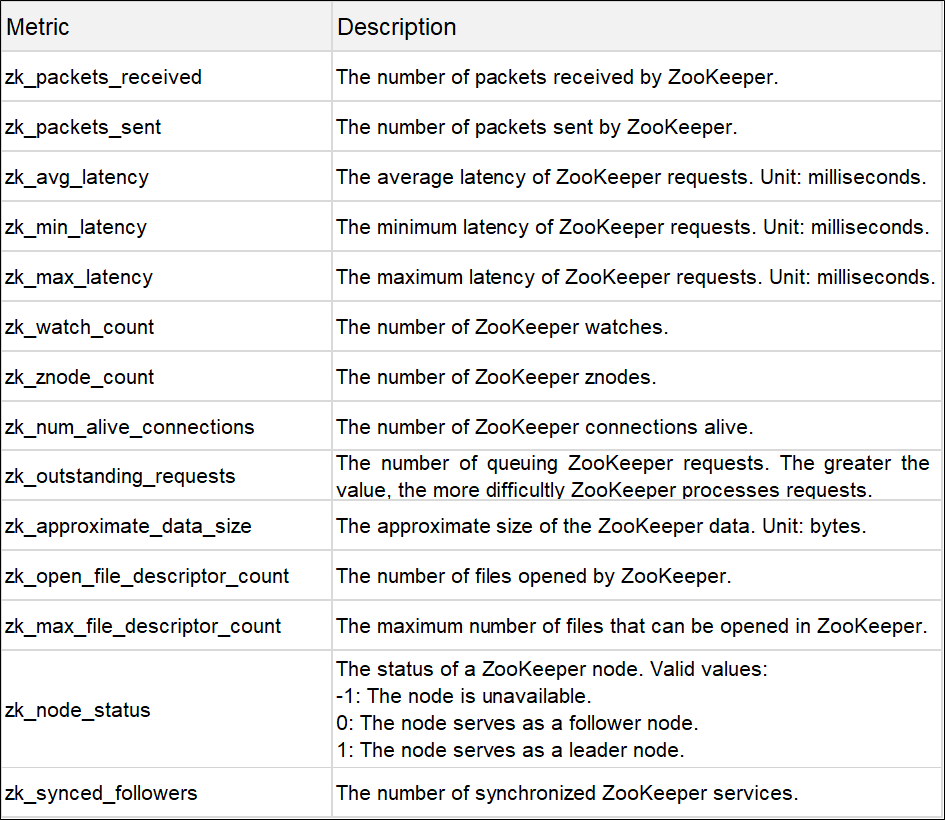
ZooKeeper is a distributed and highly available coordination service. ZooKeeper provides features such as distributed configuration, synchronization, naming, and registration.
ApsaraMQ for Kafka is a distributed, high-throughput, and scalable message queue service provided by Alibaba Cloud. Message Queue for Apache Kafka is used in big data scenarios such as log collection, monitoring data aggregation, streaming data processing, and online and offline analysis. It is important for the big data ecosystem.
Kafka-Broker
Kafka-Topic
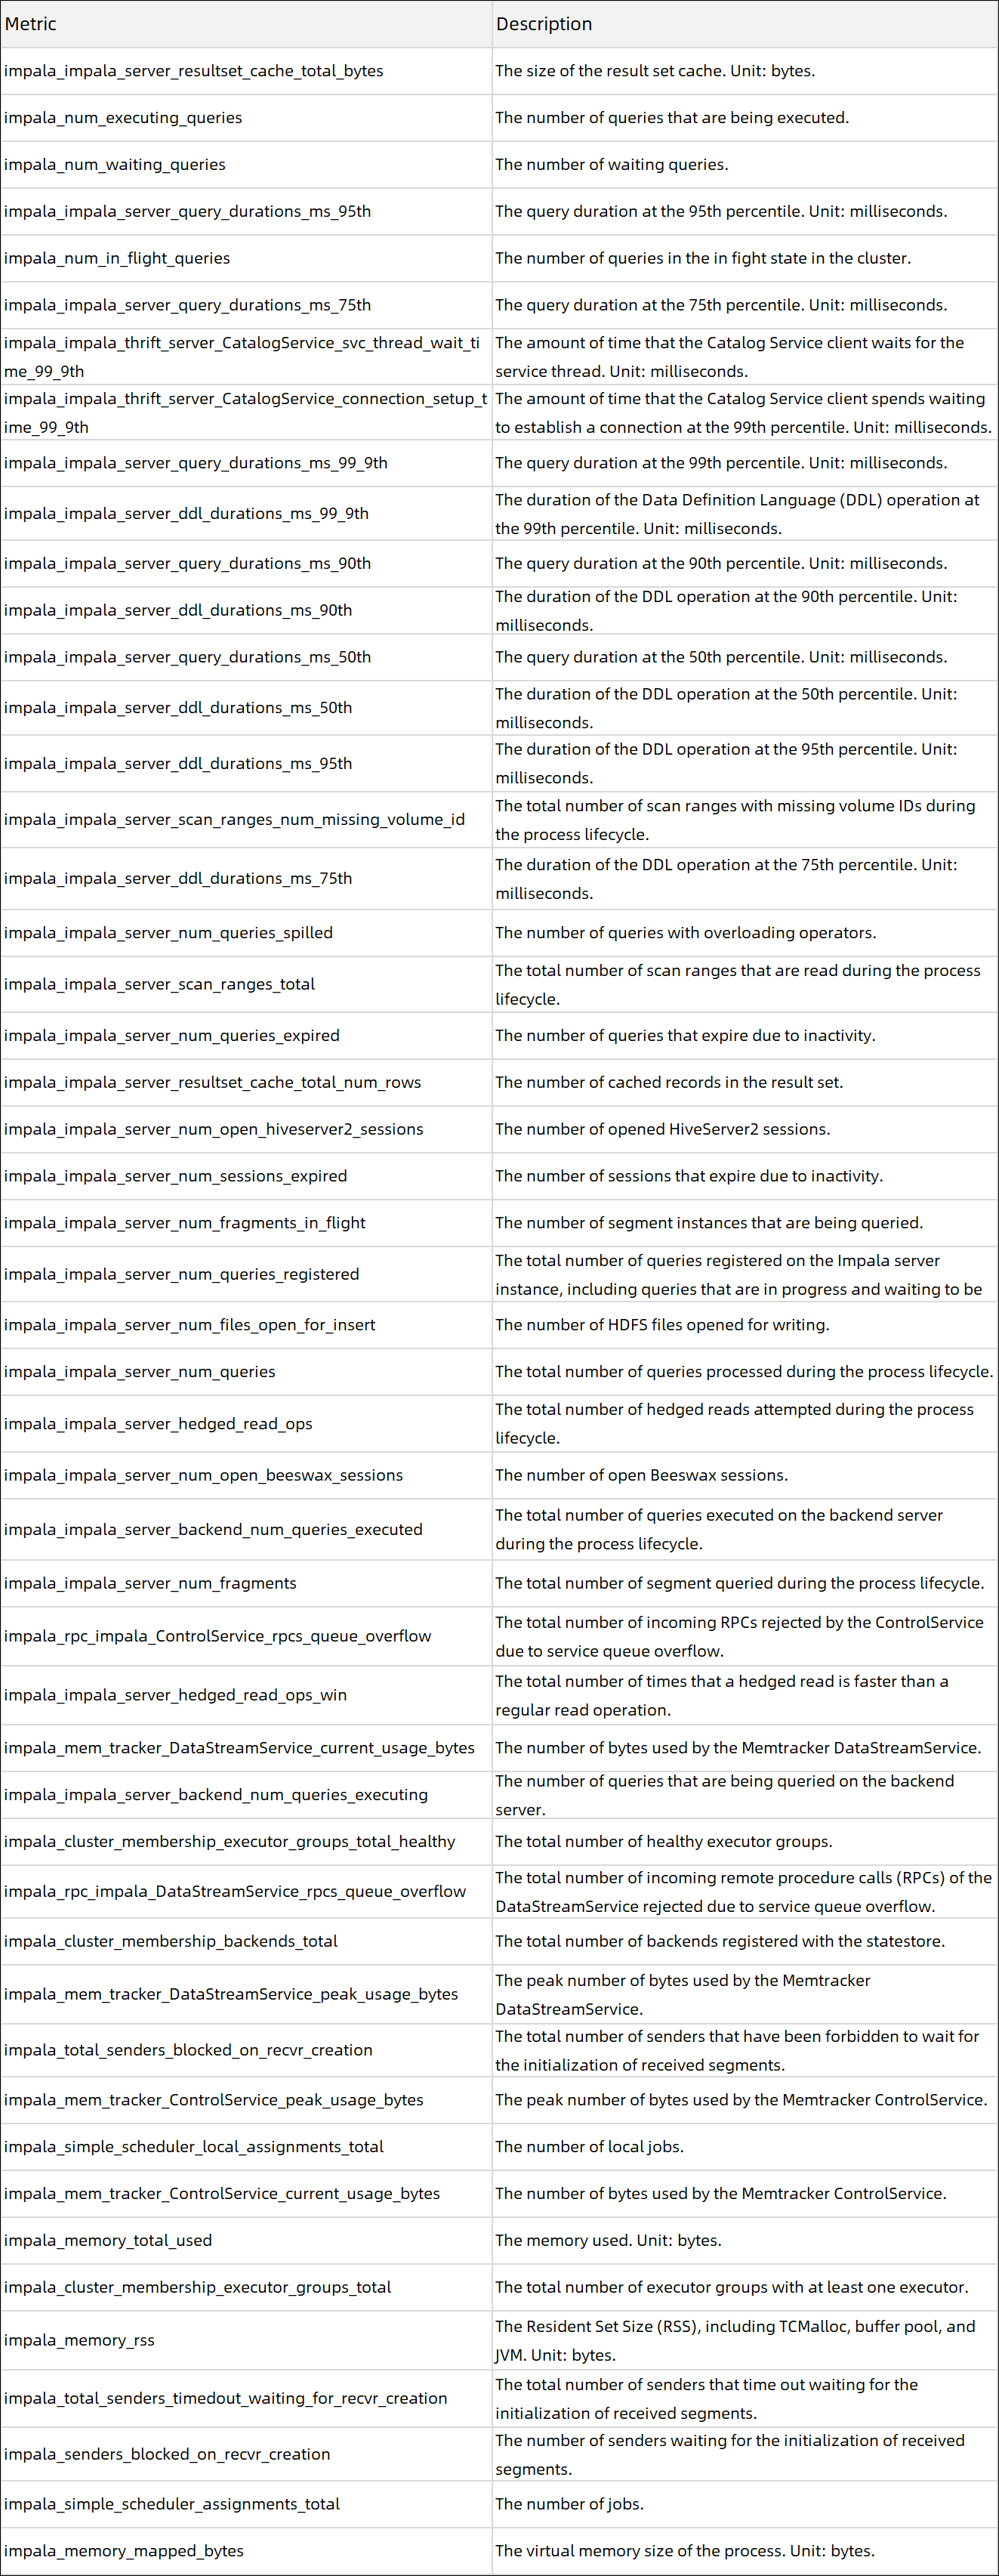
Impala provides high-performance and low-latency SQL queries for data stored in Apache Hadoop.
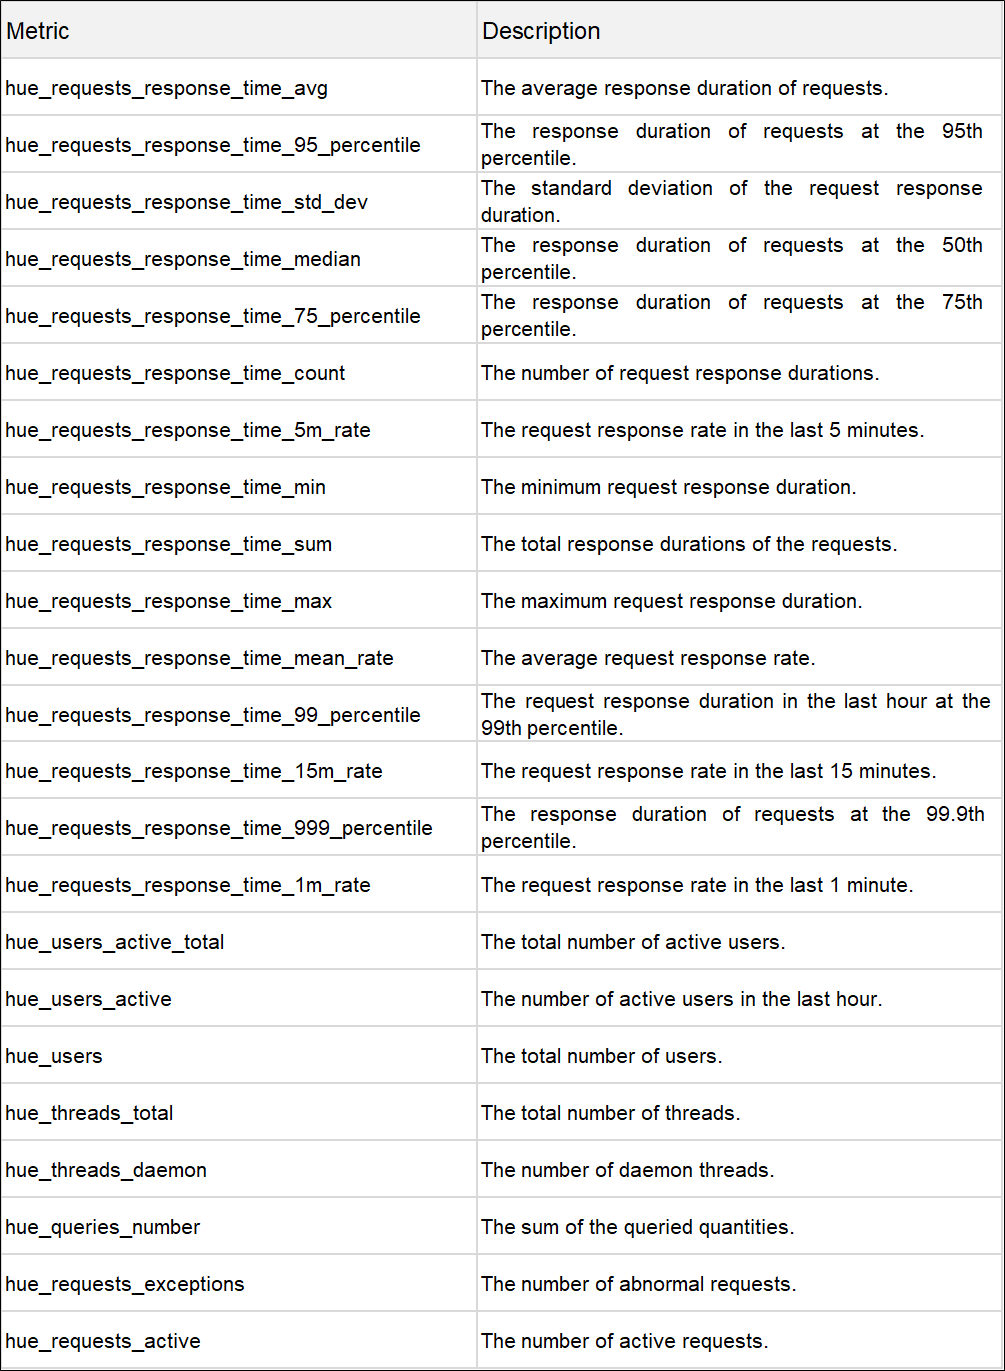

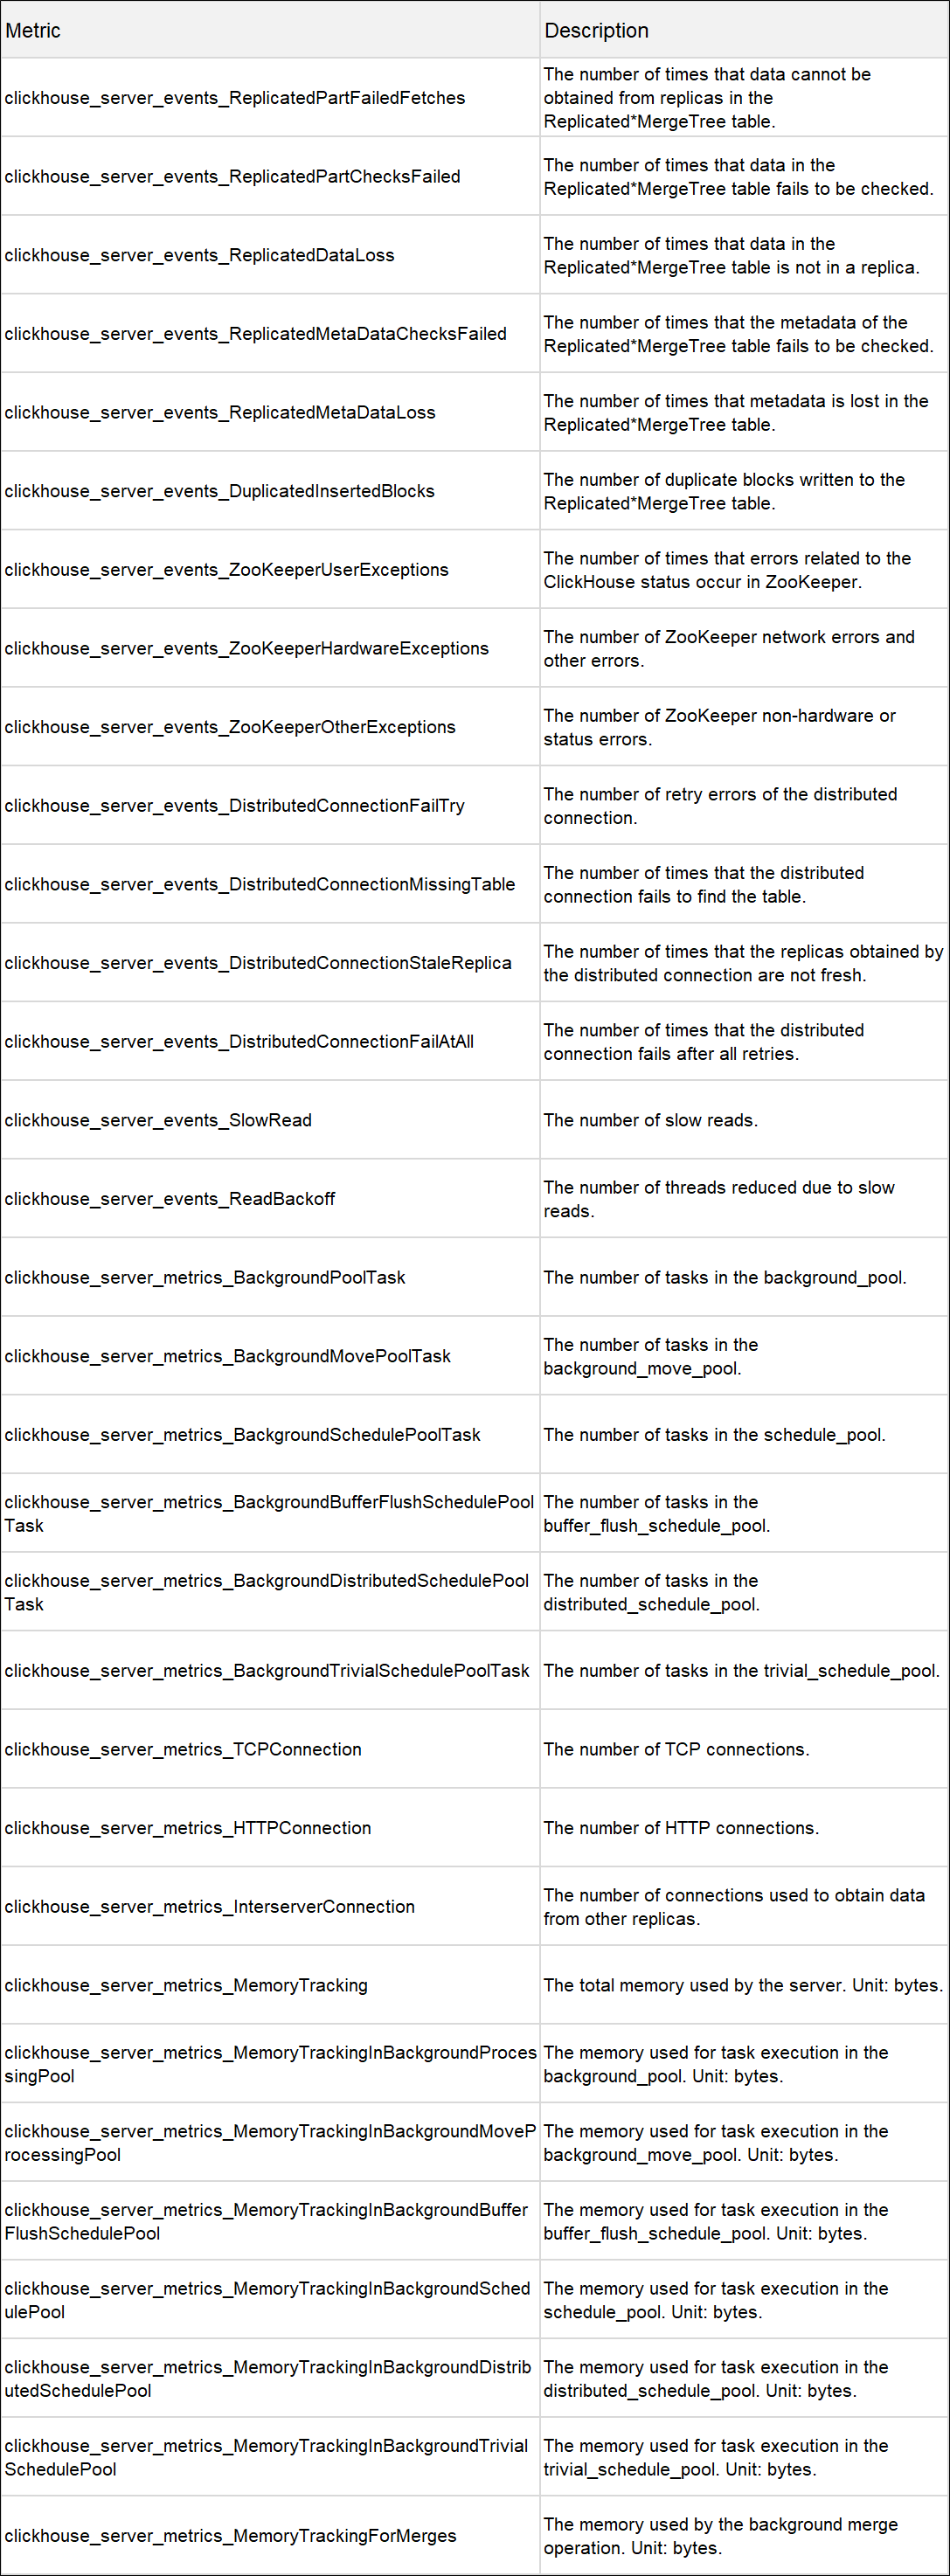
Compatible with the features of open source ClickHouse, EMR ClickHouse optimizes the read and write performance and improves the ability to quickly integrate ClickHouse with other EMR components.
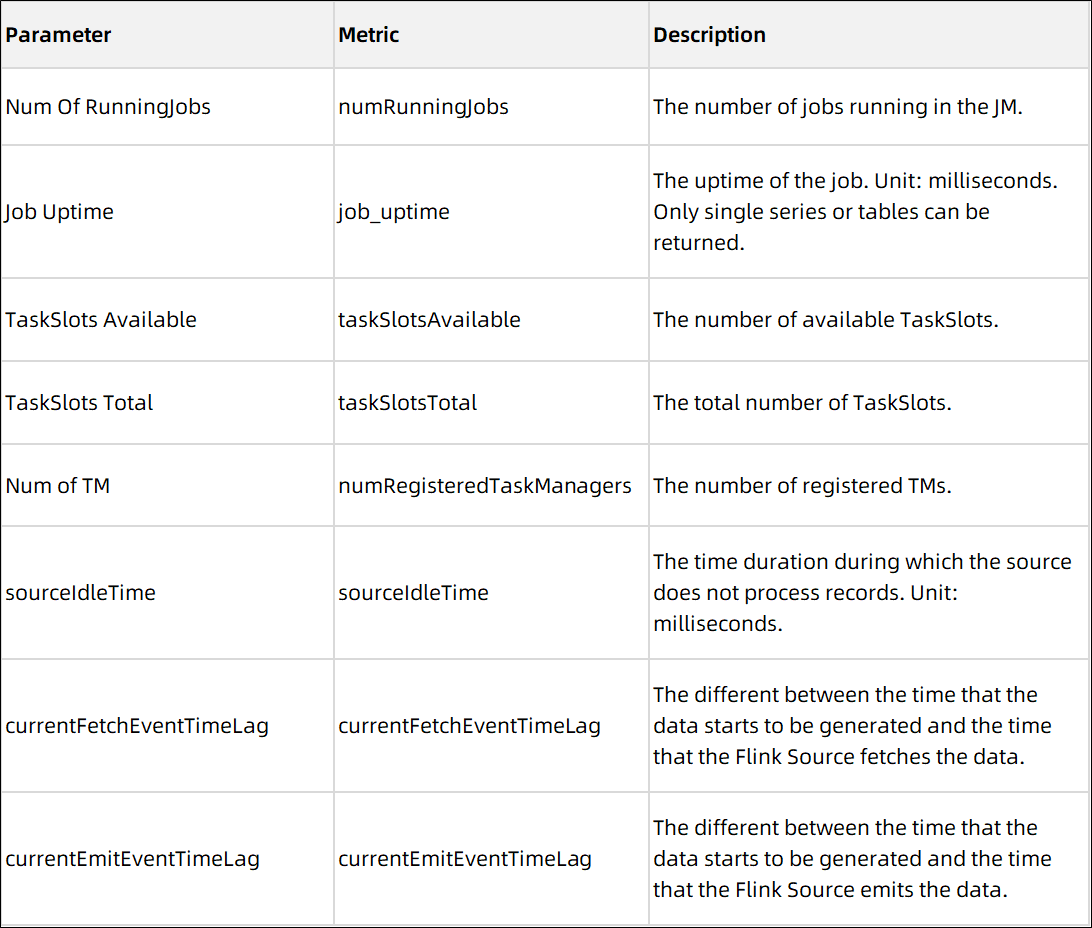
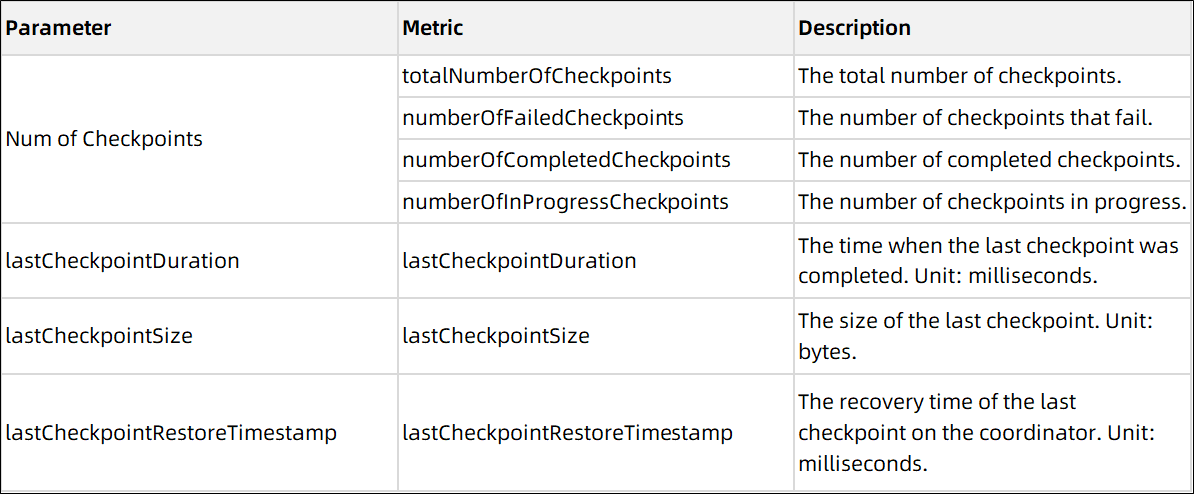
Flink is a streaming data stream execution engine that provides data distribution, data communication, and fault tolerance mechanisms for distributed computing of data streams.

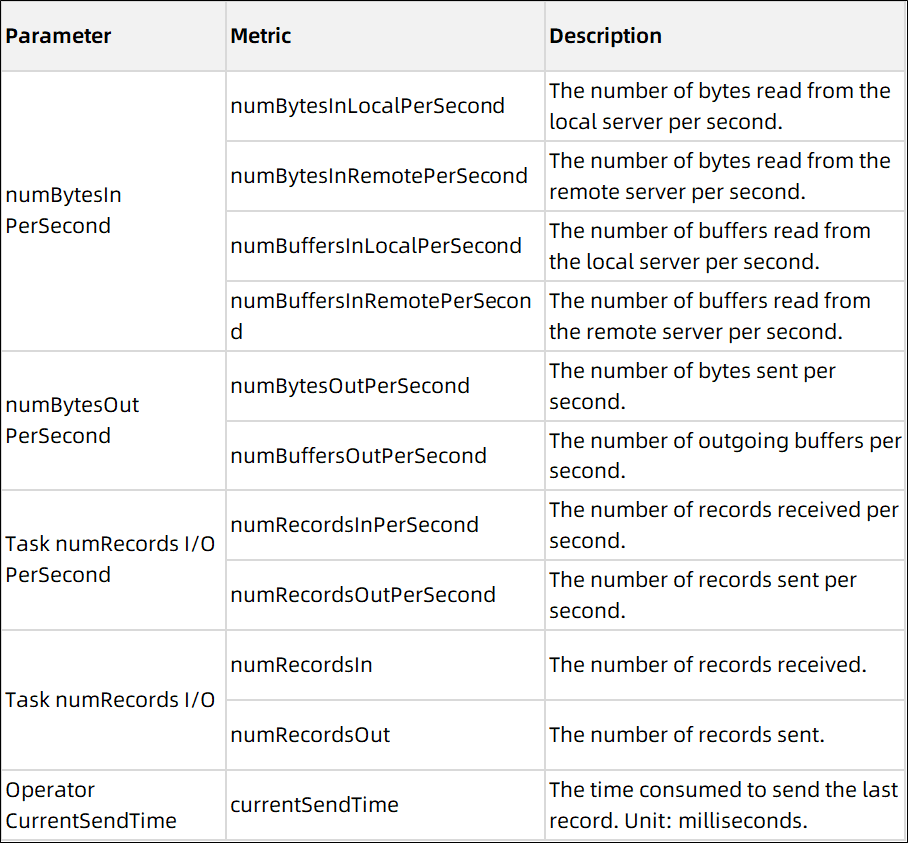


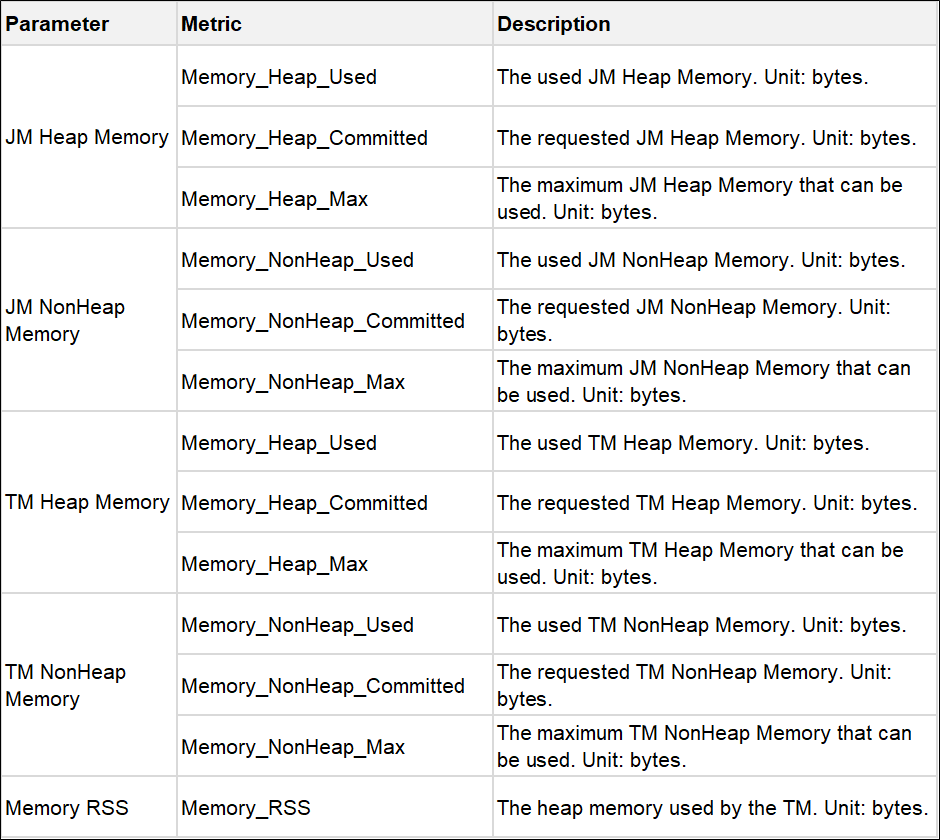
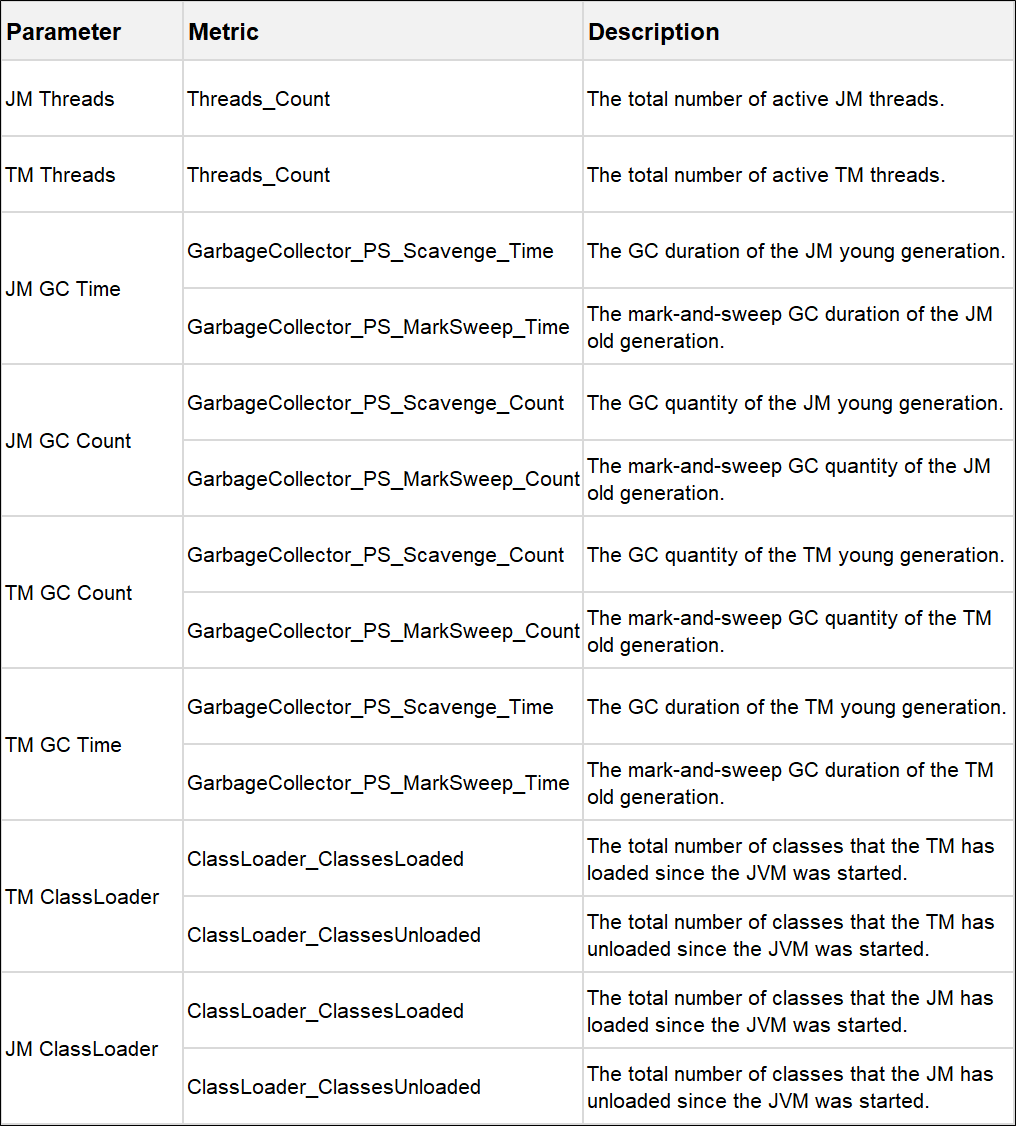
The following section describes how to use Alibaba Cloud Prometheus Service to monitor EMR. The following three aspects are included: integrate EMR configurations, view monitoring dashboards, and' configure alert rules.
After you create an EMR cluster, the system automatically installs taihao-exporter in the corresponding Elastic Compute Service (ECS) instance. You must manually enable the Prometheus port.
1. Log on to the EMR console [12] and find the ID and name of the cluster.

2. Click the Nodes tab. Find the master node and core node, and click Details. In the Basic Information section of the Instance Details tab, click Connect to remotely log on to the ECS instance.

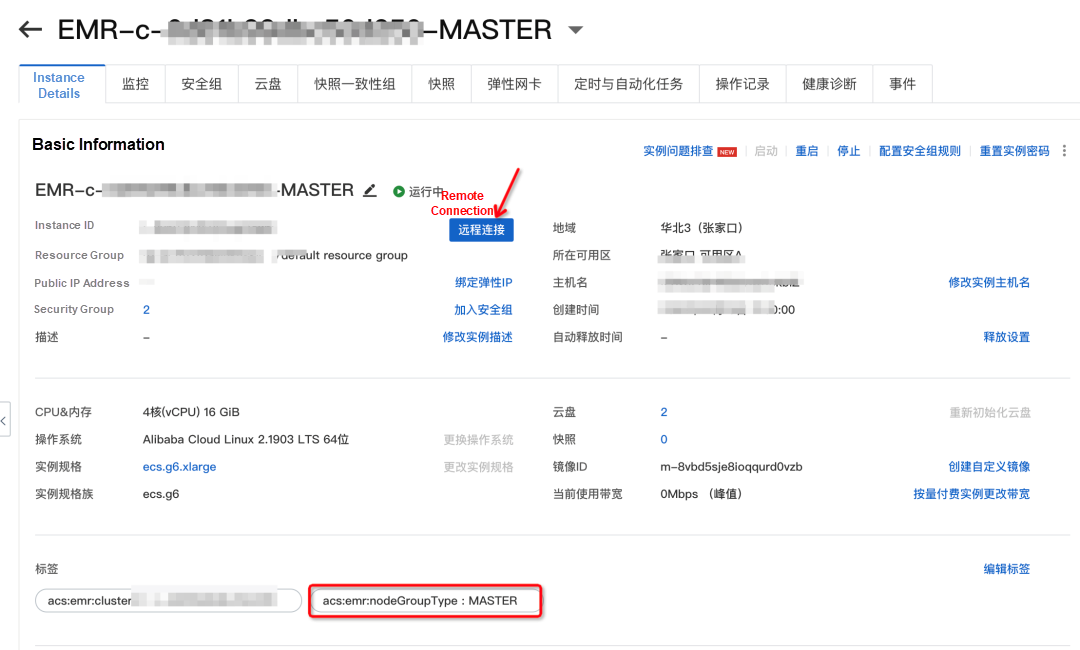
3. Run the following command, ps -ef | grep taihao_exporter, to query the exporter process, and run the following command to add prom_sink_enable=true to the taihao_exporter.yaml file and restart the service: (You need to modify the configurations of all nodes.)


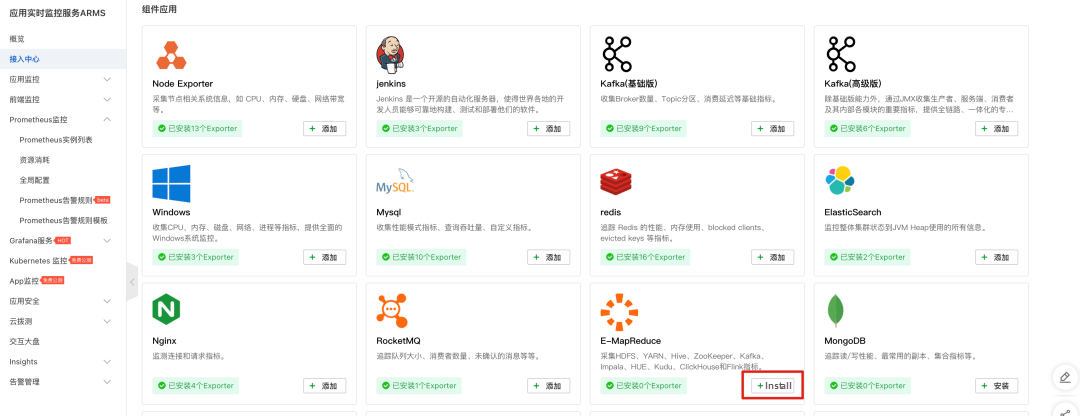
sed -i 's/prom_sink_enable:\s*false/prom_sink_enable: true/g' /usr/local/taihao_exporter/taihao_exporter.yamlservice taihao_exporter restartLog on to the Alibaba Cloud Prometheus [13] console. Click Integration Center. In the Application Components section, find the E-MapReduce component and click Add.
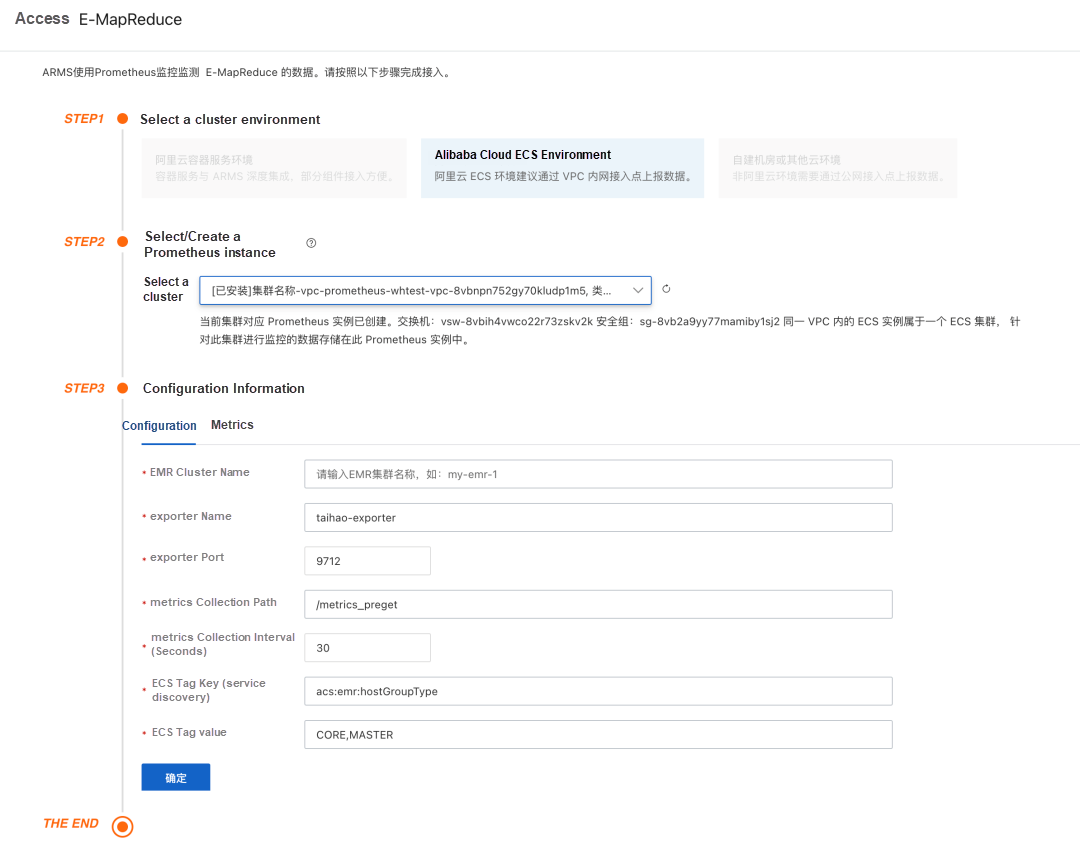
Select an ECS environment and a Prometheus instance, and configure the following configurations:
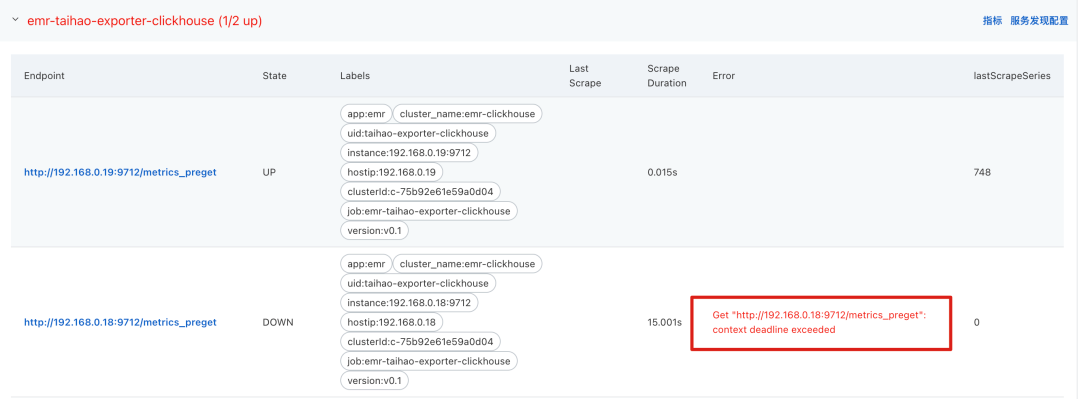
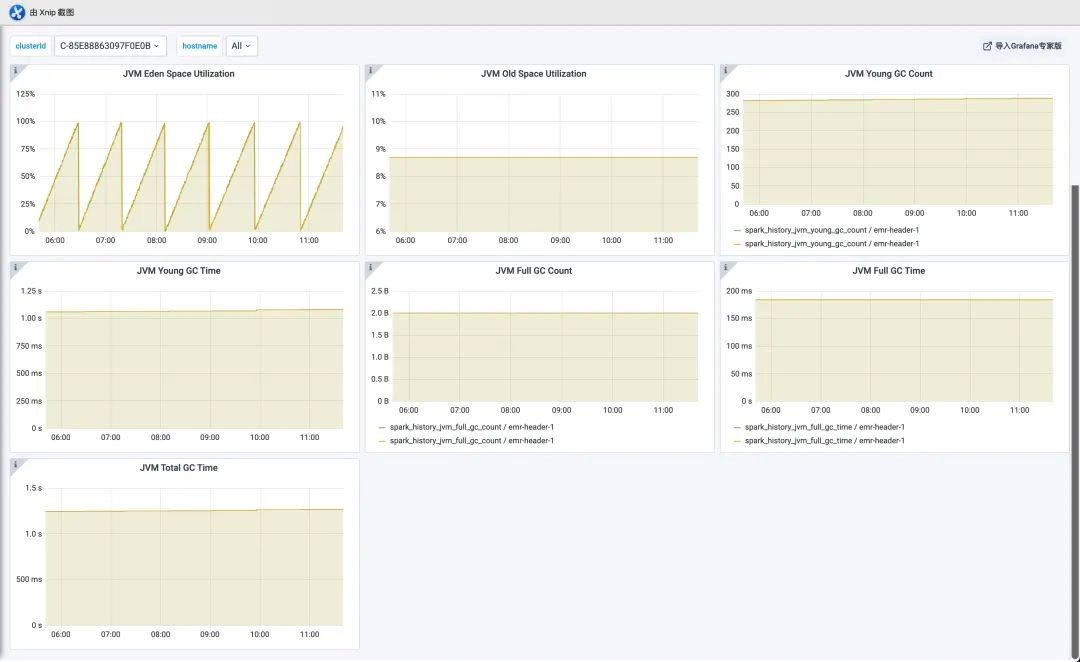
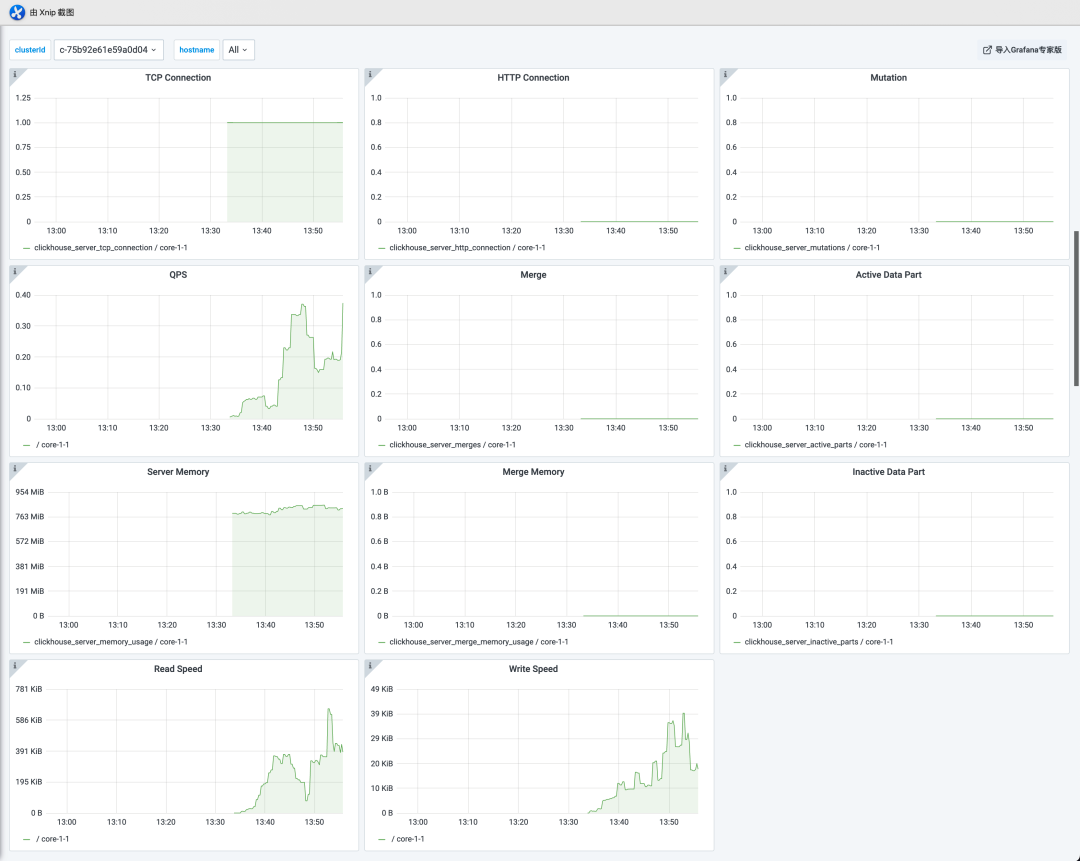
Alibaba Cloud Prometheus Service provides 24 dashboards, including HOST, HDFS, Hive, YARN, Impala, ZooKeeper, Spark, Flink, and ClickHouse.
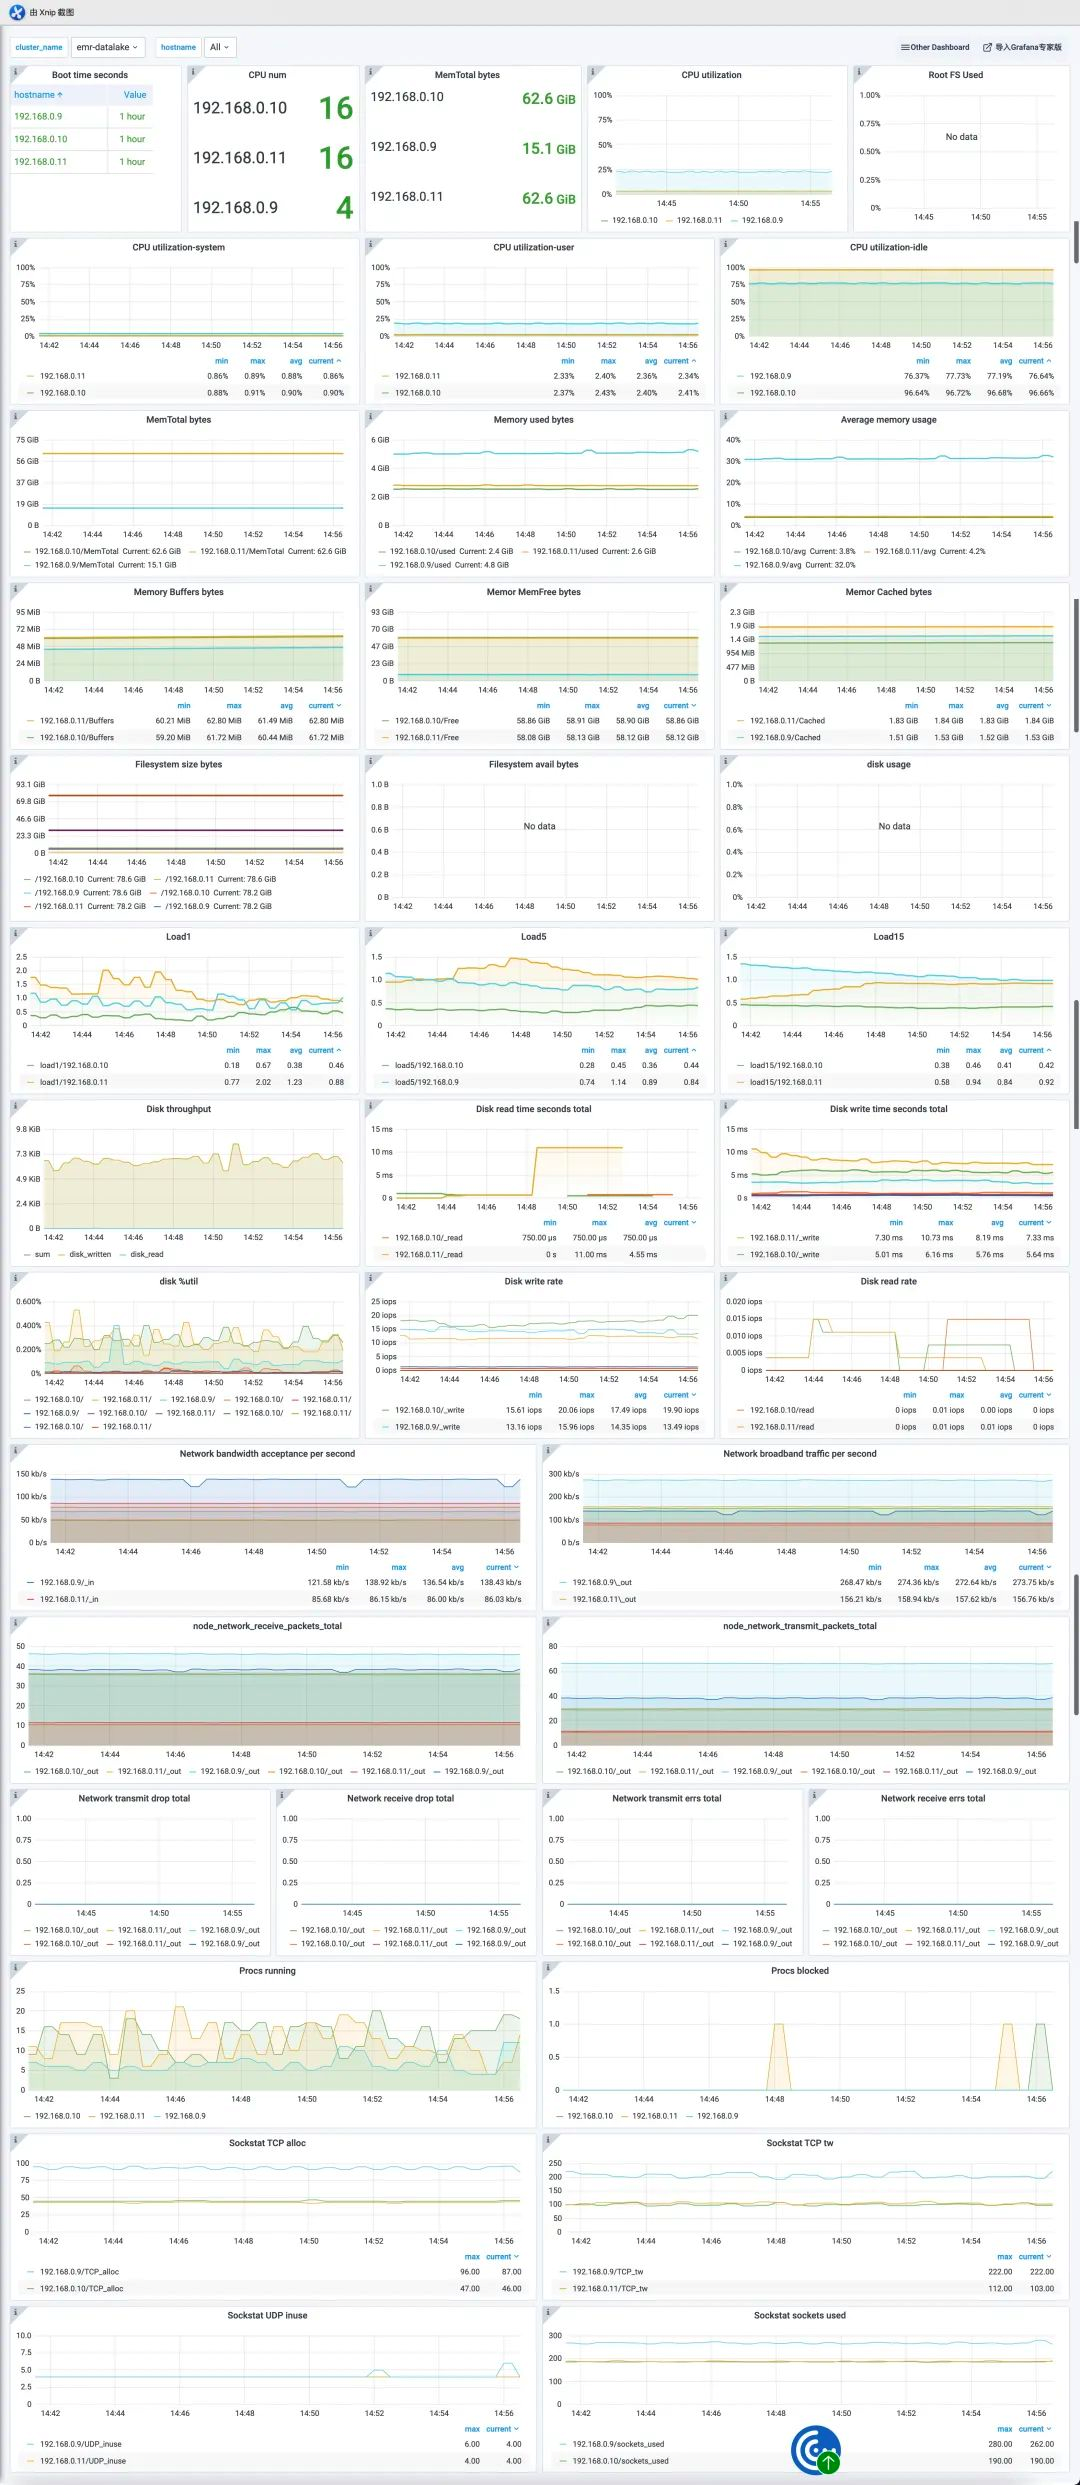
1. HOST dashboard: displays the CPU utilization, memory usage, disk space, load, network, and socket of the ECS instance.
2. HDFS dashboard: HDFS-HOME, HDFS-NameNodes, HDFS-DataNodes, and HDFS-JournanlNodes
3. Hive dashboard:
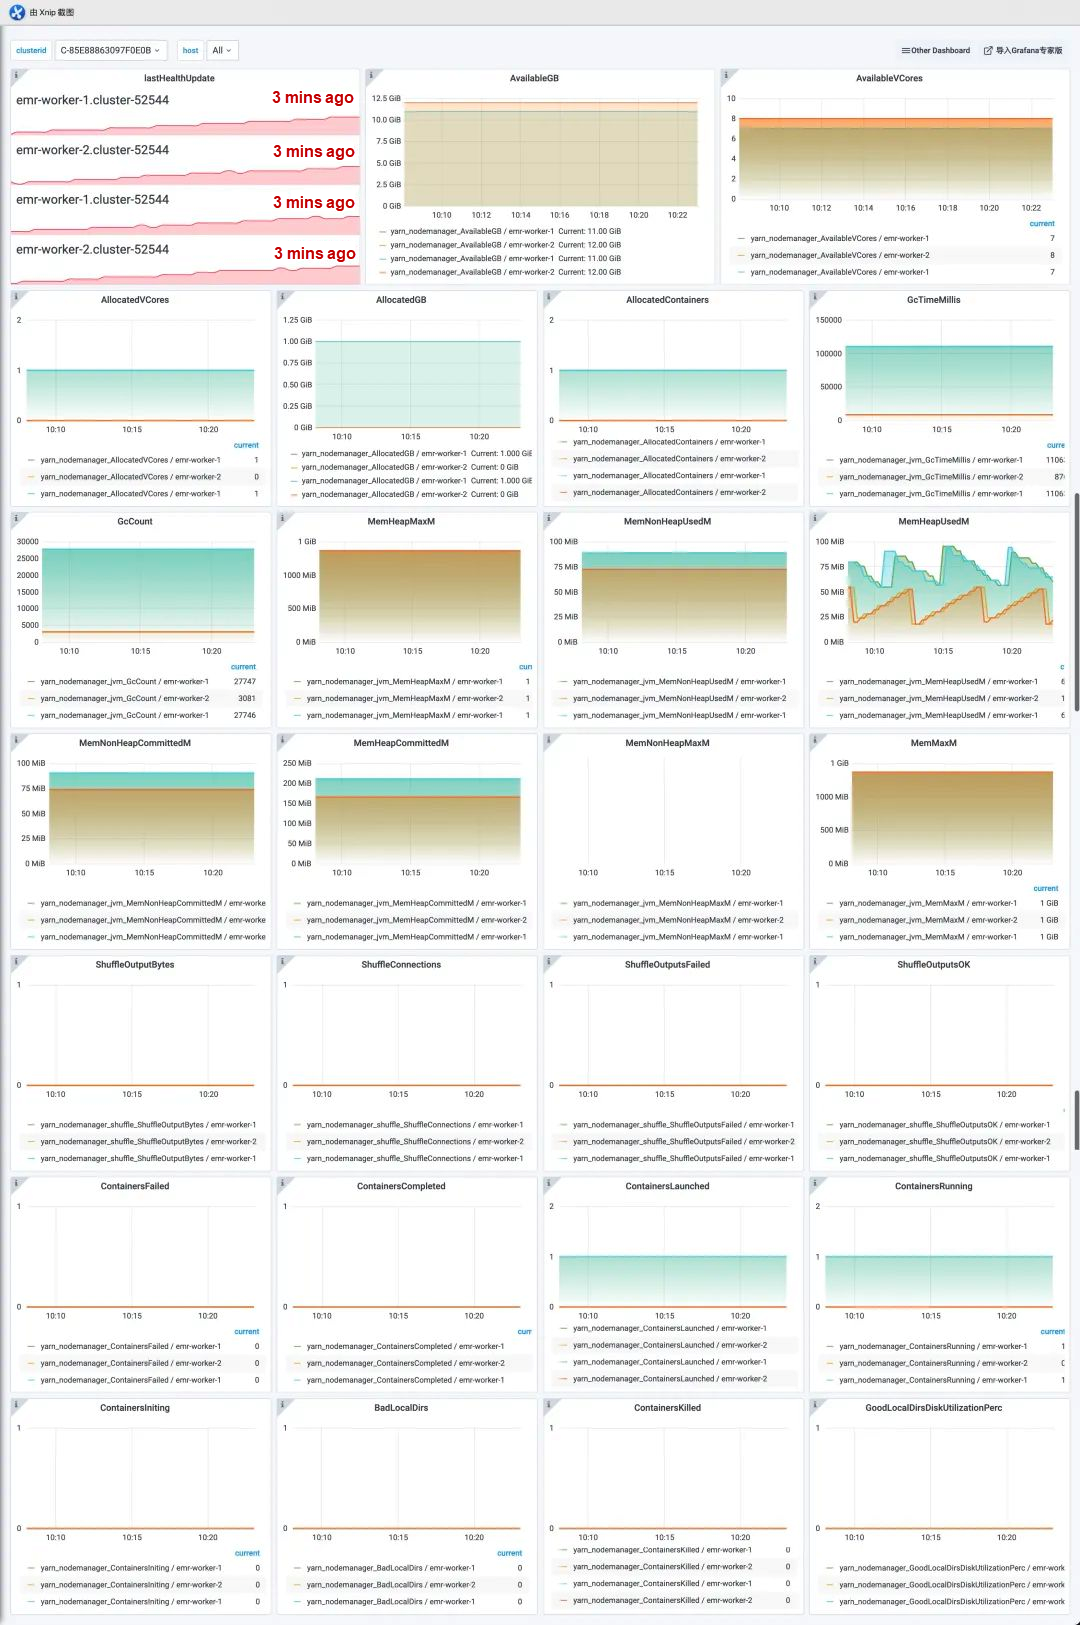
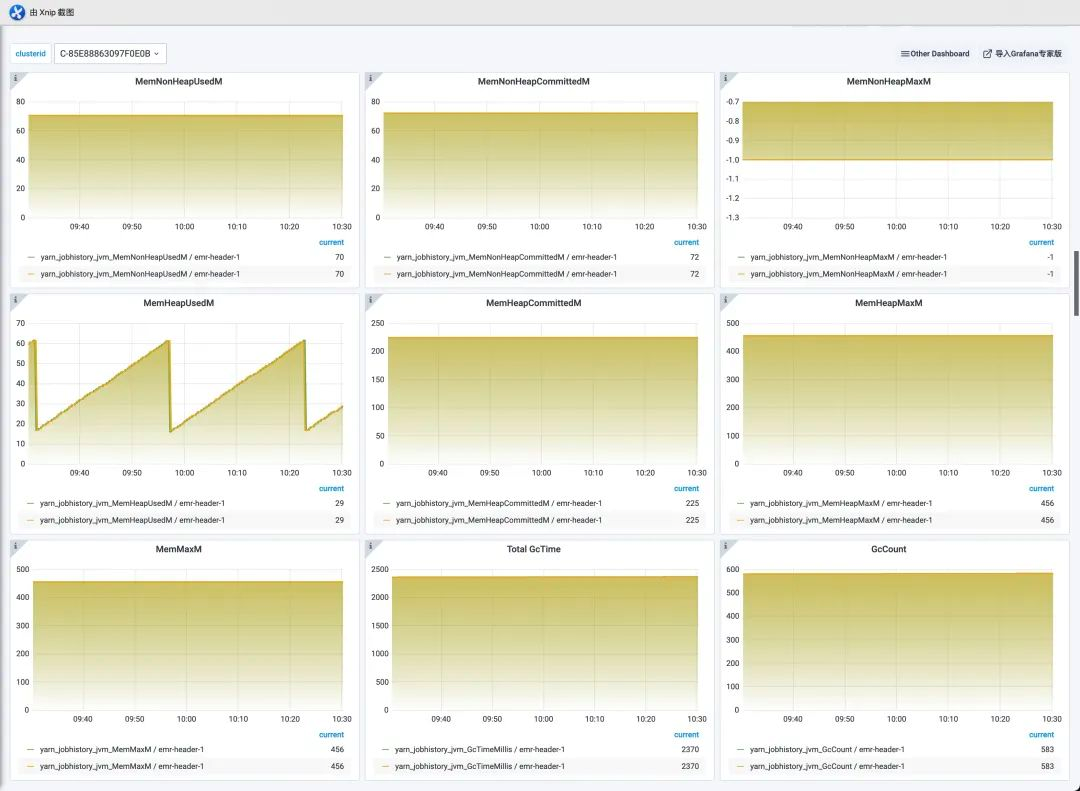
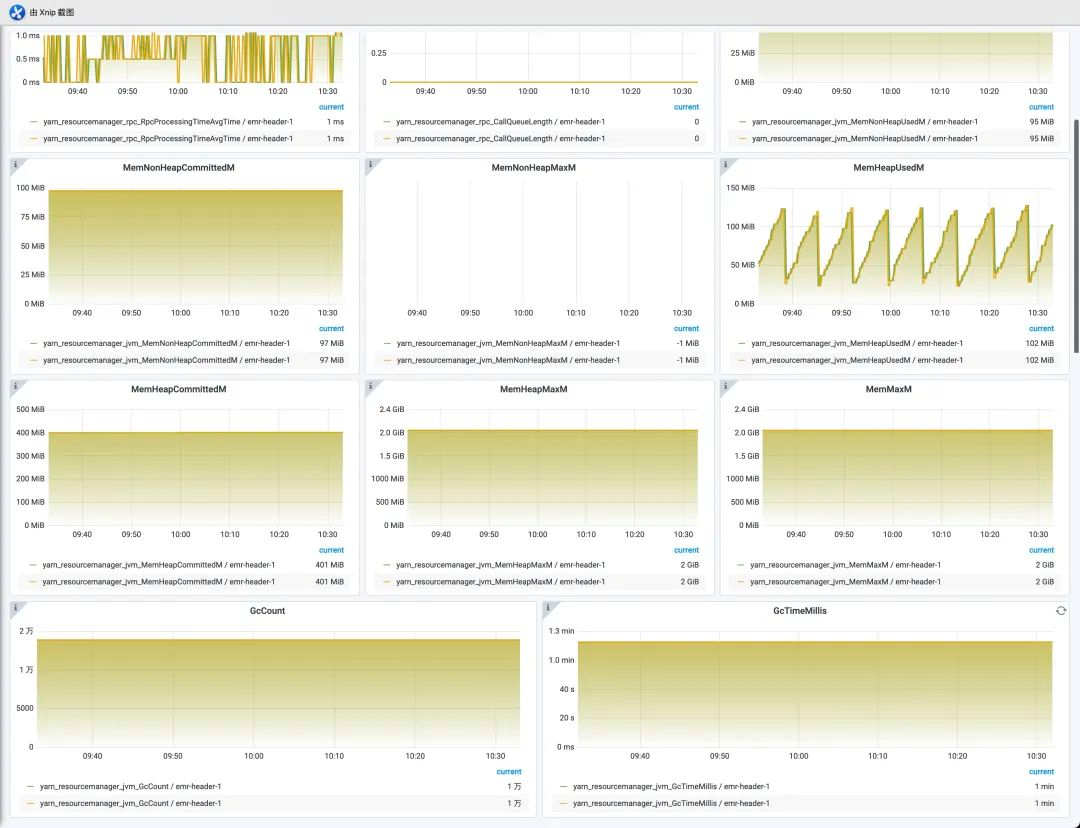
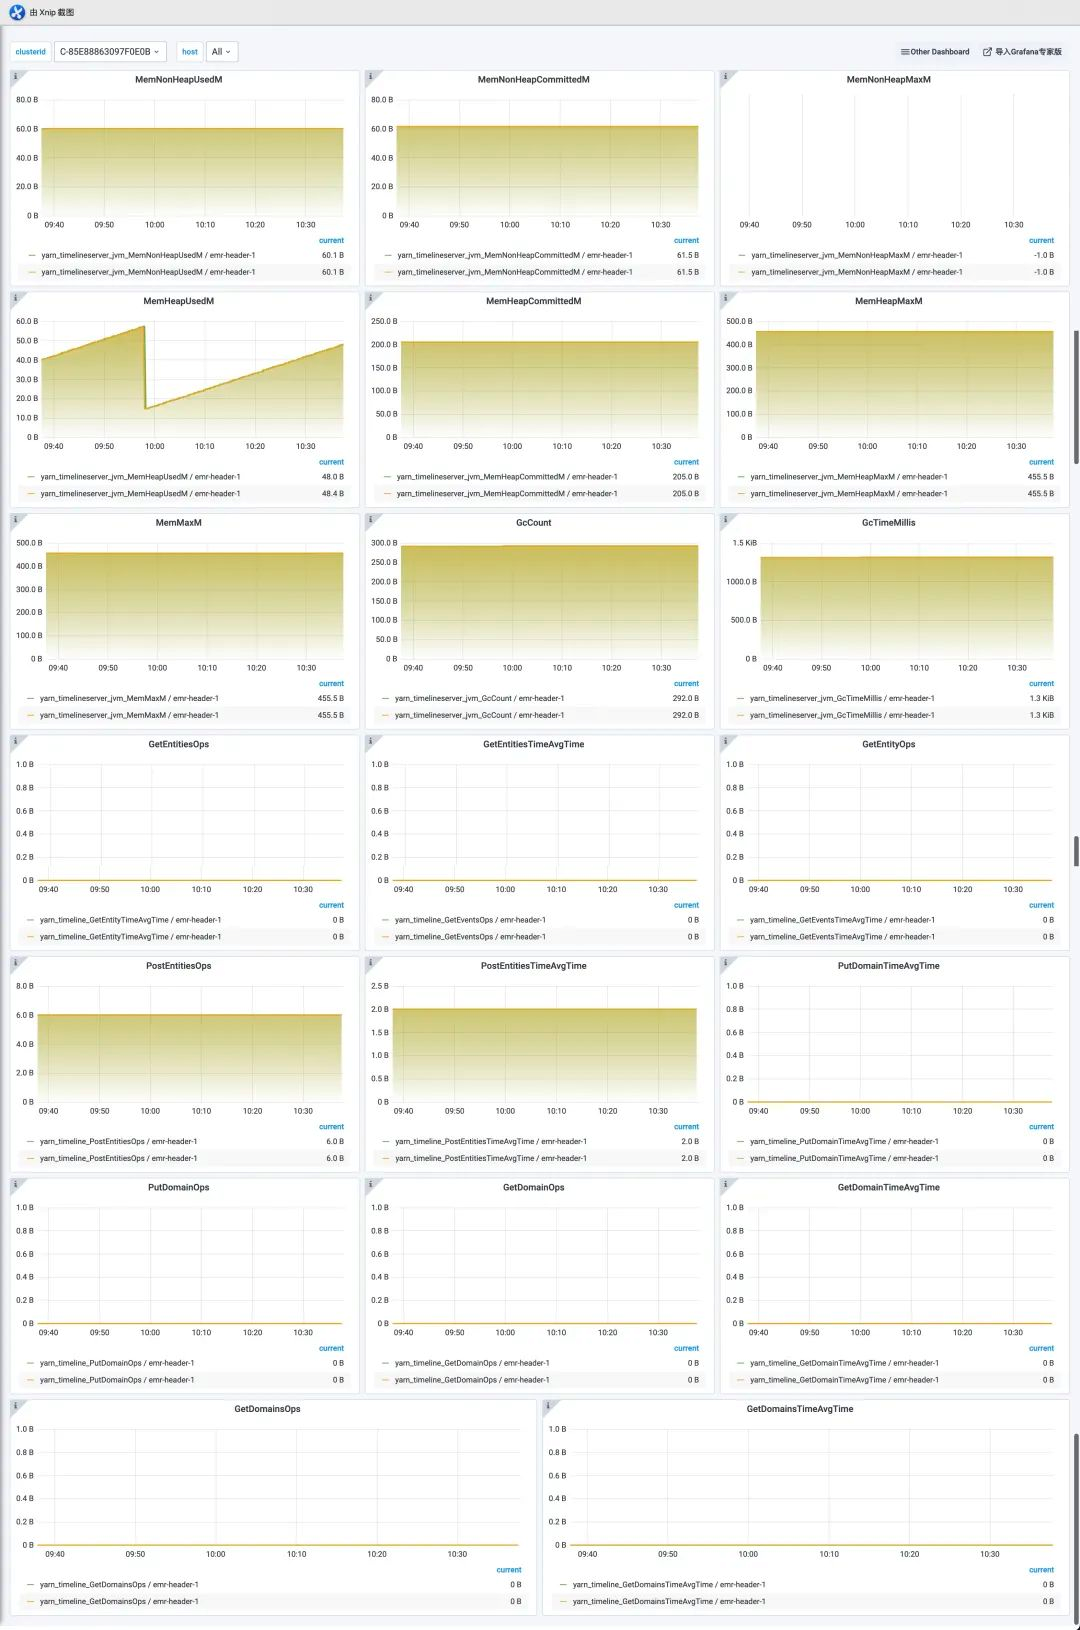
4. YARN dashboard:
5. ClickHouse dashboard
6. Flink dashboard
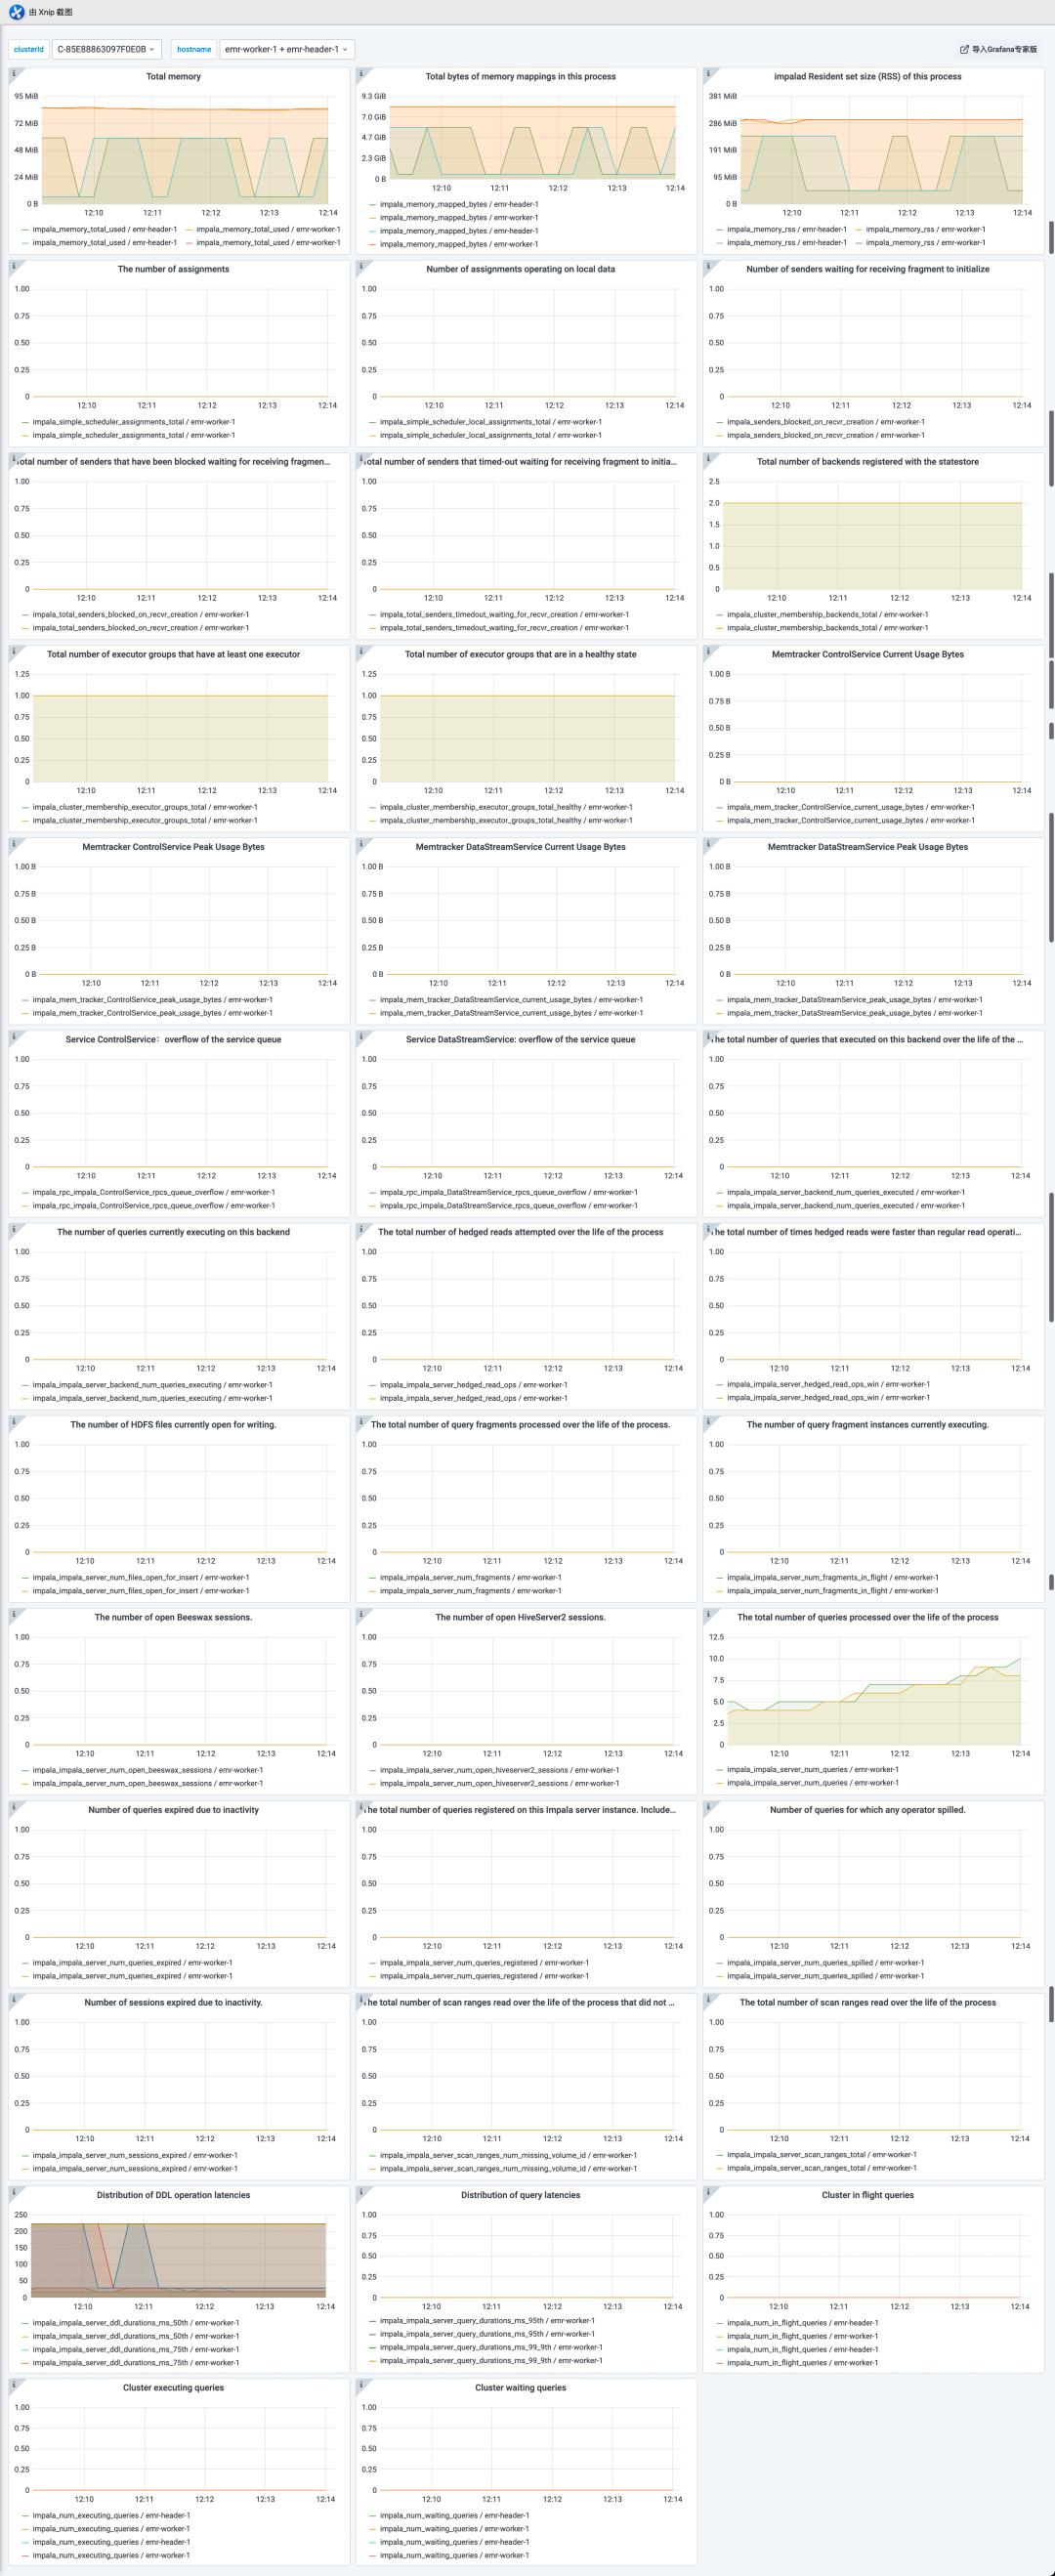
7. Impala dashboard
8. ZooKeeper dashboard
9. Go to the Spark dashboard page of the prometheus instance that is integrated with EMR. Click the E-MapReduce tab. On the page that appears, click the Dashboards tab and click the thumbnail of the dashboard to view the Grafana dashboard.

HDFS-HOME
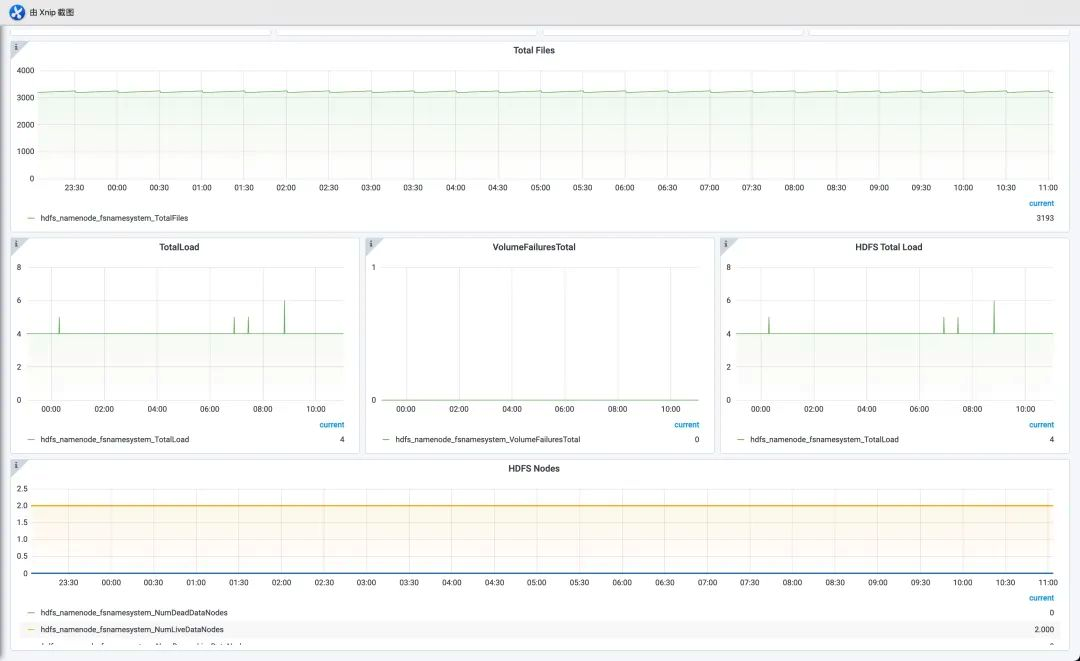
HDFS-NameNodes
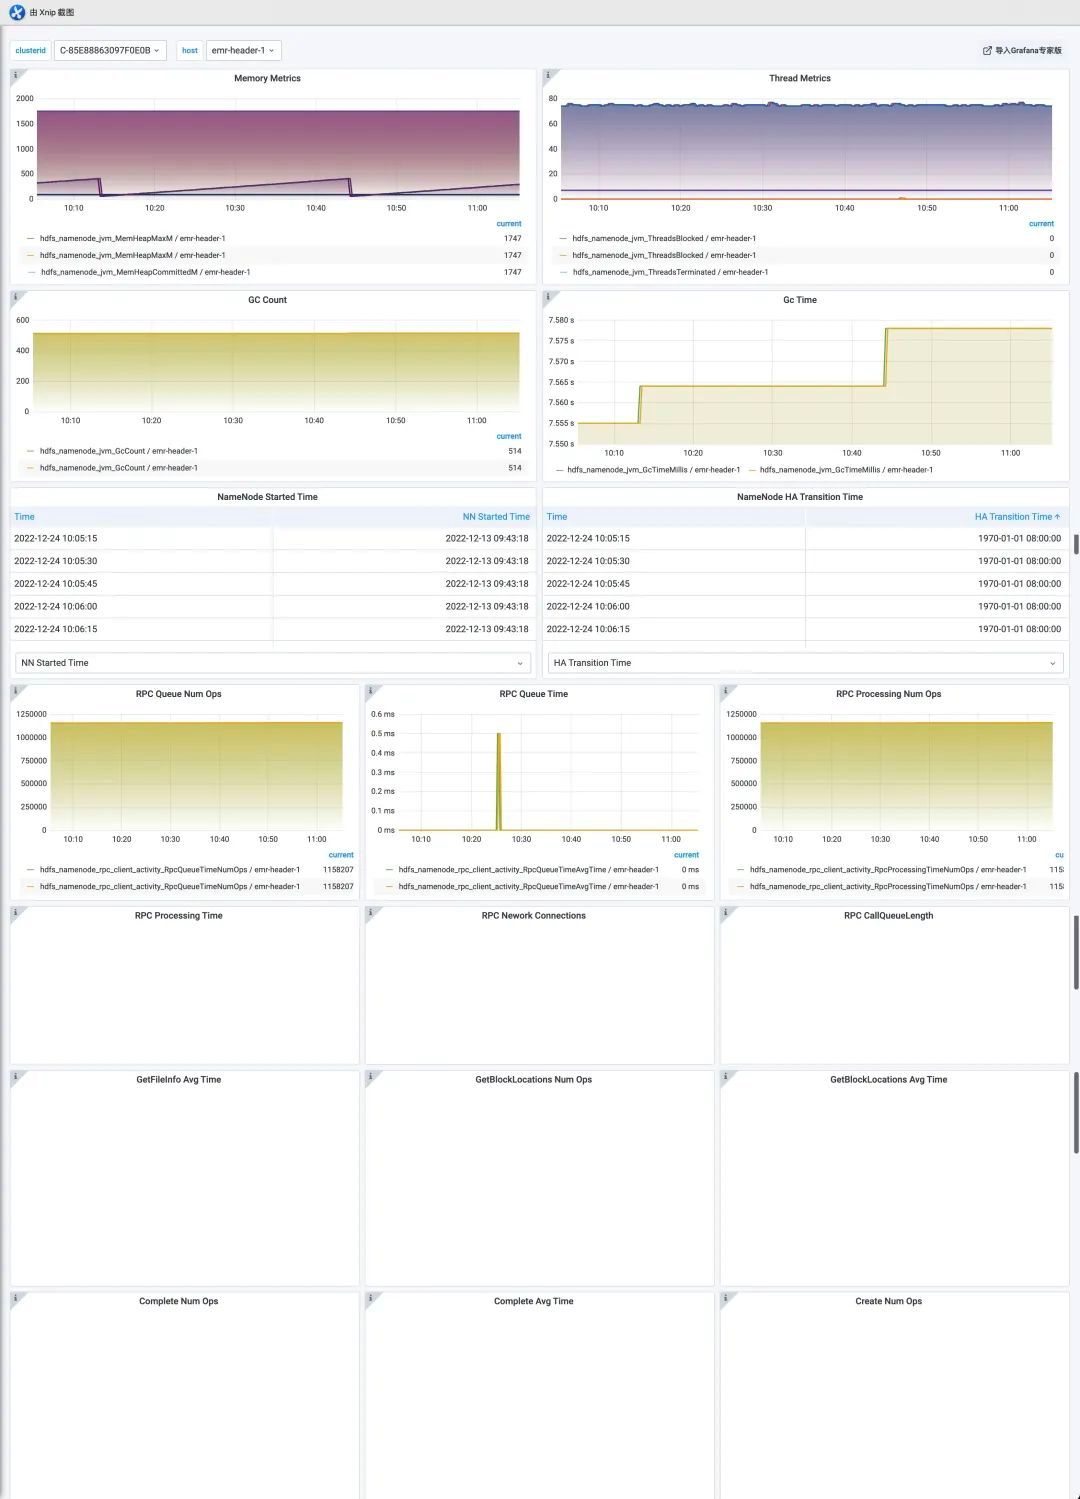
HDFS-DataNodes
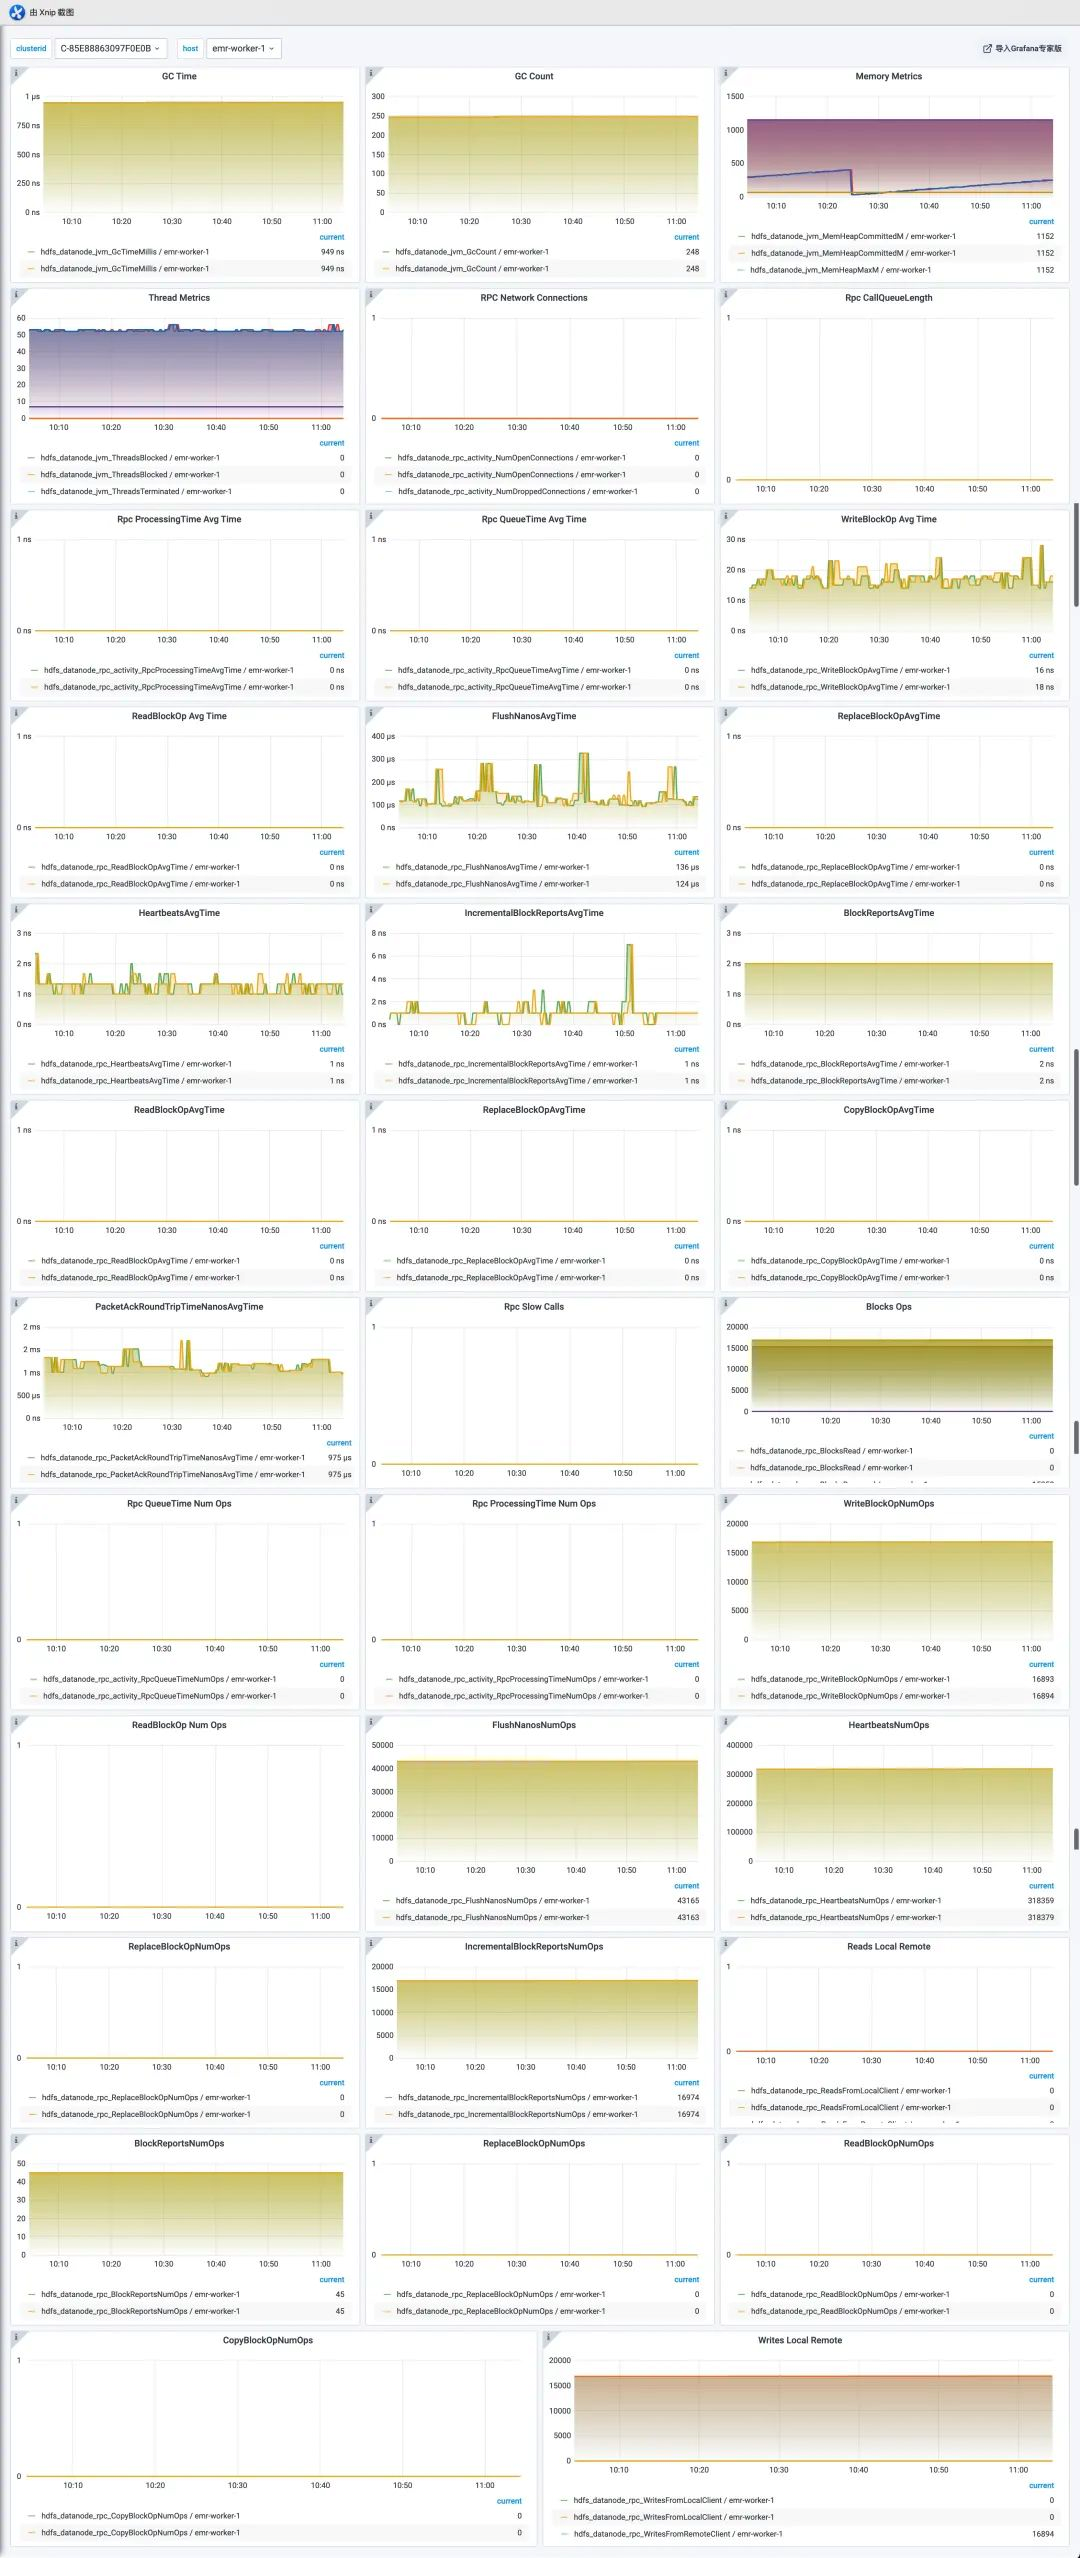
HDFS-JournanlNodes
HiveMetaStore
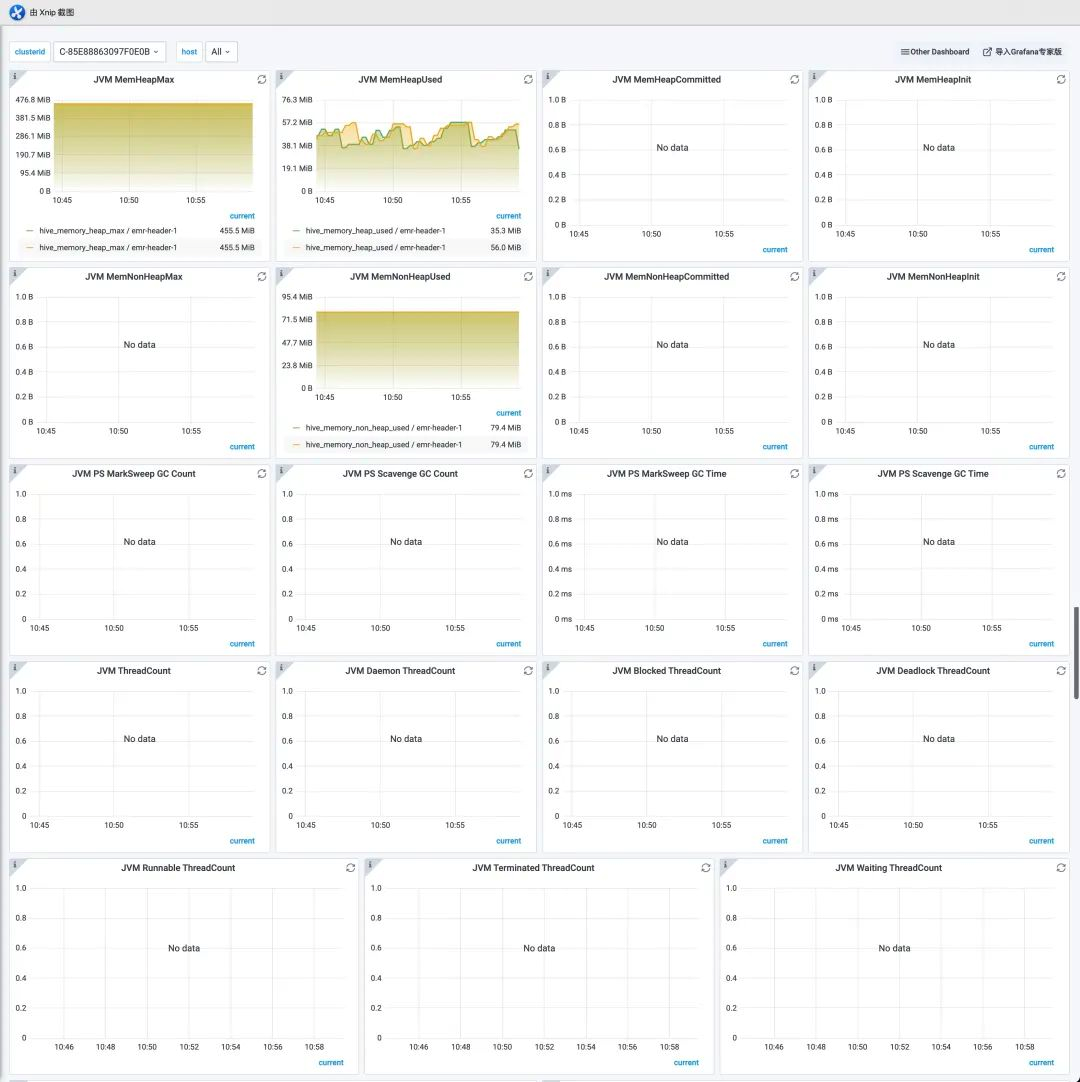
HiveServer2
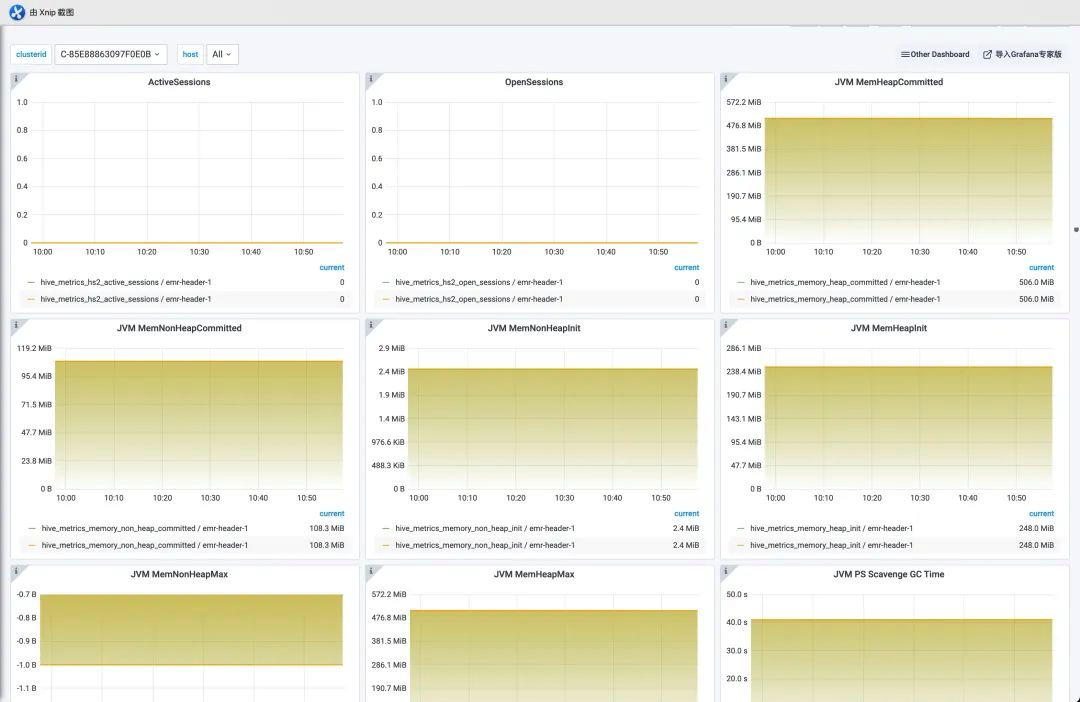
HOME
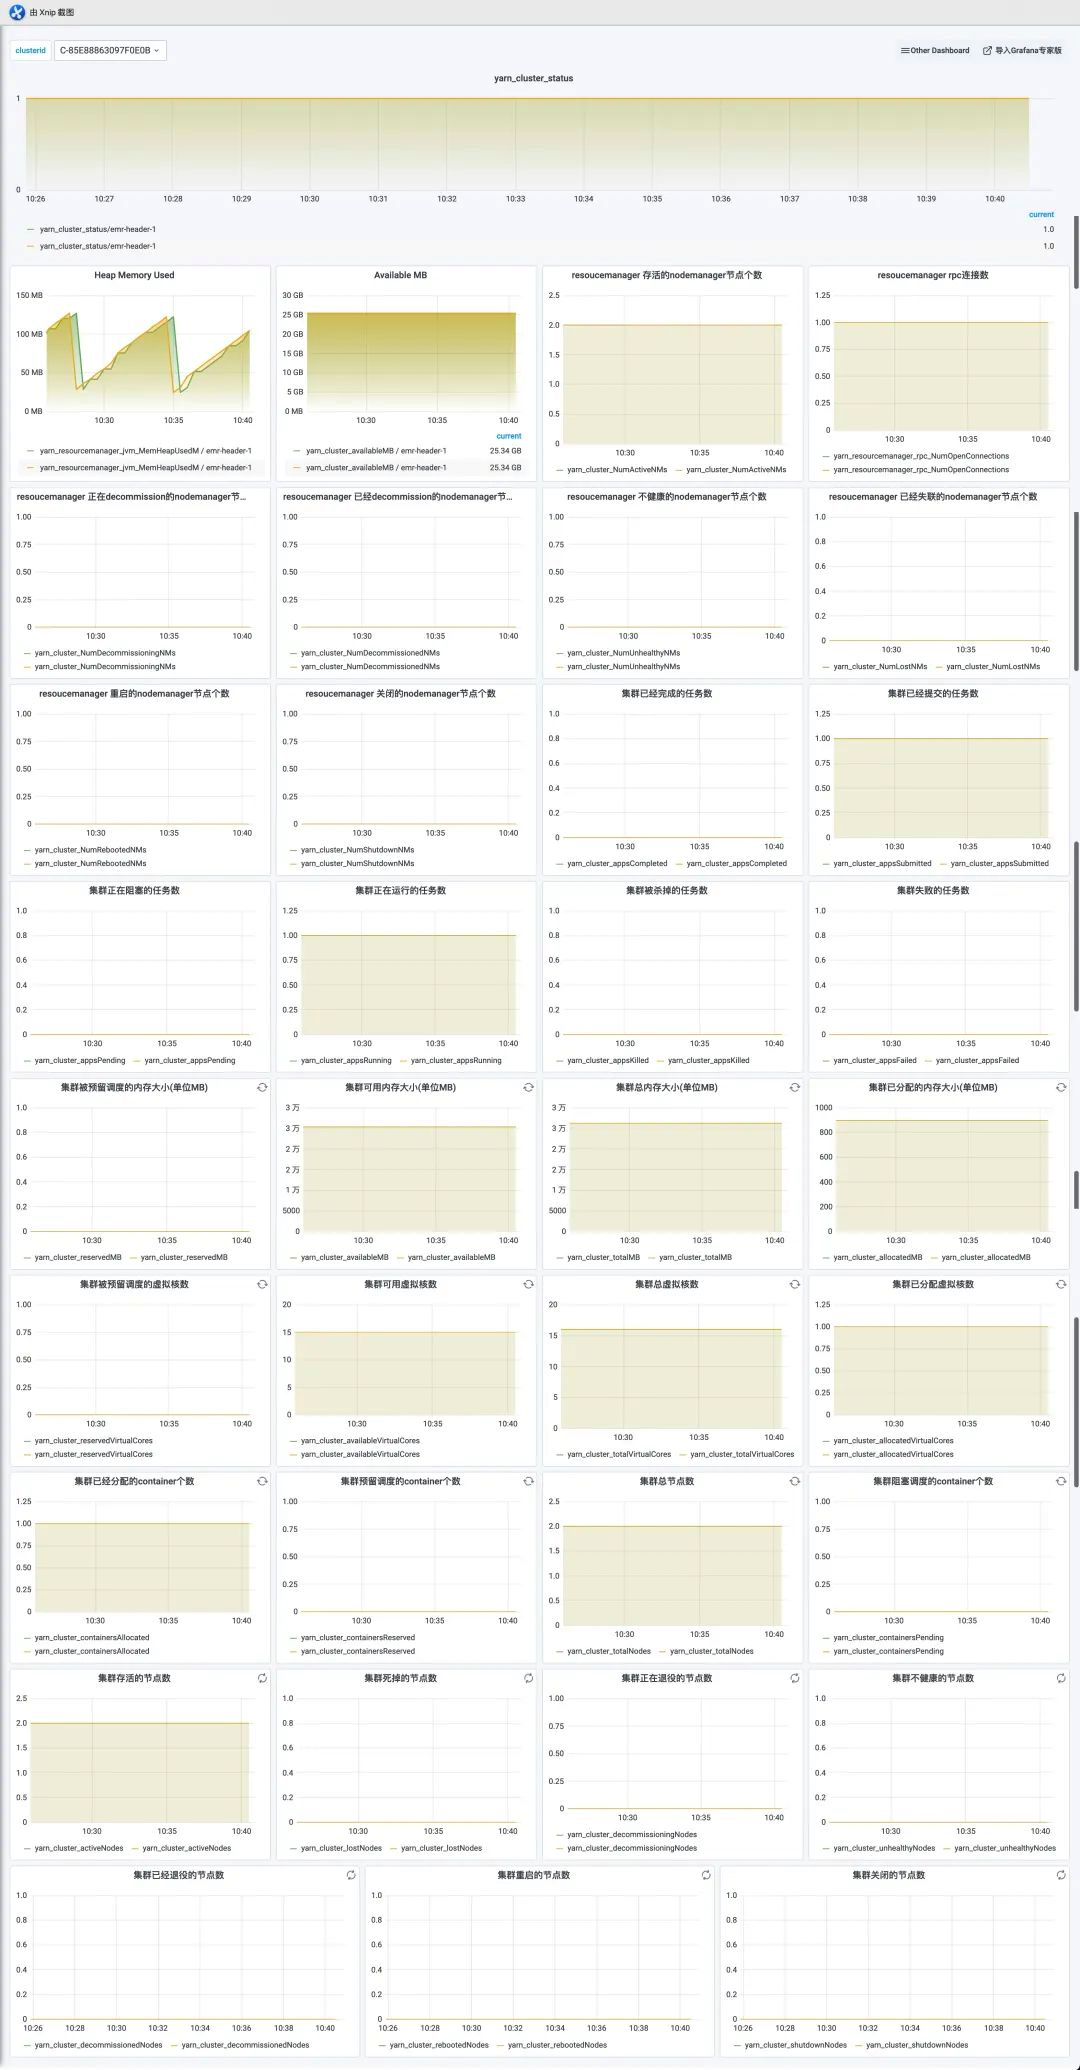
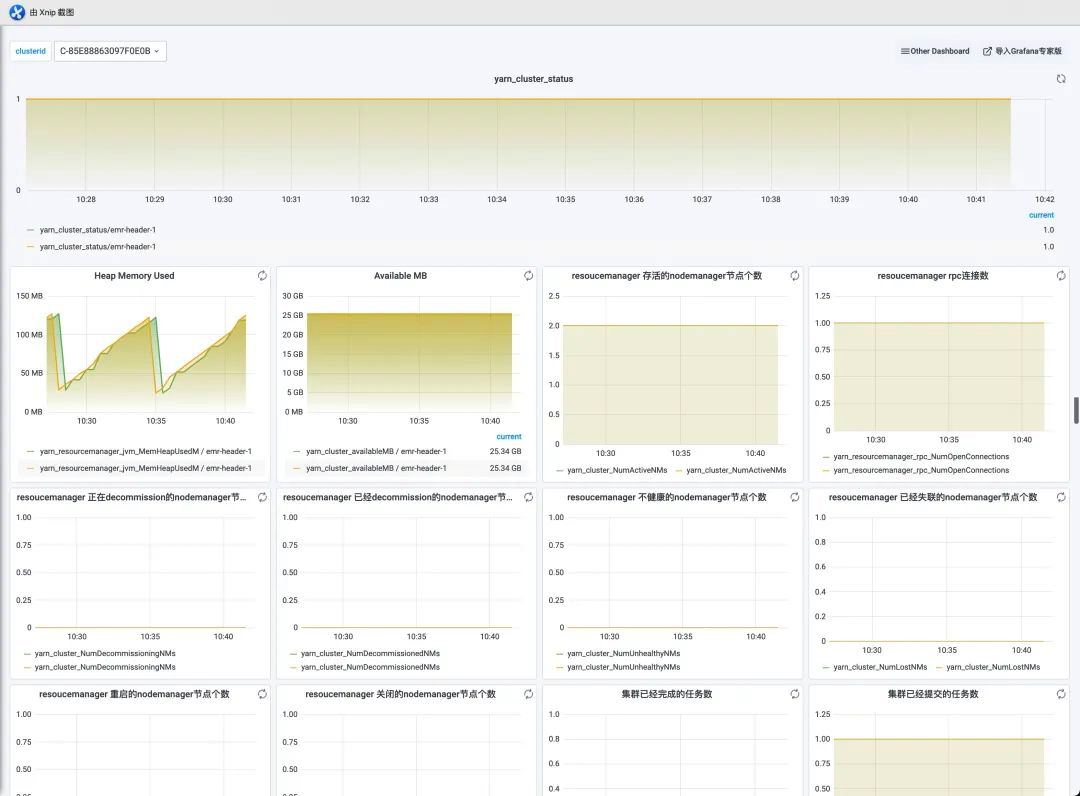
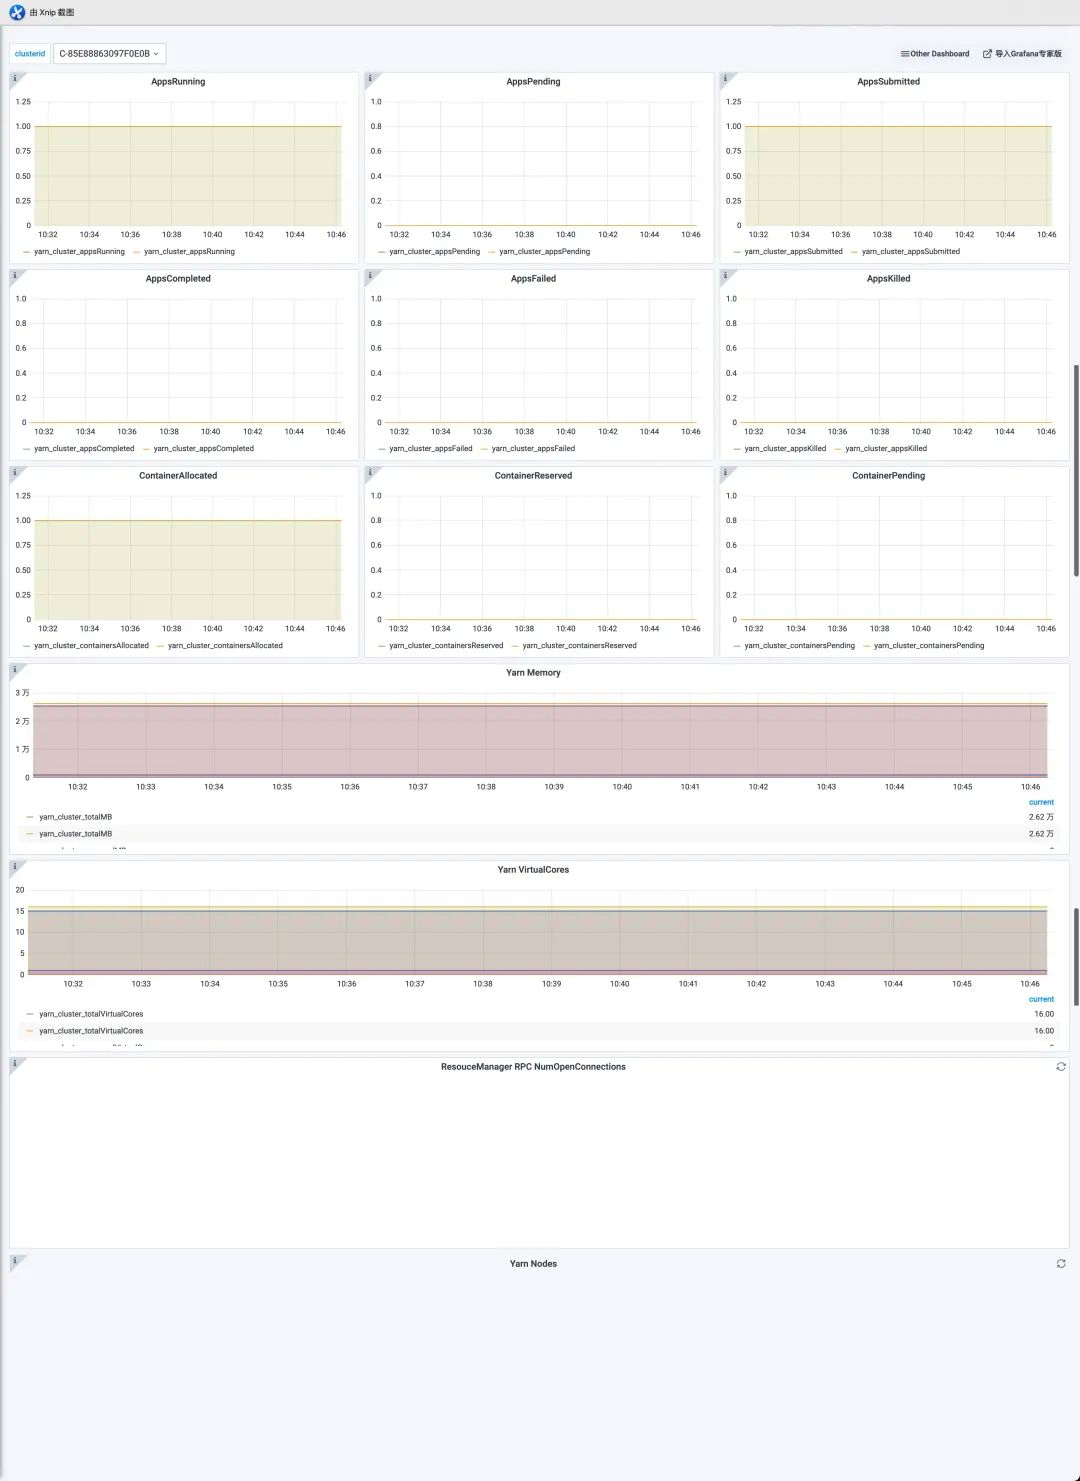
NodeManagers
JobHistory
ResourceManager
TimeLineServer
KAFKA-HOME
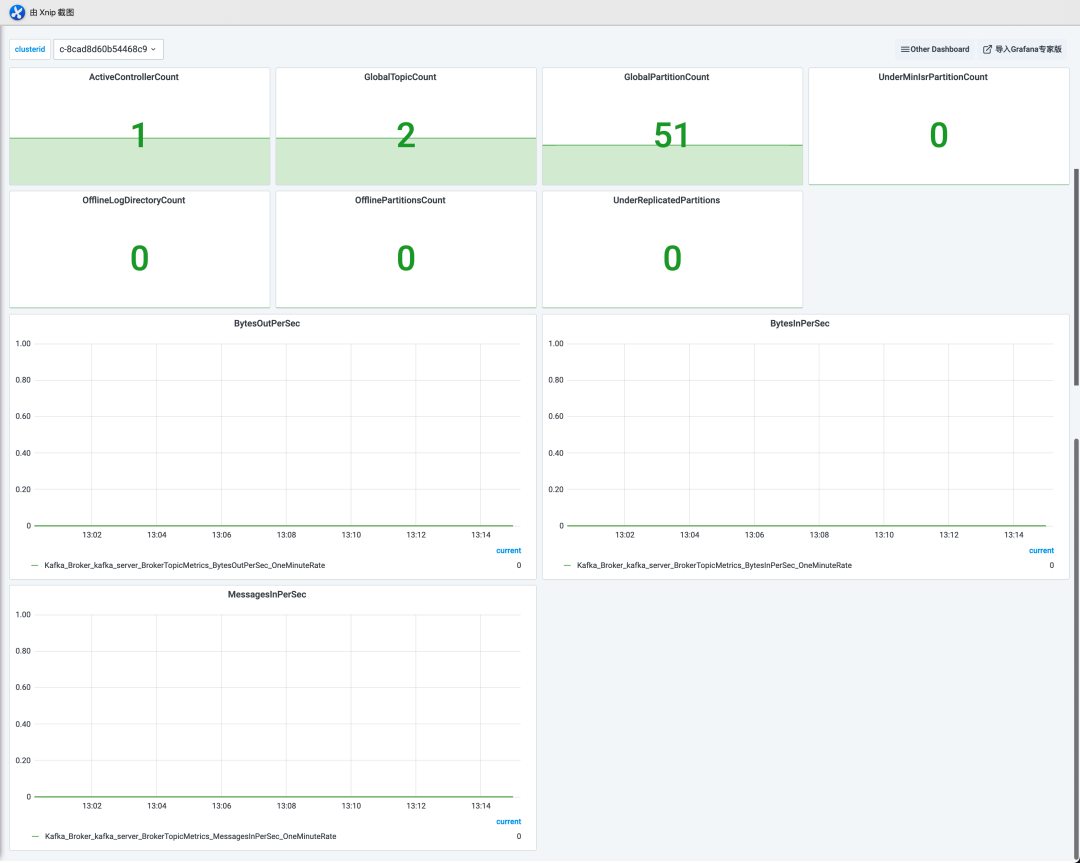
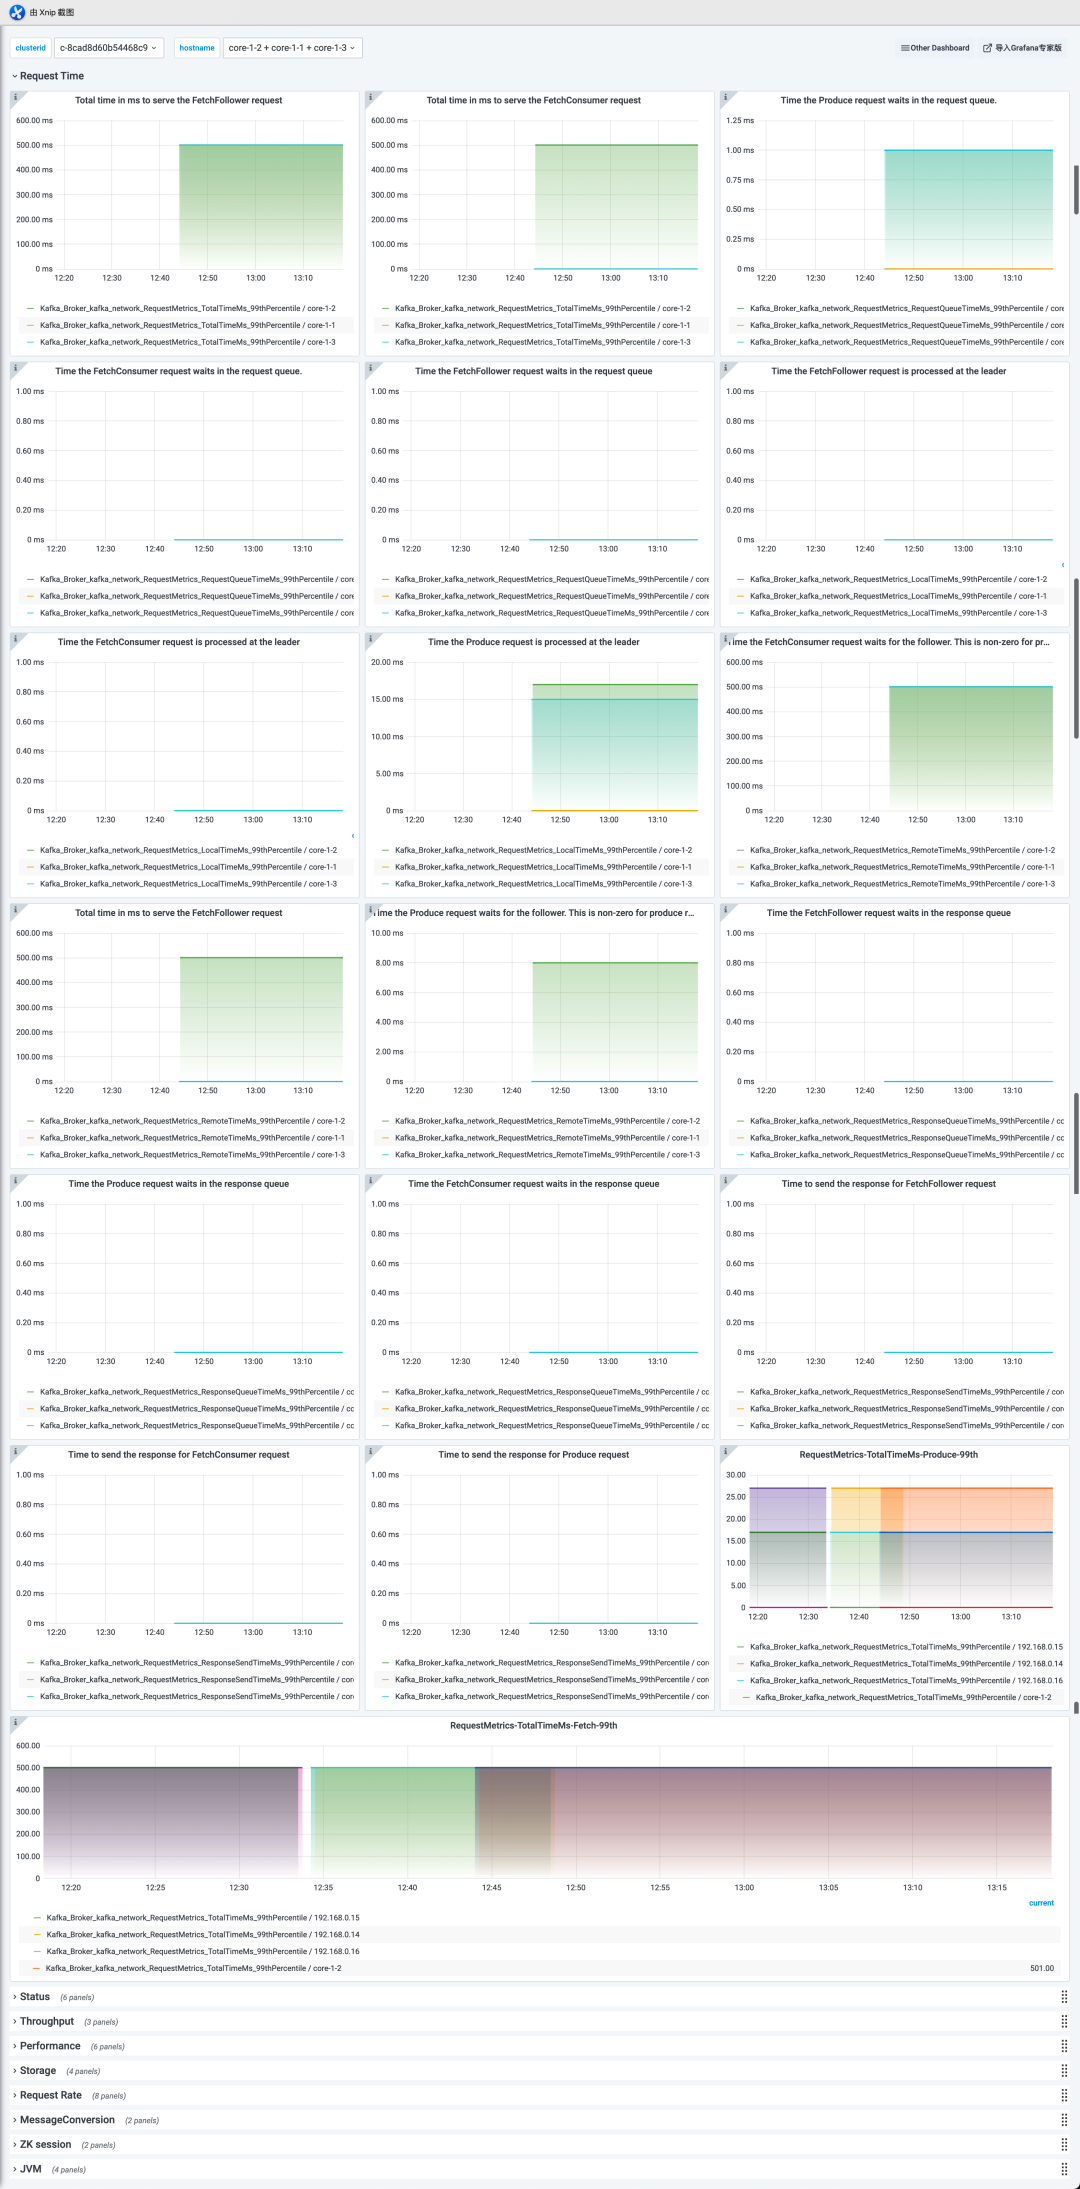
KAFKA-Broker
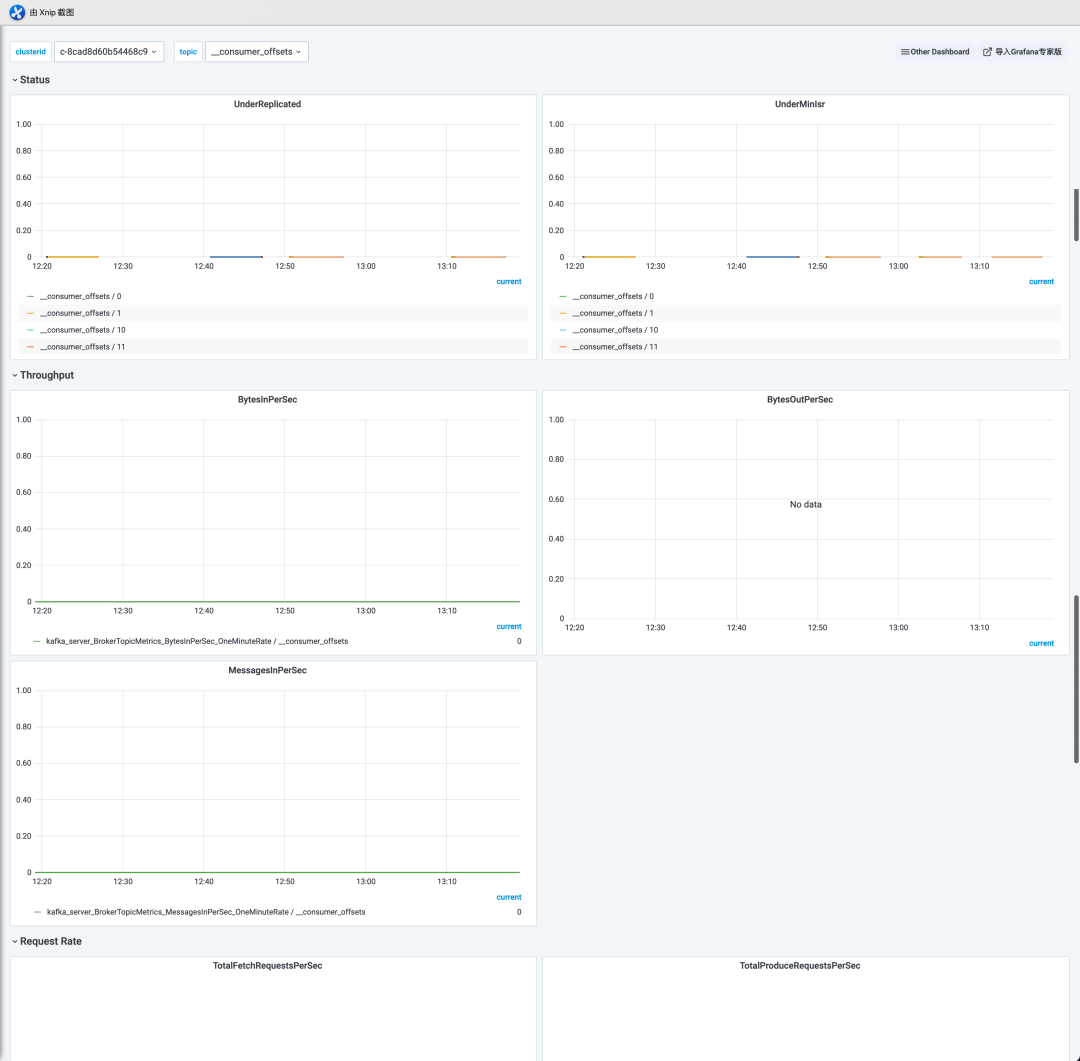
KAFKA-Topic

[1] HOST metrics
https://www.alibabacloud.com/help/en/doc-detail/426468.html
[2] HDFS metrics
https://www.alibabacloud.com/help/en/doc-detail/420598.html
[3] YARN metrics
https://www.alibabacloud.com/help/en/doc-detail/424946.html
[4] Hive metrics
https://www.alibabacloud.com/help/en/doc-detail/425274.html
[5] ZooKeeper metrics
https://www.alibabacloud.com/help/en/doc-detail/425464.html
[6] Kafka metrics
https://www.alibabacloud.com/help/en/doc-detail/425521.html
[7] Impala metrics
https://www.alibabacloud.com/help/en/doc-detail/427926.html
[8] HUE metrics
https://www.alibabacloud.com/help/en/doc-detail/428413.html
[9] Kudu metrics
https://www.alibabacloud.com/help/en/doc-detail/427958.html
[10] ClickHouse metrics
https://www.alibabacloud.com/help/en/doc-detail/425523.html
[11] Flink metrics
https://www.alibabacloud.com/help/en/doc-detail/430469.html
[12] EMR console
https://emr-next.console.aliyun.com/
[13] Alibaba Cloud Prometheus
https://arms-intl.console.aliyun.com/?spm=a3c0i.26994039.5344294060.6.41f85158SL5AUQ#/prom
Manage End-to-end Traffic Based on Alibaba Cloud Service Mesh (ASM): Traffic Lanes in Strict Mode

212 posts | 13 followers
FollowAlibaba Cloud Native - September 8, 2023
Alibaba Cloud Native - August 14, 2024
Alibaba Cloud Native Community - July 22, 2022
Alibaba Cloud Native - September 8, 2023
Alibaba Cloud Native Community - February 2, 2026
Alibaba Clouder - April 12, 2021

212 posts | 13 followers
Follow Realtime Compute for Apache Flink
Realtime Compute for Apache Flink offers a highly integrated platform for real-time data processing, which optimizes the computing of Apache Flink.
Learn More Big Data Consulting for Data Technology Solution
Alibaba Cloud provides big data consulting services to help enterprises leverage advanced data technology.
Learn More Big Data Consulting Services for Retail Solution
Alibaba Cloud experts provide retailers with a lightweight and customized big data consulting service to help you assess your big data maturity and plan your big data journey.
Learn More E-MapReduce Service
A Big Data service that uses Apache Hadoop and Spark to process and analyze data
Learn MoreMore Posts by Alibaba Cloud Native