By Kenwei
SQL Server is a relational database management system (RDBMS) designed to support a broad range of transaction processing, business intelligence, and analytics applications within corporate IT environments.
• Stability: Tailored solutions are developed according to the application requirements of enterprises, ensuring data security and the smooth operation of enterprises.
• User-friendly: It provides a variety of graphical management tools to help users quickly build database systems.
• Compatibility: It natively adapts to Windows systems and provides rich API access.
• High performance: Various database engine optimization algorithms are provided to support querying and storing large amounts of data.
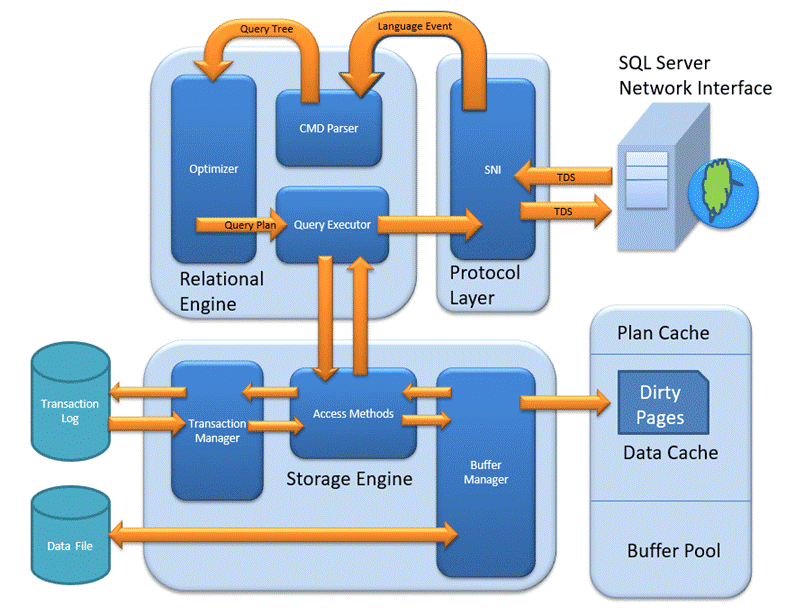
Relational Engine: The relational engine controls the processing of data by the storage engine and provides SQL Server components to determine exactly how queries should be executed. The relational engine consists of three main parts. The CMD Parser is primarily responsible for identifying and eliminating semantic and syntactic errors and generating query trees. The Optimizer ensures that the requested query response is as efficient as possible by eliminating redundant tasks and finding the optimal plan. The Query Executor creates the data fetching logic's execution plan.
Storage Engine: When data is stored in the storage engine, it is retrieved from a storage system, such as a SAN or disk. There are three types of files in the storage engine: primary files, secondary files, and log files. The Access Method is responsible for exchanging data between the cache manager and the transaction logs. The Buffer Manager caches the current execution plan and pages. The Transaction Manager uses logs and lock managers to manage transactions.
Protocol Layer: This layer supports the client-server architecture as well as streaming. The protocol layer supports three types of client-server architectures: shared memory, TCP/IP, and named pipes.
SQL Server, with its visual interface and comprehensive set of tools, is well-suited for storing all necessary information in a relational database and effortlessly managing such data.
• Transaction processing: SQL Server supports transaction processing, allowing users to combine a series of database operations and ensure they are either all executed successfully or all rolled back to the initial state. This is critical for applications requiring data consistency, such as banking transactions, online shopping, and inventory management.
• Intelligent Analysis Through Big Data Clusters: SQL Server provides robust data warehousing and business intelligence capabilities. Users can utilize SSIS to extract, transform, and load data from different sources into the data warehouse. Subsequently, SSAS can be used to create multidimensional data models and cubes to support complex data analysis and reporting requirements. Additionally, SQL Server offers data mining and predictive parsing capabilities to help organizations discover hidden patterns and trends in their data.
• Scalability: SQL Server offers a wide range of development and programming capabilities to support application developers. It also supports horizontal and vertical scalability, enabling the increase of server hardware resources or the partitioning and distribution of data among multiple servers when necessary to handle large-scale data and high concurrent loads. SQL Server provides easy integration of database management systems with any device and Azure services for improved data performance and analysis capability.
SQL Server 2022: Enhanced security, performance, and availability, query storage, and intelligent query processing.
SQL Server 2019: Data virtualization and big data clusters; intelligent database, intelligent query; in-memory database.
SQL Server 2017: Graphical database capability, dynamic management views, memory optimization, and other features.
SQL Server 2016: In-memory OLTP, Stretch Database, Hadoop integration, and other features.
This section describes the common key metrics in monitoring SQL Server services.
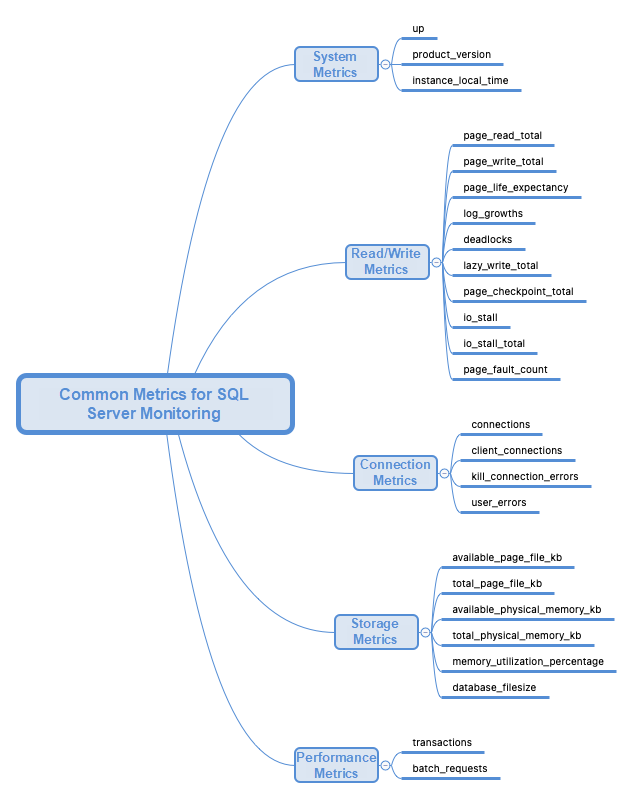
The startup status is the most basic metric for monitoring Memcached. It indicates whether the SQL Server instance is running normally or whether it is restarted. When SQL Server is restarted, the data that is not committed is lost, and the probability of generating errors is small.
The metric monitors whether the started SQL Server instance meets expectations and whether it is the SQL Server version required by your business. Ensure that the local time of the SQL Server is consistent with that of the client. Otherwise, errors may occur in the time returned by the database.
Page read/write: The page is the smallest unit of disk management for the SQL Server storage engine, and the disk space allocated for data files (.mdf or. ndf) in the database can be logically divided into pages (numbered consecutively from 0 to n). Disk I/O operations are performed at the page level. In other words, SQL Server reads or writes all data pages. Therefore, monitoring page reads and writes is particularly important. The number of read and written pages metric allows you to calculate the rate of page reads and writes to determine the execution performance of SQL Server.
The residence time of pages in the buffer pool: One of the main design goals of all database software is to minimize disk I/O, because disk read and write operations are resource-intensive. SQL Server generates an in-memory buffer pool to hold pages read from the database. We need to monitor the life duration of the page in the buffer pool. The longer the page exists in the cache pool, the more likely it is to be hit, that is, the page can be accessed without accessing the disk.
Lazy write: When a page is modified in the buffer cache, it is not immediately written back to disk. Instead, it is marked as dirty. That is, a page can be logically written multiple times before it is physically written to disk. Under normal operation, dirty pages are periodically flushed to the disk. When new data is continuously written to SQL Server, and the cache is not enough, a large number of dirty pages will be removed from the cache.
Checkpoint: When a checkpoint occurs, SQL Server requires that all dirty pages be flushed to disk. In this case, the performance of SQL Server is affected. We need to monitor the rate of checkpoints to ensure that the refresh rate of checkpoints meets expectations.
Page fault: When a page fault occurs, it indicates that the required page is outside the area of memory that SQL Server can manage. When you encounter a page fault, stop program execution and set it to a wait state. The operating system searches the disk for the requested address. When the page is found, the operating system copies it from disk to a free RAM page. The operating system allows the program execution to continue subsequently.
The SQL Server database engine writes a log entry for each operation in the database, including the start or end of SQL transactions when a data modification process is performed, when a database table or index is created or deleted, and after each page is allocated or deleted. Logs help restore the database to a specific point in time in the event of a system or hardware failure. In a highly transactional system with excessive log entry operations, the SQL Server transaction log files will grow rapidly until they reach their maximum size, resulting in error 9002. If you enable the autogrowth option, the underlying disk drive will run out of available space.
I/O stall time is a metric that can be used to detect I/O problems. When SQL Server writes data to a file or reads data from a file, it needs to wait a long time, which is the I/O stall time. A long stall time indicates I/O problems and busy disk activities. File I/O belongs to the critical path of the database, and the stall time directly reflects the latency of the client reading and writing SQL Server. Each database stores different files and may use different storage media. Therefore, in addition to monitoring the overall I/O stall time, it is also necessary to monitor the I/O stall time of each database so that O&M personnel can make targeted optimization.
In SQL Server, executing queries depends on establishing and maintaining connections on the client. When you need to maintain the availability and high performance of SQL Server, monitoring connections is a good start for O&M work. Excessive concurrent connections to SQL Server may result in server overload. When a connection is established, each connection incurs overhead regardless of whether the connection is used.
As mentioned above, although SQL Server stores data on disk, SQL Server memory usage is also a focus because of the existence of buffer pools. By default, SQL Server dynamically manages its memory requirements based on available system resources. If SQL Server needs more memory, it will query the operating system to determine whether there is free physical memory available and use the available memory. If the operating system runs out of available memory, SQL Server will release memory back to the operating system until the out-of-memory condition is mitigated or until SQL Server reaches the minimum server memory limit.
A transaction is a process in which a client sends a request to SQL Server and SQL Server responds. The client starts the timer when sending a query request and ends the timer after receiving an SQL Server response to calculate the time used and the number of completed transactions. In general, SQL Server performance is measured by the number of client requests completed per second.
T-SQL (Transact-SQL) is a set of programming extensions from Sybase and Microsoft. It adds a variety of features to Structured Query Language ( SQL ), including transaction control, exception and error handling, row handling, and declaration of a variable. All applications that communicate with SQL Server are implemented by sending T-SQL statements to the server.
| Metric | Description |
| mssql_up | Whether the instance is started or whether the instance is monitored. |
| mssql_product_version | Instance version (Major.Minor) |
| mssql_instance_local_time | Local time of the instance |
| Metric | Description |
| mssql_page_read_total | The total number of read pages |
| mssql_page_write_total | The total number of written pages |
| mssql_page_life_expectancy | The minimum lifetime (second) of the page in the buffer pool |
| mssql_log_growths | The number of times the log has been expanded |
| mssql_deadlocks | The number of deadlocks |
| mssql_lazy_write_total | The number of times the lazy write is triggered. |
| mssql_page_checkpoint_total | The number of times the page checkpoint is triggered. |
| mssql_io_stall | The total time it takes for each database to wait for io_stall (ms) |
| mssql_io_stall_total | The total time it takes for each command to wait for io_stall in each database (ms) |
| mssql_page_fault_count | The number of times the page fault is triggered. |
| Metric | Description |
| mssql_connections | Current connections |
| mssql_client_connections | The client of the current connection |
| mssql_kill_connection_errors | The number of connections interrupted by errors |
| mssql_user_errors | The number of user errors |
| Metric | Description |
| mssql_available_page_file_kb | The size of available page files (KB) |
| mssql_total_page_file_kb | The size of total page files (KB) |
| mssql_available_physical_memory_kb | The size of available physical memory (KB) |
| mssql_total_physical_memory_kb | The size of total physical memory (KB) |
| mssql_memory_utilization_percentage | Physical memory usage percentage |
| mssql_database_filesize | The file size of each database (KB) |
| Metric | Description |
| mssql_transactions | The transaction processing rate of each database |
| mssql_batch_requests | The total Transact-SQL processing rate |
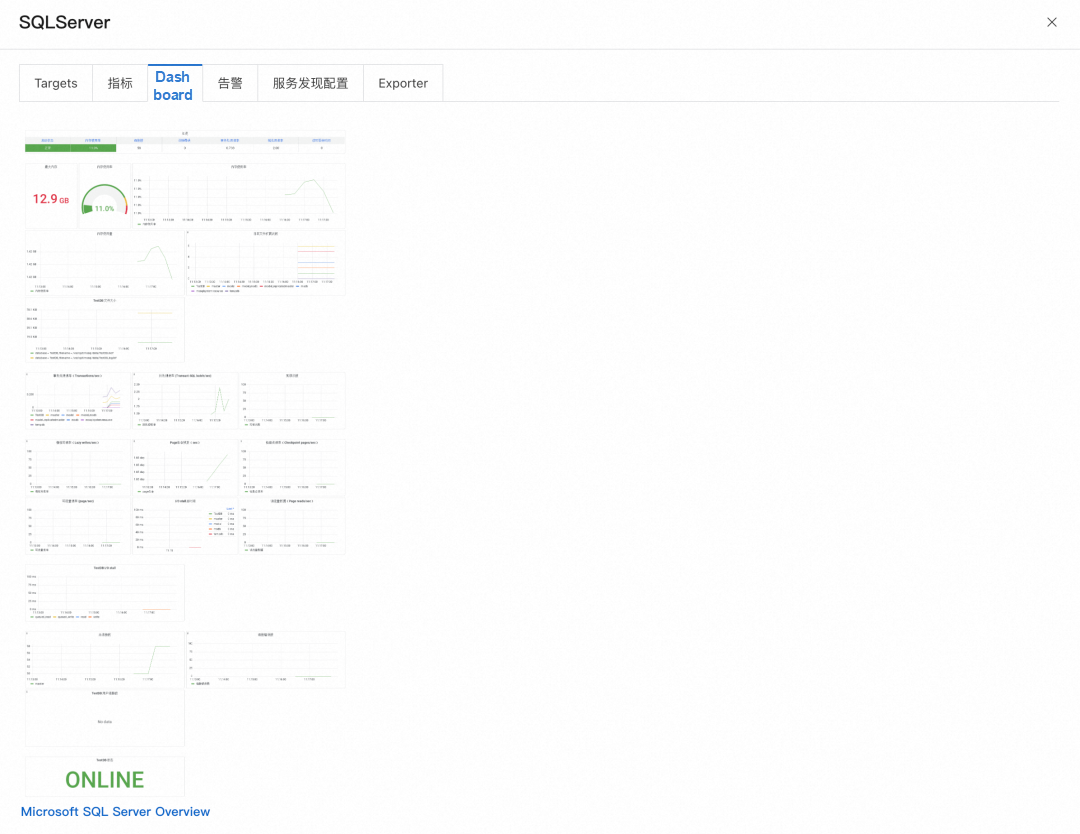
We provide the SQL Server overview dashboard by default.
In this panel, you can view the metrics that need to be focused on when SQL Server is running. When checking the SQL Server status, first check whether there is any abnormal status in the overview and then check the specific metrics.
• Startup status: Green indicates that the operation of SQL Server is normal, and red indicates that the operation of SQL Server is abnormal.
• Memory usage rate: Green indicates that the memory usage rate is below 80%, yellow indicates that the memory usage rate is from 80% to 90%, and red indicates that the memory usage rate is above 90%.

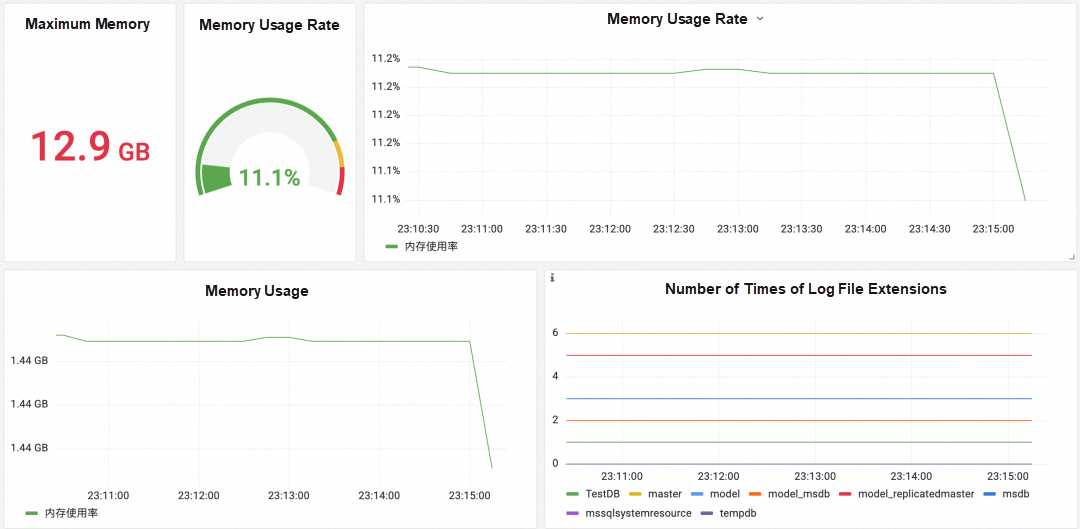
Memory is the key hardware resource of SQL Server. Through this panel, you can understand the memory usage of SQL Server:
• Maximum memory: provides the overall memory status.
• Memory usage rate/usage: analyzes memory usage trends.
• The number of times of file extensions: analyzes the trend of the operation data volume.
• The size of database files: displays the trend of data volume and the trend of the number of logs stored in the database.

In the following panels, you can view the operating efficiency of SQL Server. There are three categories:
• Transaction processing rate: indicates the number of transactions processed by SQL Server per second, which directly affects the latency of client query requests.
• Batch rate: indicates how many Transact-SQL can be processed by SQL Server per second.
• The number of deadlocks: checks whether deadlocks occur due to database contention, which seriously affects performance.

You can see the operating efficiency of SQL Server in the following panel:
• Read/Write page rate: monitors the rate trend of read/write pages to determine whether the expected rate is reached and whether peaks and troughs occur.
• Lazy write rate: periodically enters the rate trend of dirty pages to monitor whether it is stable.
• Page life expectation: the higher the page life expectation, the better.
• I/O stall time: the trend of stall time for SQL Server to read and write files.
• Checkpoint rate: when checkpoints occur, you need to monitor the running rate.
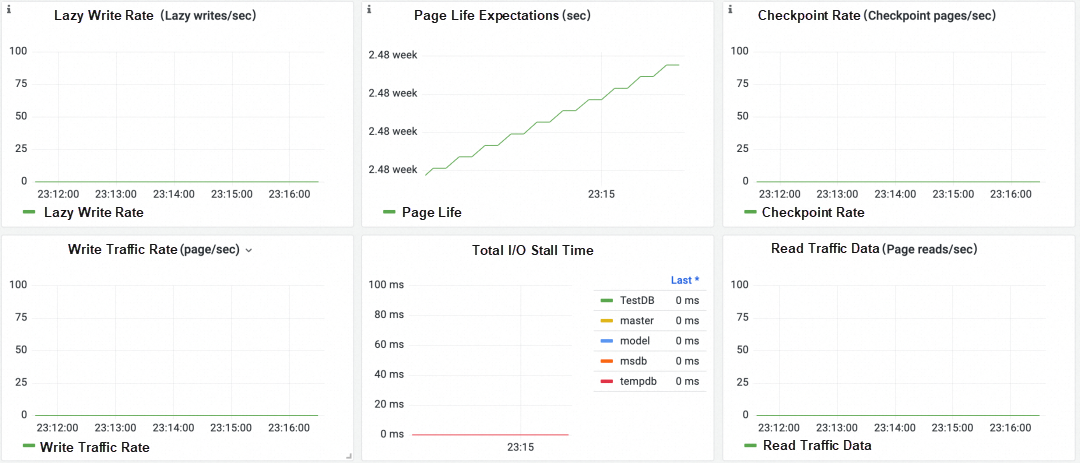
In addition to monitoring the overall I/O stall time of SQL Server, you also need to monitor the I/O stall times of databases separately. The files stored in each database are different, and the storage disks may be different. You need to make a targeted optimization solution.

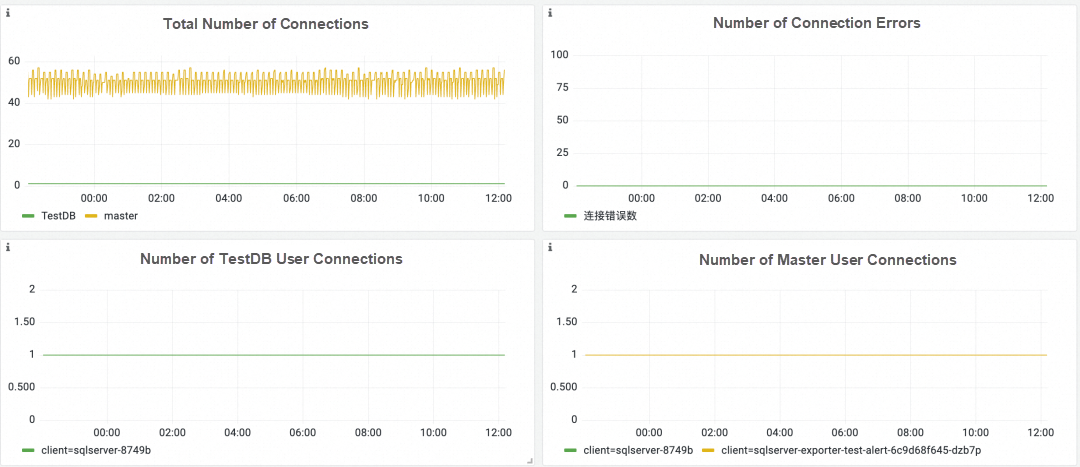
You need to check the connection status of SQL Server at any time to prevent excessive concurrency from affecting performance.
• The total number of connections: monitors the trend of the total number of connections.
• The number of connection errors: monitors whether there are connection errors in clients to ensure the normal operation of the system.
• The connection users of each database: monitors the clients connected to each database and the number of connections initiated by each client.
It monitors whether each database is running normally. The following table defines the status of the database.
| Status | Description |
| ONLINE | The database can be accessed. The primary filegroup remains online even though the undo phase of recovery may not have completed. |
| OFFLINE | The database cannot be used. The database is offline due to an explicit user operation and remains offline until another user operation is performed. For example, a database might be taken offline to move files to a new disk. Then, after the files are migrated to the new disk, the database is restored to the online state. |
| RESTORING | One or more files of the primary filegroup are being restored, or one or more secondary files are being restored offline. The database is unavailable. |
| RECOVERING | The database is being recovered. The recovery process is a transient state. After a successful recovery, the database is automatically brought online. If the recovery fails, the database is in a suspect state. The database is unavailable. |
| RECOVERY PENDING | SQL Server encountered resource-related errors during recovery. The database is not corrupted, but files may be missing, or system resource limitations may prevent the database from starting. The database is unavailable. Users are required to perform additional operations to resolve the problem and allow the recovery process to complete. |
| SUSPECT | At least the primary filegroup is suspect or possibly corrupted. The database cannot be recovered during SQL Server startup. The database is unavailable. Users are required to perform additional operations to solve the problem. |
| EMERGENCY | The user changed the database and set its status to EMERGENCY. The database is in single-user mode and can be repaired or restored. The database is marked as READ_ONLY, log entry is disabled, and access is limited to members of the sysadmin fixed server role. EMERGENCY is primarily used for troubleshooting. For example, a database marked as "SUSPECT" can be set to an EMERGENCY state. This allows the system administrator to have read-only access to the database. Only members of the sysadmin fixed server role can set a database to the EMERGENCY state. |

When configuring alert rules for SQL Server, we recommend configuring alert rules based on the collected metrics above from the following aspects: operation status, resource usage, and connection usage. Generally, we generate alert rules that affect the normal use of SQL Server by default, which has a higher priority. Business-related alerts, such as the read /write rate, are customized by users. The following are some recommended alert rules.
SQL Server downtime is an alert rule with a threshold between 0 and 1. Generally, SQL Server services deployed in Alibaba Cloud environments such as ACK are highly available. When one SQL Server instance is stopped, other instances continue to work. This alert may be sent when all SQL Servers fail to start normally or when data cannot be obtained due to Exporter errors. By default, we set an alert to be reported if SQL Server cannot recover within 5 minutes.
SQL Server restart is an alert rule with a threshold between 0 and 1. In most cases, SQL Server does not lose data due to the existence of logs. However, the contents in the buffer pool are cleared after SQL Server restarts, causing temporary slow queries. A transaction that is being executed must be rolled back to the client, causing a series of temporary errors. The client is required to re-initiate the request.
The usage policy of SQL Server on server memory is to occupy as much memory as it uses. If there is no restriction, it is possible to occupy all the memory resources of nodes. When the memory usage is too high, SQL Server cannot run normally. We set a danger value and an alert value when the memory usage is 80% and 90%, respectively. When the memory usage is 80%, the node runs under high load, but the normal use is not affected. When the memory usage is 90% for a long period of time, an alert is sent to indicate that O&M resources are in short supply. You should handle this problem as soon as possible.
Deadlocks in SQL Server are an alert rule with a threshold between 0 and 1 regardless of the number of deadlocks. The number of deadlocks encountered in a system is usually very small, and once a deadlock occurs, it is necessary to terminate the current batch executed by threads, roll back the transactions of the deadlock victims, and return an error message to the client.
The connection errors in SQL Server are an alert rule with a threshold between 0 and 1. This error can occur for a number of reasons. For example, the remote host forcibly closes an existing connection, or the timeout expires. Before the operation is completed, if the timeout period has expired, the server does not respond, or the SSPI context cannot be generated, you need to log on to the database and check the logs to find out the causes of such errors.
The poor performance of SQL Server is reflected in low transaction processing rate (TPS) and batch (T-SQL) rate. There are many possible reasons for poor performance. We need to troubleshoot them based on multiple metrics.
• Cause: When the memory is insufficient, the buffer pool cannot cache all hot data, resulting in multiple data access requests sent to the disk.
• Troubleshooting method: View the memory usage panel in the dashboard to check whether the memory usage is consistently high. Check the alert history to see if there is a message indicating insufficient memory resources.
• Solution: Optimize the disk resources of the corresponding node.
• Cause: A long I/O stall time indicates I/O problems and heavy disk activities.
• Troubleshooting method: View the I/O stall time panel in the dashboard to check whether the I/O stall time is consistently high. Check the alert history to see if there is a message indicating insufficient memory resources.
• Solution: There may be a large number of peak accesses, suddenly increasing disk accesses. You can consider optimizing SQL Server architecture, further check whether the file system of the node has I/O problems, and optimize the disk resources of the corresponding node.
• Cause: When any modification is performed in the database, SQL Server writes the modifications to the log buffer and then writes the buffer data to disk. When excessive data is written, the log contents cannot be flushed to the disk in time.
• Troubleshooting method: View the panel of log growth times in the dashboard to check whether the log growth times suddenly increase in a certain period of time.
• Solution: The disk selected for the log files must perform well in terms of sequential read/write throughput and minimal latency.
• Cause: When a checkpoint is executed, SQL Server flushes all dirty pages in the memory to the disk, which affects the overall database performance and puts a lot of pressure on the disk.
• Troubleshooting method: View the checkpoint panel to check if there is data about the checkpoint rate, which indicates that the checkpoint operation was performed during the time period.
• Solution: Design the timing of checkpoints to avoid peak hours as much as possible.
Generally, our current SQL Servers are deployed on ECS. Therefore, when self-managed Prometheus monitors SQL Server, we will face the following typical problems:
• Log on to the ARMS console [1].
• In the left-side navigation pane, choose Prometheus Monitoring> Prometheus Instances to go to the Prometheus Instances page of Managed Service for Prometheus.
• Click the name of the Prometheus instance that you want to manage to go to the Integration Center page.
• Find SQL Server and click Install.
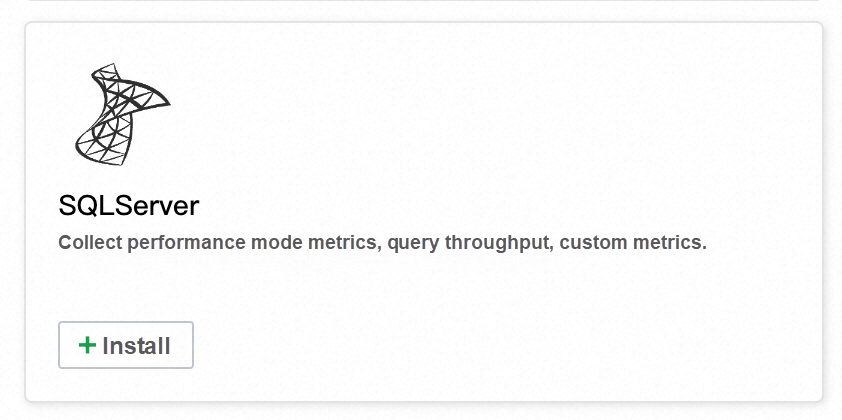
• Configure the parameters and click OK.
| Parameter | Description |
| Exporter Name | The unique name of the SQL Server exporter. The name must meet the following requirements: • It can contain only lowercase letters, digits, and hyphens (-), and cannot start or end with a hyphen (-). • It must be unique. |
| SQL Server address | The endpoint of the SQL Server instance. This parameter must be entered. Example: 127.0.0.1. |
| SQL Server port | The port number of the SQL Server instance. Default number: 1433. |
| SQL Server username | The username of the SQL Server instance. This parameter must be entered. For example, sa. |
| SQL Server password | The password of the SQL Server instance. This parameter must be entered. |
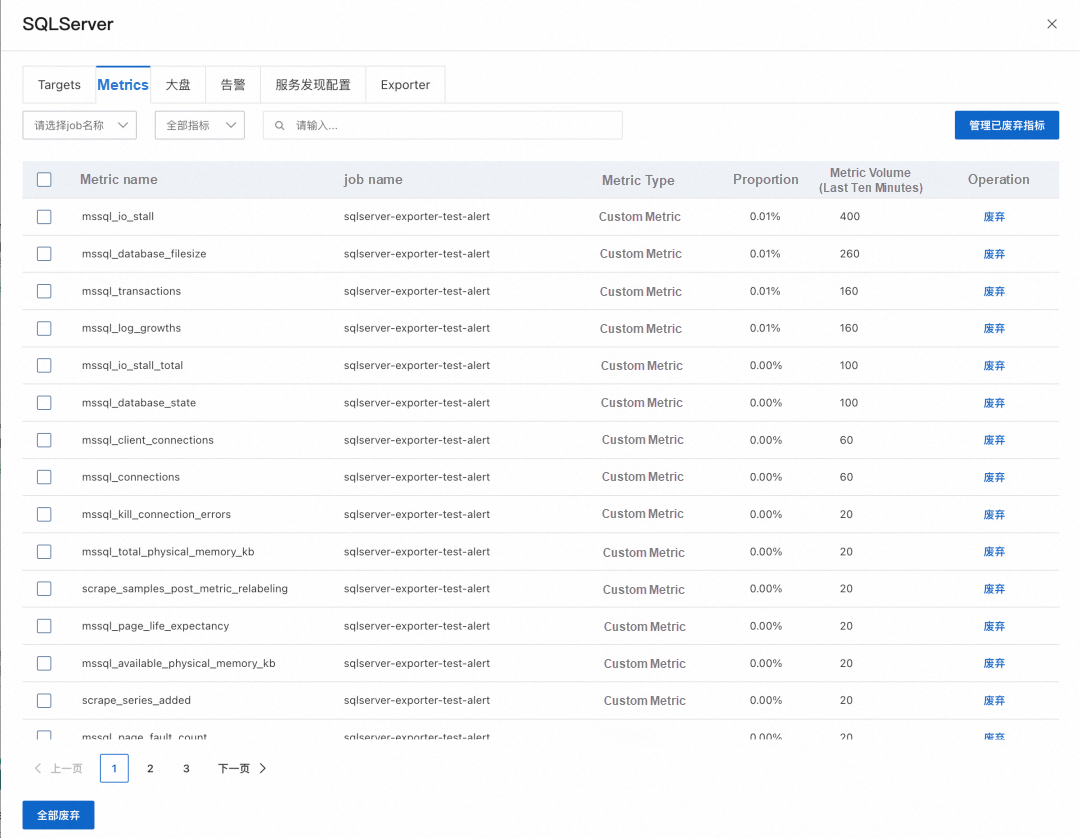
The installed exporters are displayed in the Installed section of the Integration Center page. Click the component. In the panel that appears, you can view information such as targets, metrics, dashboards, alerts, service discovery configurations, and exporters.

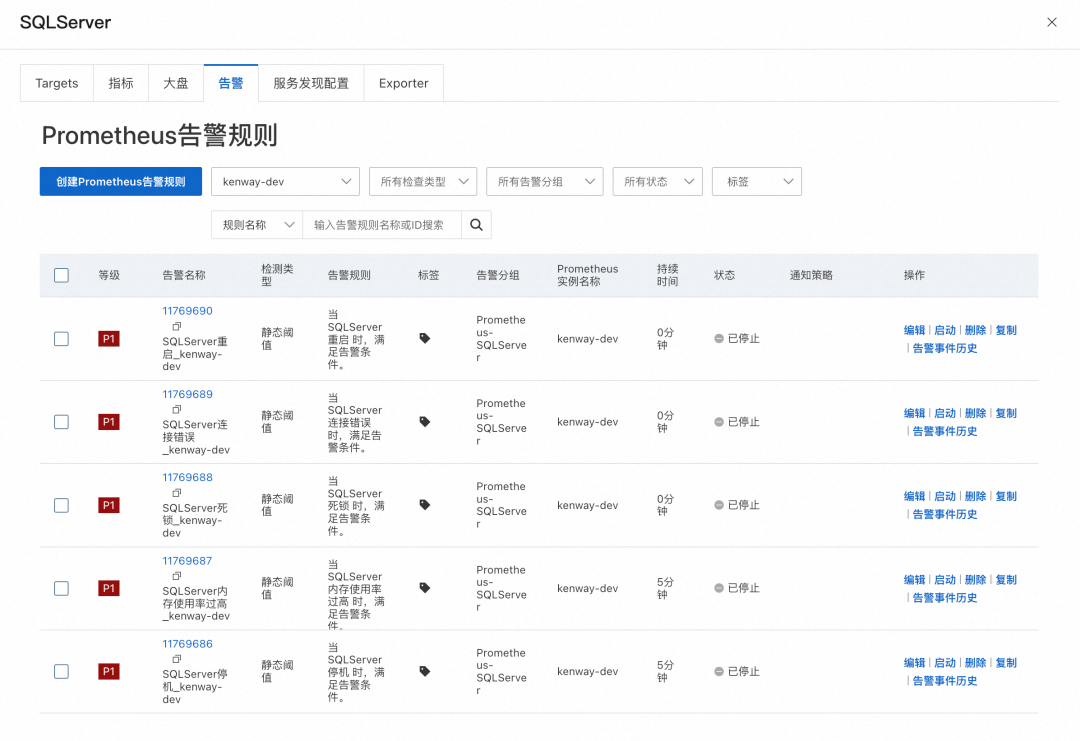
As shown in the following figure, you can view the key alert metrics provided by Managed Service for Prometheus.
On the Dashboards tab, you can click a dashboard thumbnail to go to the Grafana console and view the details of the dashboard.
You can click the Alerts tab to view SQL Server Prometheus alerts. You can also create alert rules based on your business requirements. For more information, see Create an alert rule for a Prometheus instance[2].
| Self-managed Prometheus systems | Alibaba Cloud Managed Service for Prometheus | |
| Deployment costs and O&M costs | Prometheus, Grafana, and AlertManager are deployed in multiple VPCs, resulting in high O&M costs. | Prometheus, Grafana, and the alert center are integrated, fully managed, O&M-free, and out-of-the-box. |
| Service discovery | Service discovery should be configured by yourself, which is inconvenient to use and has high maintenance costs. | A graphical interface greatly simplifies the configuration and maintenance complexity of service discovery. |
| Grafana dashboard | The open source dashboard is too simple to obtain effective information. | The professional Memcached dashboard template allows you to quickly and accurately understand the running status of Memcached and troubleshoot the causes of problems. |
| Alert rules | The default alert is missing and needs to be configured by the user. | It provides professional and flexible alert metric templates based on the monitoring time. |
[2] https://www.sqlshack.com/sql-server-troubleshooting-disk-i-o-problems/
[8] https://www.sqlshack.com/sql-server-transaction-log-growth-monitoring-and-management/
[9] https://blog.csdn.net/Superman7658/article/details/130799559
[1] ARMS console
[2] Create an alert rule for a Prometheus instance
Optimal Multi-language Application Monitoring: ARMS eBPF Edition

212 posts | 13 followers
FollowAlibaba Cloud Native - September 8, 2023
Alibaba Cloud Native - September 11, 2023
Alibaba Cloud Native Community - July 26, 2022
Alibaba Cloud Native - August 14, 2024
Alibaba Cloud Native - November 6, 2024
Alibaba Cloud Native - March 1, 2024

212 posts | 13 followers
Follow Best Practices
Follow our step-by-step best practices guides to build your own business case.
Learn More ApsaraDB RDS for SQL Server
An on-demand database hosting service for SQL Server with automated monitoring, backup and disaster recovery capabilities
Learn More Server Load Balancer
Respond to sudden traffic spikes and minimize response time with Server Load Balancer
Learn More Simple Application Server
Cloud-based and lightweight servers that are easy to set up and manage
Learn MoreMore Posts by Alibaba Cloud Native