Observability was the hottest O&M topic in 2022. Observability extends from traditional monitoring scenarios and gradually covers the Metrics, Traces, and Logs dimensions and integrates them. Observability helps enterprises troubleshoot and locate problems in complex distributed systems faster. It is an essential O&M tool in distributed systems.
Observability is an important thing in the performance test field. It can help locate performance problems. In addition, its Metrics directly determine whether the stress test is passed and whether the system can be launched. Details are listed below:
Metrics
Logs
Traces
It is used in the performance diagnosis phase. It can quickly locate performance problems by tracing the call chain of the request in the system and locating the error reporting system and the stack of the API that reports errors.
This article describes how to use Prometheus to achieve the observability of performance test metrics.
During stress testing, it is important to monitor metrics of system hardware, middleware, and database resources, including system performance metrics, resource metrics, middleware metrics, database metrics, frontend metrics, stability metrics, batch processing metrics, scalability metrics, and reliability metrics.
1. Transaction Response Time
a) Definition and Interpretation: Response time refers to the time when the user sends a request from the client and receives the response from the server. In performance testing, response time refers to the time it takes from the pressure initiator to the server to be tested to return processing results and is generally measured in seconds or milliseconds. Average response time refers to the average response time of the same transaction during the stable operation period of the system. In general, the transaction response time refers to the average response time. The metric value of average response time should be set according to different transactions. Generally, it is divided into complex transaction response time, simple transaction response time, and special transaction response time. Among them, the setting of special transaction response time must clarify the particularity of the transaction in terms of response time.
b) Abbreviations: Response Time: RT
c) Reference Standards: The acceptable response time for businesses in different industries is different. In general, for online real-time transactions: for batch transactions:
2. System Processing Capacity
a) Definition and Interpretation: System processing capacity refers to the ability of the system to process information using the system hardware platform and software platform. The system processing capacity is evaluated by the number of transactions that the system can process per second. There are two ways to understand transactions. First, it is a business process from the perspective of business personnel. Second, it is a transaction application and response process from the perspective of the system. The former is called a business transaction process, and the latter is called a transaction. Both transaction metrics can evaluate the processing capacity of the application system. It is recommended that the metrics are consistent with the system transaction logs to facilitate the statistics of business volume or transaction volume. System processing capacity metrics are important in technical testing activities.
b) Abbreviations: In general, the following metrics are used to measure system processing capacity.
c) Standard: Regardless of TPS, QPS, or HPS, these metrics are important for measuring the system processing capacity. The larger the value, the better the effect. According to experience, the preferred value is listed below:
3. Concurrent Users
a) Definition and Interpretation: The number of concurrent users refers to the number of users who log on to the system and perform business operations at the same time. For a long connection system, the maximum number of concurrent users is the concurrent access capability of the system. For a short connection system, the maximum number of concurrent users is not equal to the concurrent access capability of the system. It is related to various factors (such as system architecture and system processing capacity). For example, if the system has strong throughput, coupled with the connection reuse of a short connection system, the number of concurrent users is generally greater than the number of concurrent access connections of the system. Therefore, for most systems with short connections, the throughput mode (RPS mode or Request Per Second) is more suitable and is also the best practice of Alibaba Cloud. PTS supports stress testing in RPS mode, and the construction and measurement of throughput stress testing are in place in one step. In the test, virtual users are used to simulate real users to perform business operations.
b) Abbreviations: Virtual User: VU
c) Standard: In general, the performance test measures the system processing capacity instead of testing the number of concurrent users. The long connection of the server may affect the number of concurrent users, and the system processing capacity is not affected by the number of concurrent users. Therefore, the system processing capacity can be tested with the smallest number of users or with more users.
4. Failure Ratio
a) Definition and Interpretation: Failure Ratio refers to the proportion of failed transactions when a system is loaded. Failure ratio = (number of failed transactions/total number of transactions) x 100%. The failure ratio of a stable system is caused by timeout. Therefore, the failure ratio is the timeout ratio.
b) Abbreviation: Virtual Failure Ratio:FR:VU
c) Standard: Different systems have different requirements for failure ratio, but generally, it does not exceed 6‰. The success rate is not less than 99.4%.
1. CPU
a) Definition and Interpretation: The central processing unit is an ultra-large-scale integrated circuit and is the processing core and control core of a computer. Its function is mainly to interpret computer instructions and process data in computer software. CPU Load is used to measure how much work the system is processing.
b) Abbreviations: Central Processing Unit: CPU
c) Standard: CPU metrics mainly refer to CPU usage and CPU utilization, including user state (user), system state (sys), wait state (wait), and idle state (idle). The CPU usage and utilization should be lower than the industry alert value range (less than or equal to 75%). CPU sys% should be less than or equal to 30%, and CPU wait% should be less than or equal to 5%. Single-core CPUs also need to meet the preceding requirements. The CPU load must be less than the number of CPU cores.
2. Memory
a) Definition and Interpretation: Memory is one of the important components in the computer and acts as a bridge between external memory and CPU. All programs in the computer run in the memory, so the performance of the memory has a great impact on the computer.
b) Abbreviation: Memory
c) Standard: In order to make the most use of memory, the modern operating system stores the cache in the memory. Therefore, 100% memory utilization does not mean there is a memory bottleneck. Whether there is a bottleneck in the system is mainly measured by SWAP (exchange with virtual memory) exchange space utilization. In general, SWAP exchange space utilization is lower than 70%, and too much exchange will cause low system performance.
3. Disk Throughput
a) Definition and Interpretation: Disk throughput is the amount of data that passes through a disk per unit of time without disk failure.
b) Abbreviation: Disk Throughput
c) Standard: Disk metrics include the number of megabytes of reads and writes per second, disk busy rate, number of disk queues, average service time, average waiting time, and space utilization. The disk busy rate is an important basis that directly reflects whether the disk has a bottleneck. In general, the disk busy rate is lower than 70%.
4. Network Throughput
a) Definition and Interpretation: Network throughput is the amount of data that passes through the network per unit of time without a network failure. Unit: Byte/s. The network throughput metric is used to measure the system's demand for network devices or link transmission capacity. When the network throughput metric is close to the maximum transmission capacity of the network device or link, you need to consider upgrading the network device.
b) Abbreviation: Network Throughput
c) Standard: The network throughput metric is used to measure how many megabytes of traffic is flowing in and out per second, which cannot exceed 70% of the maximum transmission capacity of the device or link under normal circumstances.
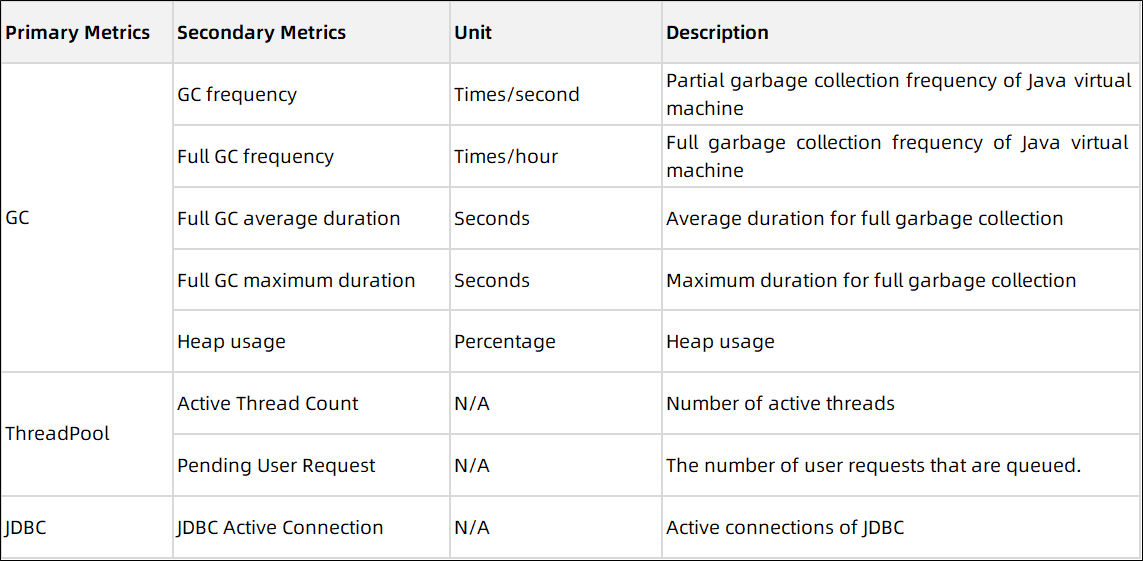
1. Definition and Interpretation: The metrics of common middleware (such as Tomcat and Weblogic) include JVM, ThreadPool, and JDBC. The details are listed below:

2. Standard
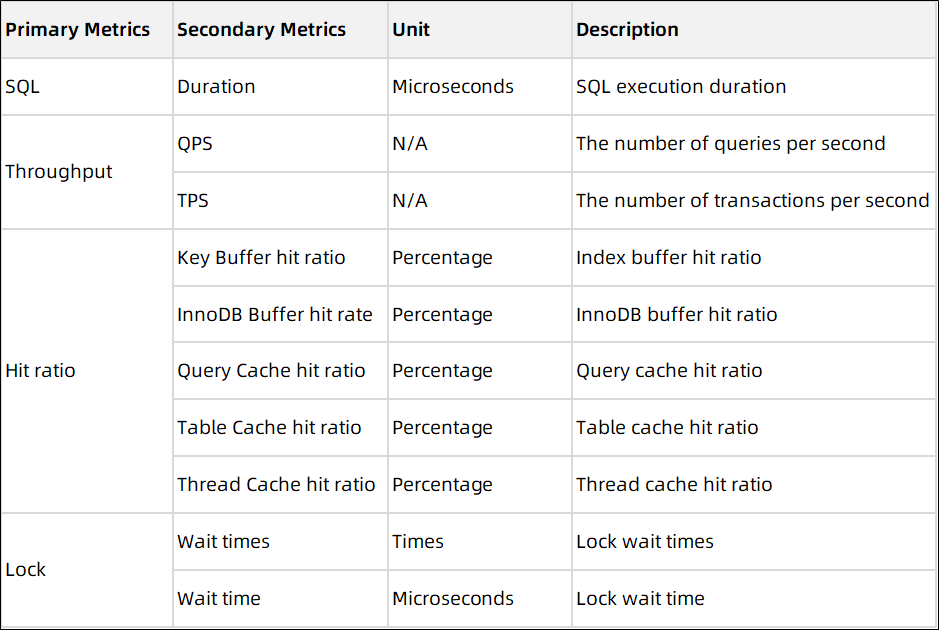
1. Definition and Interpretation: The metrics of common database MySQL include SQL, throughput, cache hit ratio, and connection number. The details are listed below:

2. Standard
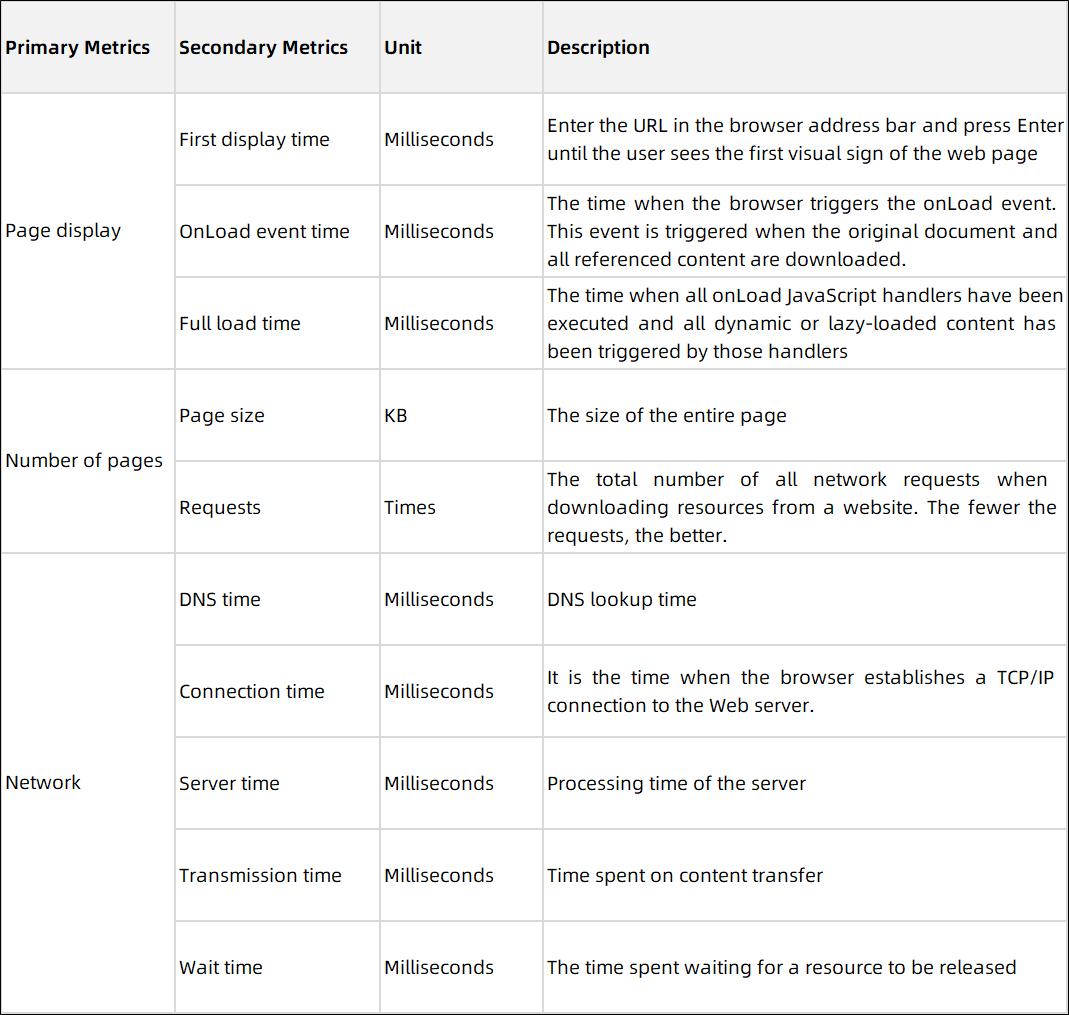
1. Definition and Interpretation: Frontend metrics include the time spent on page display and network. The details are listed below:

2. Standard
1. Definition and Interpretation: The minimum settling time: The minimum time that the system can operate stably at 80% of its maximum capacity or standard pressure (the expected daily pressure of the system). Generally speaking, for a system running on normal working days (8 hours), it should be able to ensure stable operation of the system for at least 8 hours. For a system running around the clock, it should be able to ensure stable operation of the system for at least 24 hours. If the system cannot run stably, there will be a risk of performance degradation or system crash as the business grows and the system runs for a long time after it is rolled out.
2. Standard
1. Definition and Interpretation: It refers to the amount of data processed by the batch processor in unit time. It is generally measured by the amount of data processed per second. Processing efficiency is the most important computational metric for estimating batch processing time windows. With respect to batch processing time windows, batch processing time windows of different systems can partially overlap in start and end times. In addition, within the same system, there may be multiple batch processing processes going on at the same time, with their time windows overlapping each other. Long-time batch processing will have a significant performance impact on online, real-time transactions.
2. Standard
1. Definition and Interpretation: It refers to the relationship between the increased hardware resources and the increased processing capacity when application software or operating system is deployed in cluster deploy mode. Calculation formula: (increased performance/raw performance)/(increased resource/raw resources) × 100%. Scaling capability should obtain the changing trend of scalability metrics through multiple rounds of tests. Generally, for application systems with good scaling capability, their scalability metrics should be linear or near-linear. Nowadays, many large-scale distributed systems have good scaling capability.
2. Standard
1. Dual-Machine Hot Standby: The measurement metrics for systems that use dual-machine hot standby as a means of reliability assurance are listed below:
2. Cluster: The cluster reliability for systems that use the cluster mode is mainly measured in the following ways:
3. Backup and Recovery: This metric is used to verify whether the backup and recovery mechanism of the system is effective and reliable. There are system backup and recovery, database backup and recovery, and application backup and recovery. The following contents need to be tested:
It is easy to ignore the performance of the pressure machine in the stress testing process. You need to pay attention to the following performance metrics of the pressure machine to ensure the pressure machine is not the performance bottleneck of the entire stress testing process:
Open-source stress testing tools (such as JMeter) support simple system performance monitoring metrics (such as request success rate, system throughput, and response time). However, for large-scale distributed stress testing, the native monitoring of open-source stress testing tools has the following disadvantages:
In summary, in large-scale distributed stress testing, it is not recommended to use the native monitoring of open-source stress testing tools.
The following is the comparison of two open-source monitoring solutions:
Zabbix is an early open-source distributed monitoring system that supports relational databases (such as MySQL or PostgreSQL as data sources).
The pressure machine needs to provide second-level monitoring metrics for system performance monitoring. Highly concurrent monitoring metrics are written per second, making relational databases a monitoring system bottleneck.
Zabbix has comprehensive metrics for physical machines and virtual machines for resource performance monitoring, but it does not provide enough support to monitor containers and elastic computing.
Prometheus uses time series databases as data sources. Compared with traditional relational databases, Prometheus significantly improves the read and write performance. Prometheus performs well in scenarios where a large amount of second-level monitoring data is reported by the pressure machine.
For resource performance monitoring, Prometheus is more suitable for monitoring cloud resources, especially for Kubernetes and containers. It is easier for users who use cloud-native technologies to get started.
In summary, Prometheus is more suitable for collecting and aggregating high-concurrency monitoring metrics in stress testing than Zabbix. In addition, it is more suitable for monitoring cloud resources and is easier to extend.
Prometheus is a data-pull model. Therefore, the stress testing engine must expose the HTTP service so Prometheus can obtain various stress testing metrics.
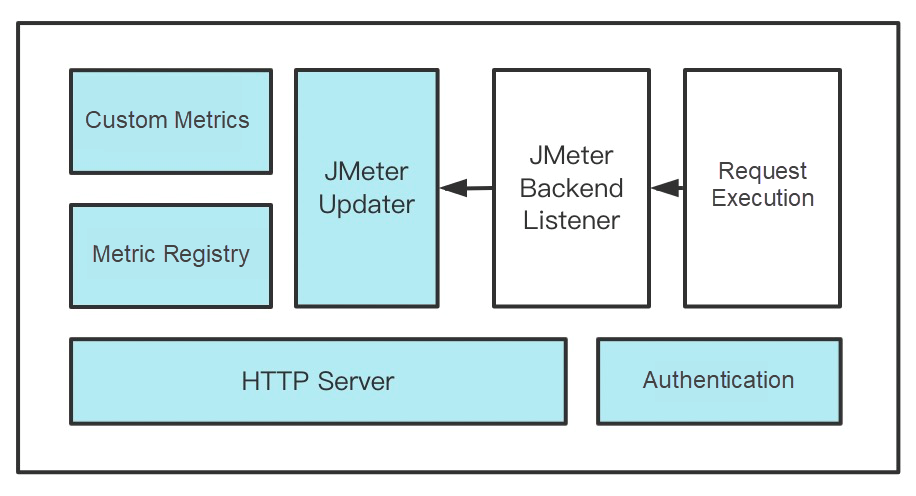
JMeter provides a plug-in mechanism. You can customize a plug-in to extend the monitoring capability of Prometheus. In the custom plug-in, it is necessary to extend the BackendListener of JMeter to update each stress test metric when the sampler is executed. These metrics include the number of successful requests, the number of failed requests, and the request response time. In addition, the plug-in needs to store the stress test metrics in the memory and expose them through HTTP when Prometheus pulls data. The overall structure is listed below:

The JMeter custom plug-in needs to be modified from the following aspects:
This article expounds:
How to Quickly Deploy AI Inference Services Based on ACK Serverless

212 posts | 13 followers
FollowAlibaba Cloud Community - October 9, 2022
Alibaba Container Service - May 14, 2025
DavidZhang - January 15, 2021
Alibaba Cloud Native Community - July 26, 2022
Alibaba Cloud Native Community - May 23, 2023
Alibaba Cloud Native - September 8, 2023

212 posts | 13 followers
Follow Best Practices
Follow our step-by-step best practices guides to build your own business case.
Learn More Cloud-Native Applications Management Solution
Accelerate and secure the development, deployment, and management of containerized applications cost-effectively.
Learn More Lindorm
Lindorm is an elastic cloud-native database service that supports multiple data models. It is capable of processing various types of data and is compatible with multiple database engine, such as Apache HBase®, Apache Cassandra®, and OpenTSDB.
Learn More Function Compute
Alibaba Cloud Function Compute is a fully-managed event-driven compute service. It allows you to focus on writing and uploading code without the need to manage infrastructure such as servers.
Learn MoreMore Posts by Alibaba Cloud Native