By Guo Yujie, Alibaba Cloud Intelligence Technical Expert
Among more than 50 cloud products integrated with Prometheus, RocketMQ is a representative cloud product with excellent observability.

RocketMQ was created in Alibaba's core e-commerce system and is the preferred MQ platform for business messages. The preceding figure shows a complete picture of the RocketMQ 5.0 system. The access layer, core components, and underlying O&M have been improved. The system has many advantages (such as multiple functions, high performance, high reliability, observability, and easy O&M).
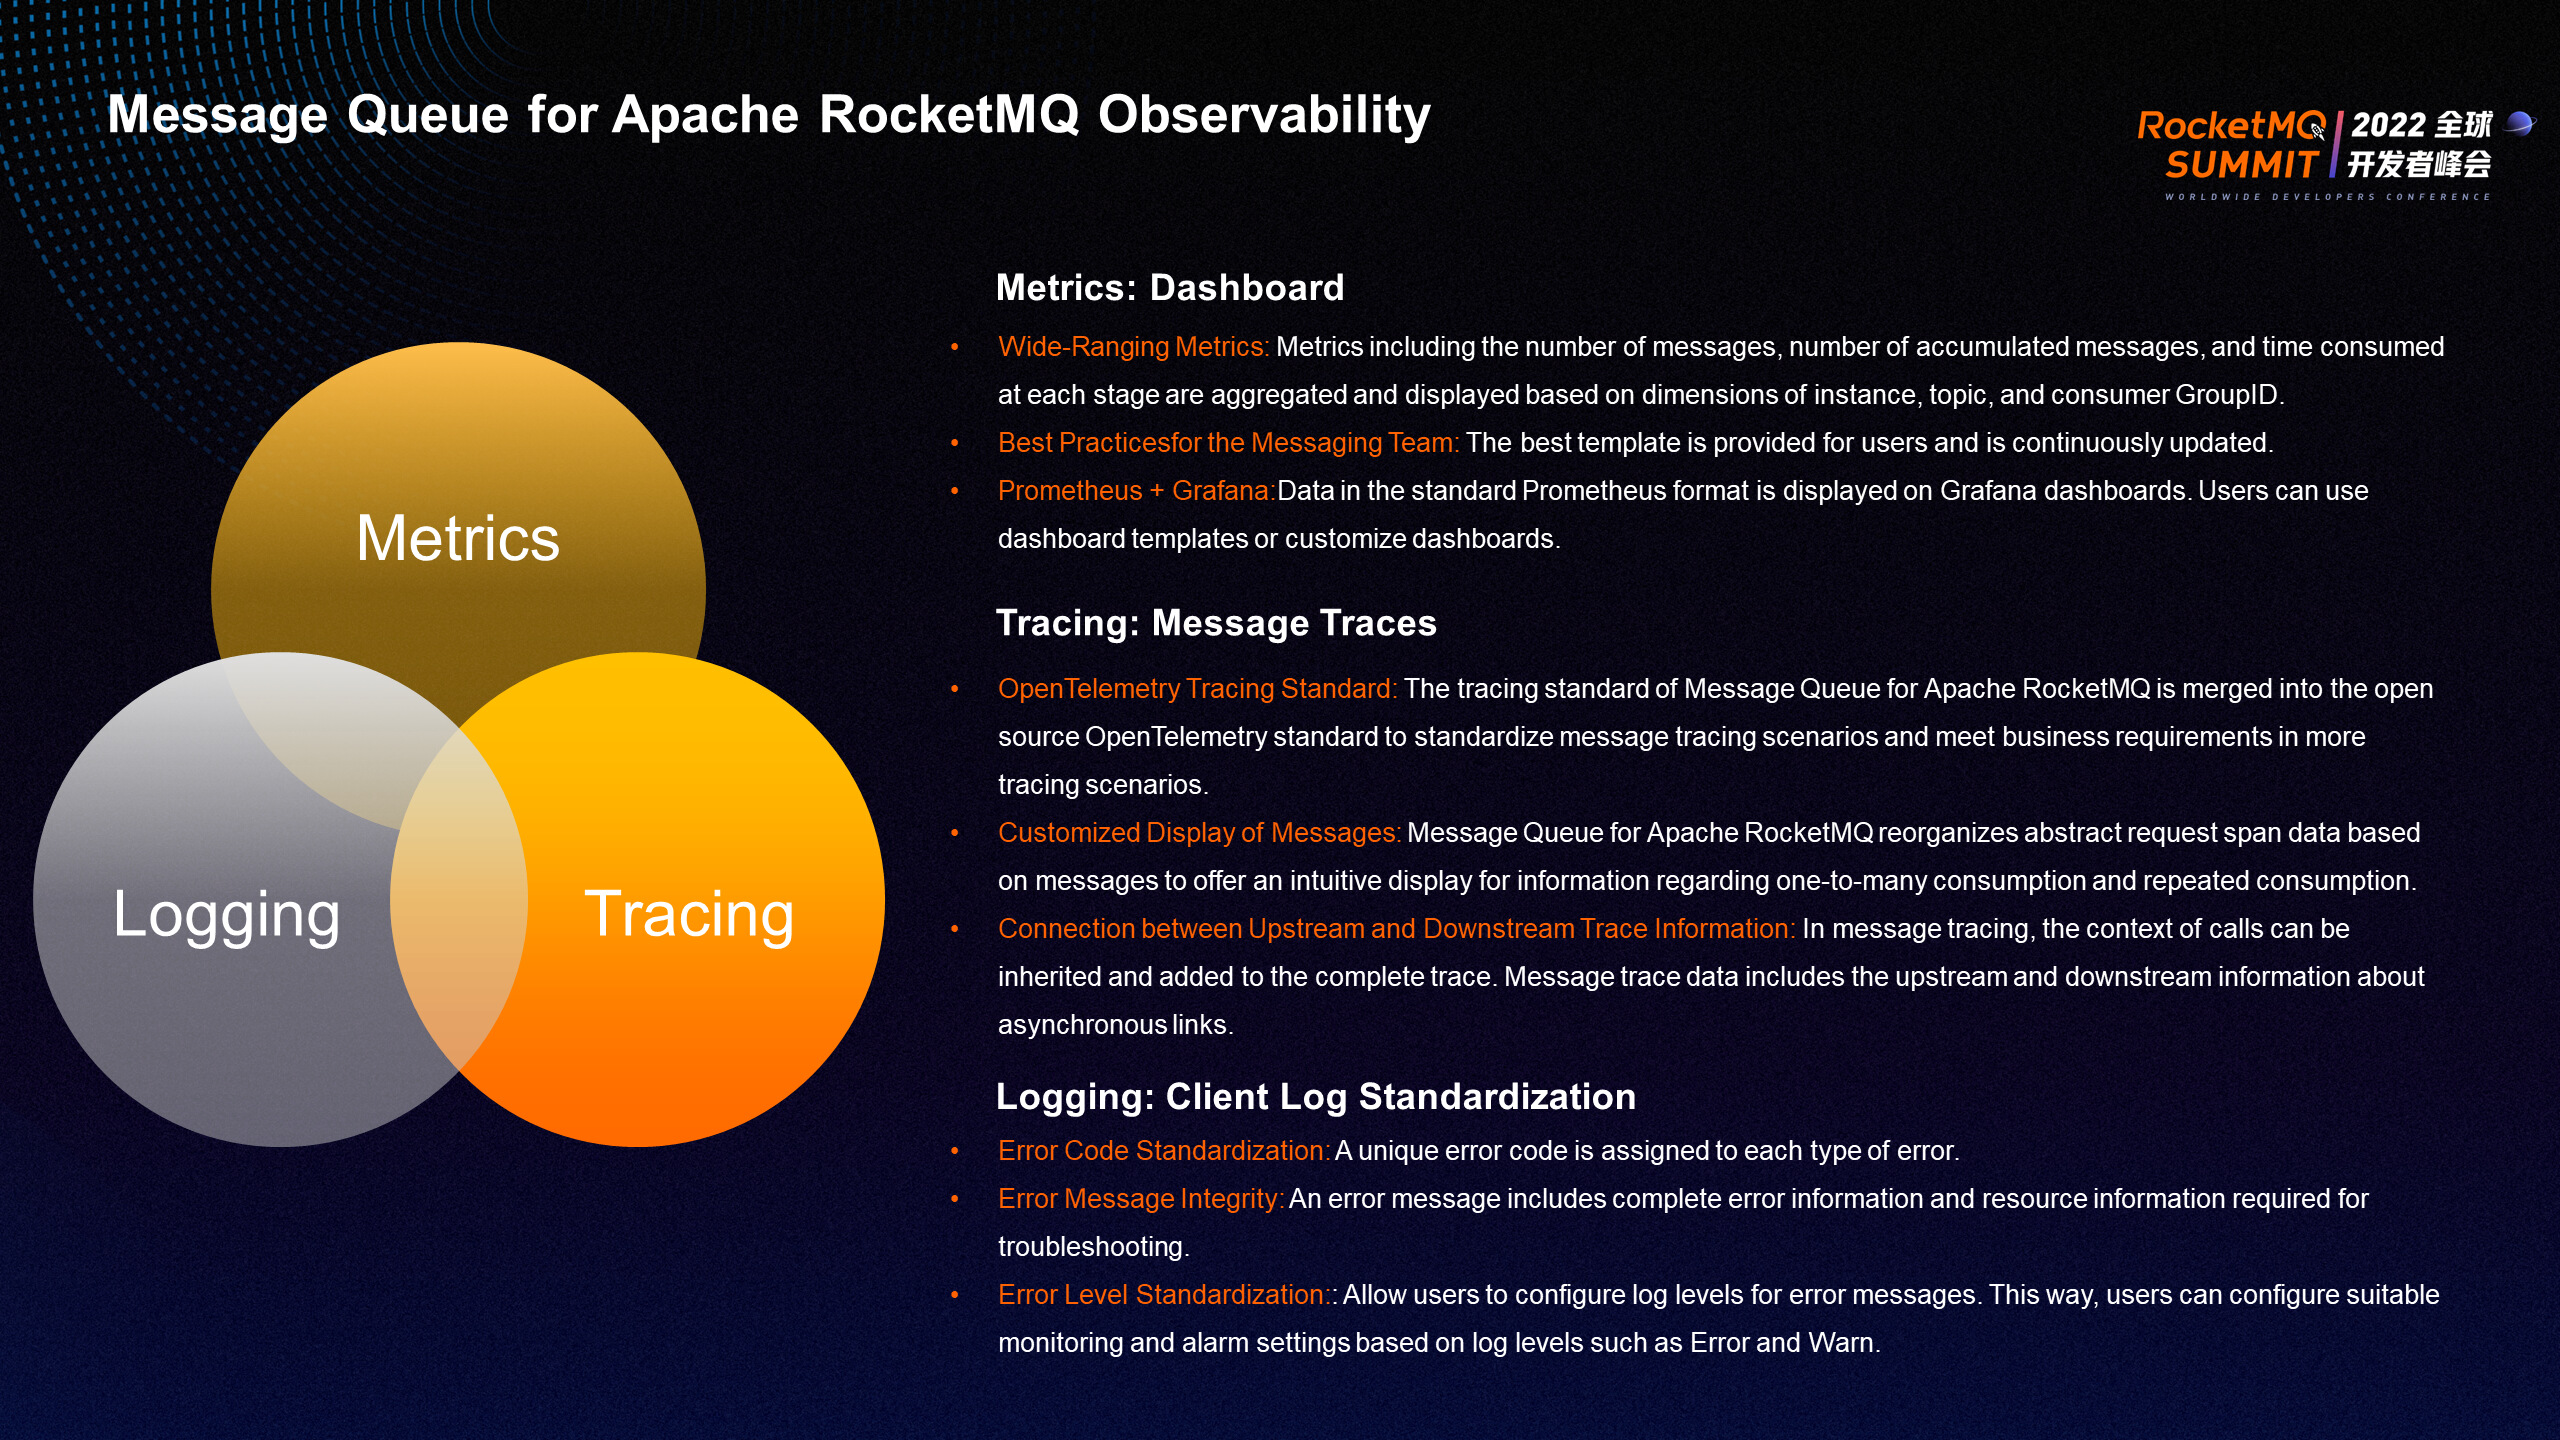
Metrics, tracing, and logging are three pillars of observability.
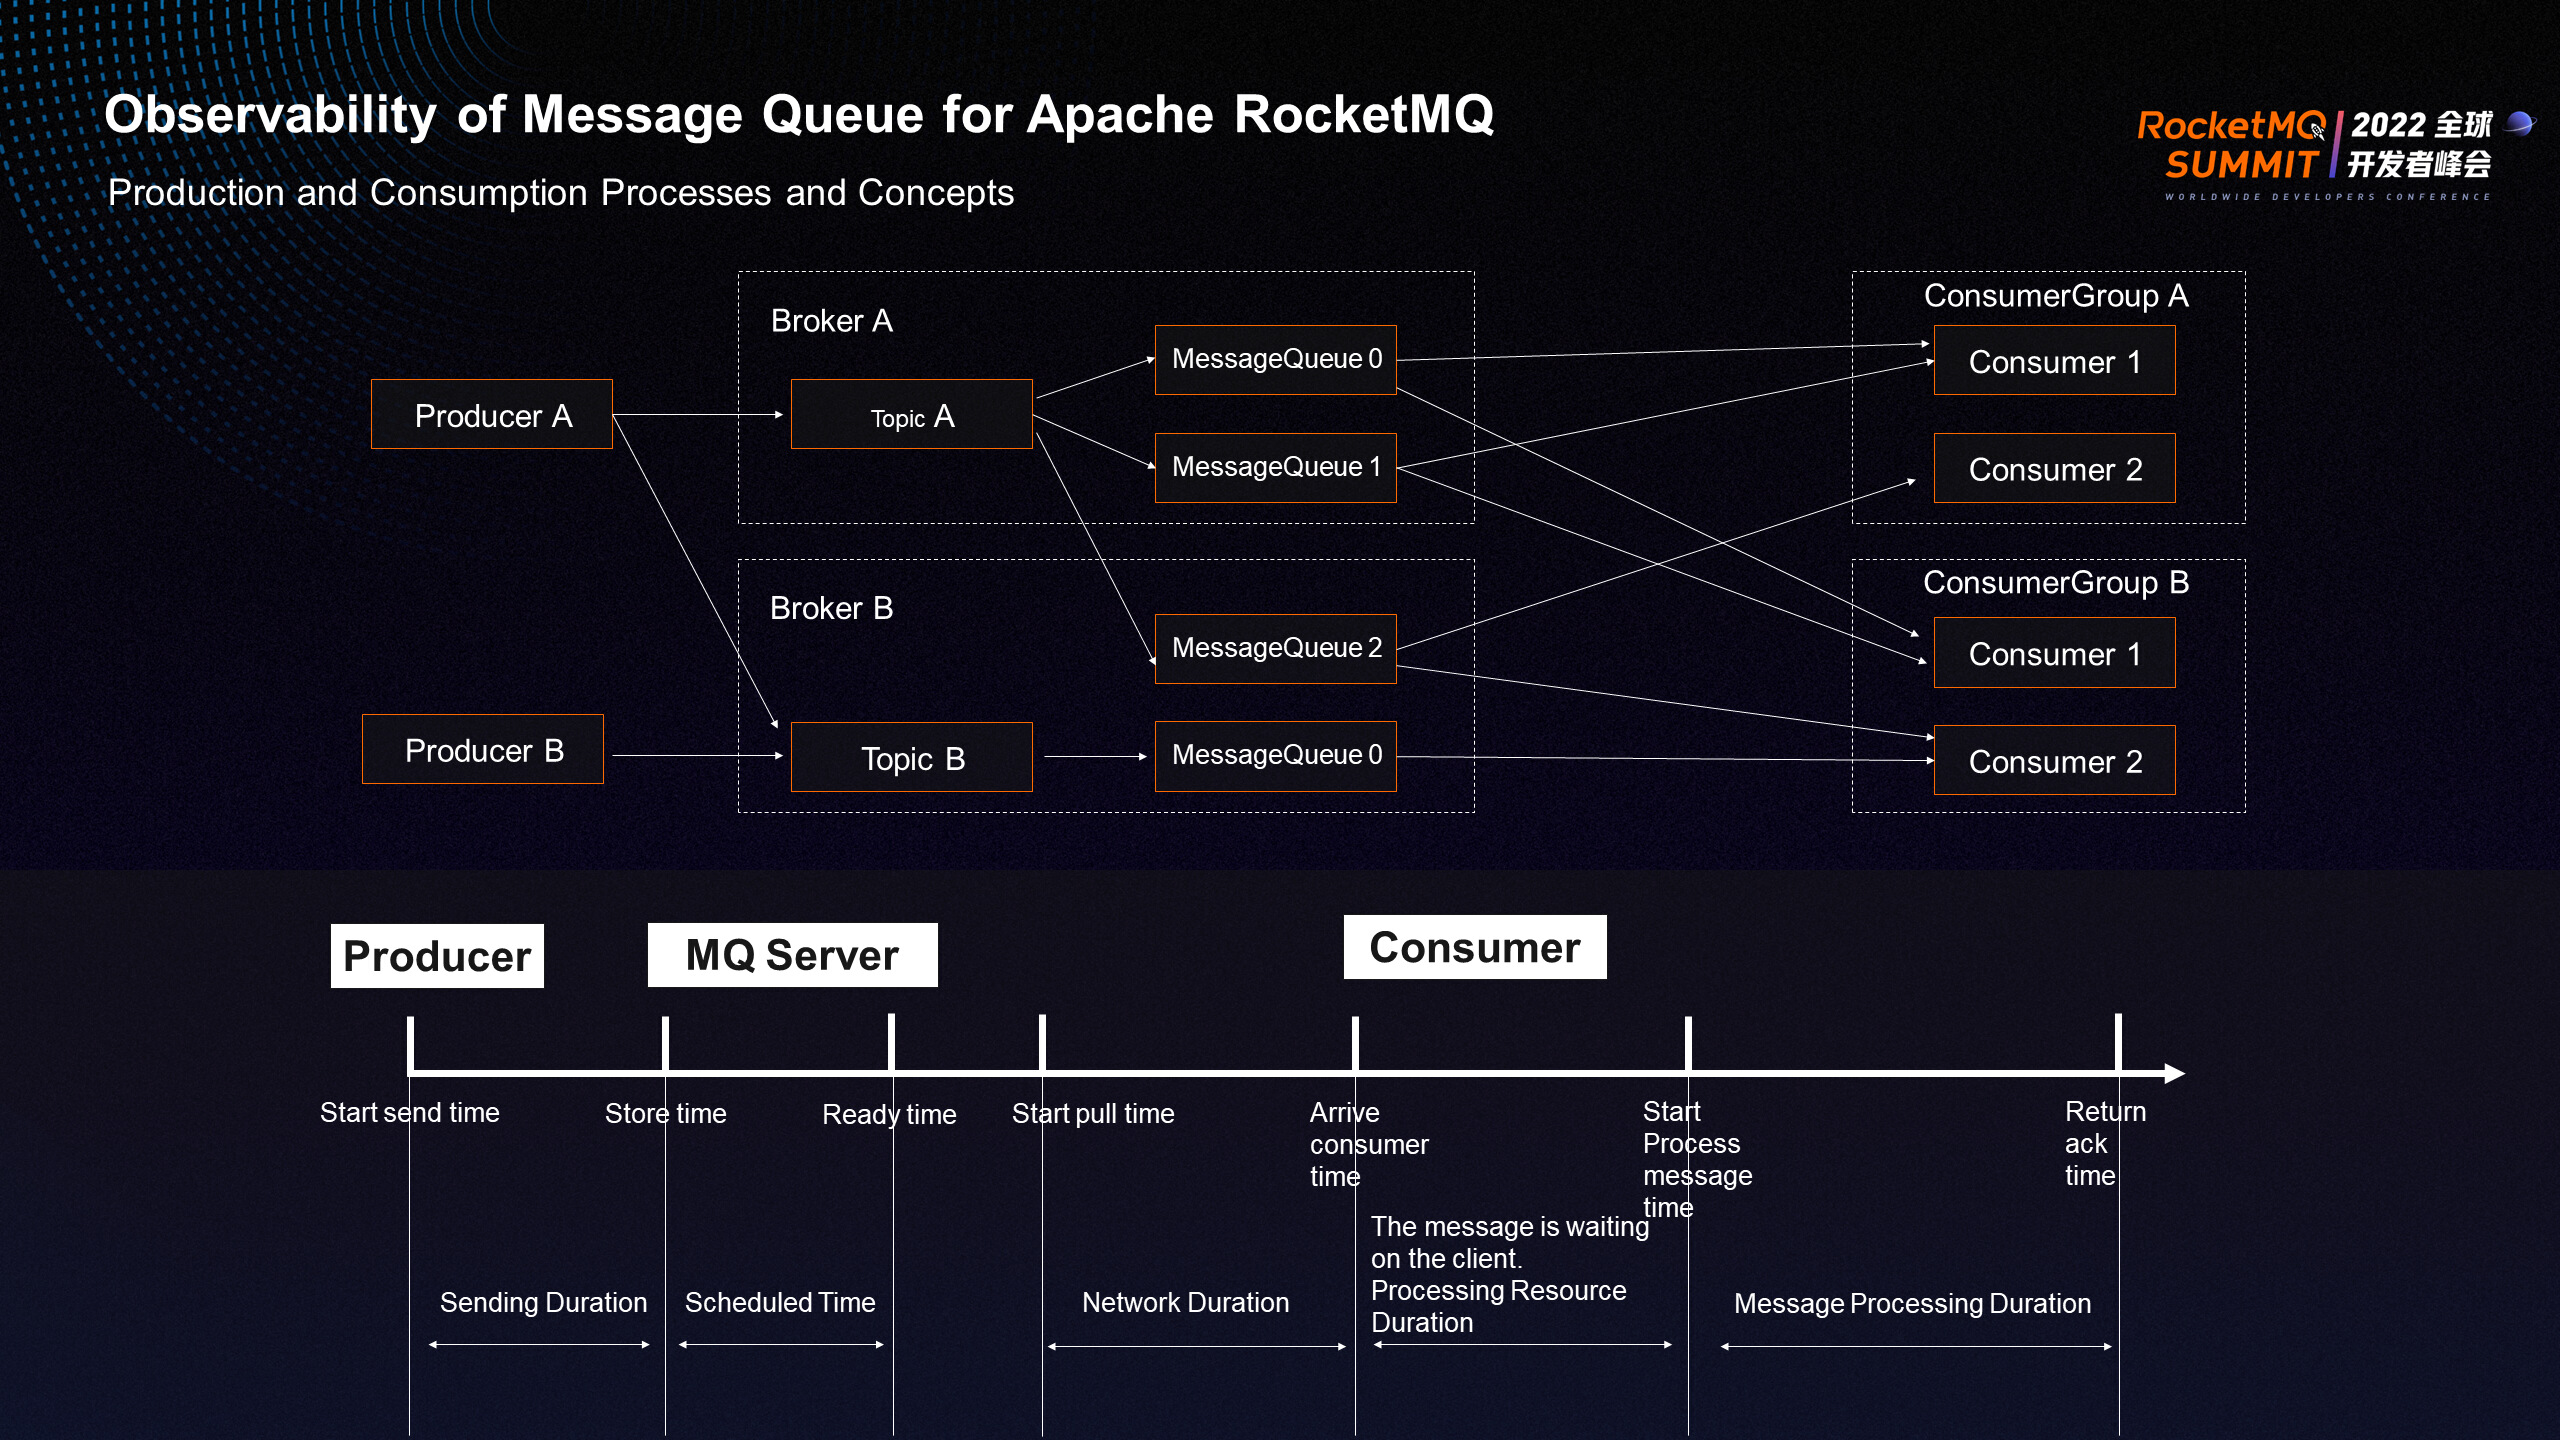
All observability data of RocketMQ is developed at the production, server, and consumption stages of a message. From the message lifecycle graph, we can see the time taken for a message to be sent from the Producer and received by the MQ server. For scheduled messages, we can determine the scheduled time based on the Ready time. From the Consumer's perspective, we can know the network time from the start of message pulling to the arrival at the client, the wait time for processing resources from the time of arrival at the client until the start of message processing, and the processing time from the start of message processing to the final return of the ACK. At any stage of the message's lifecycle, it can be clearly defined and observed, which is the core concept of observability in RocketMQ.
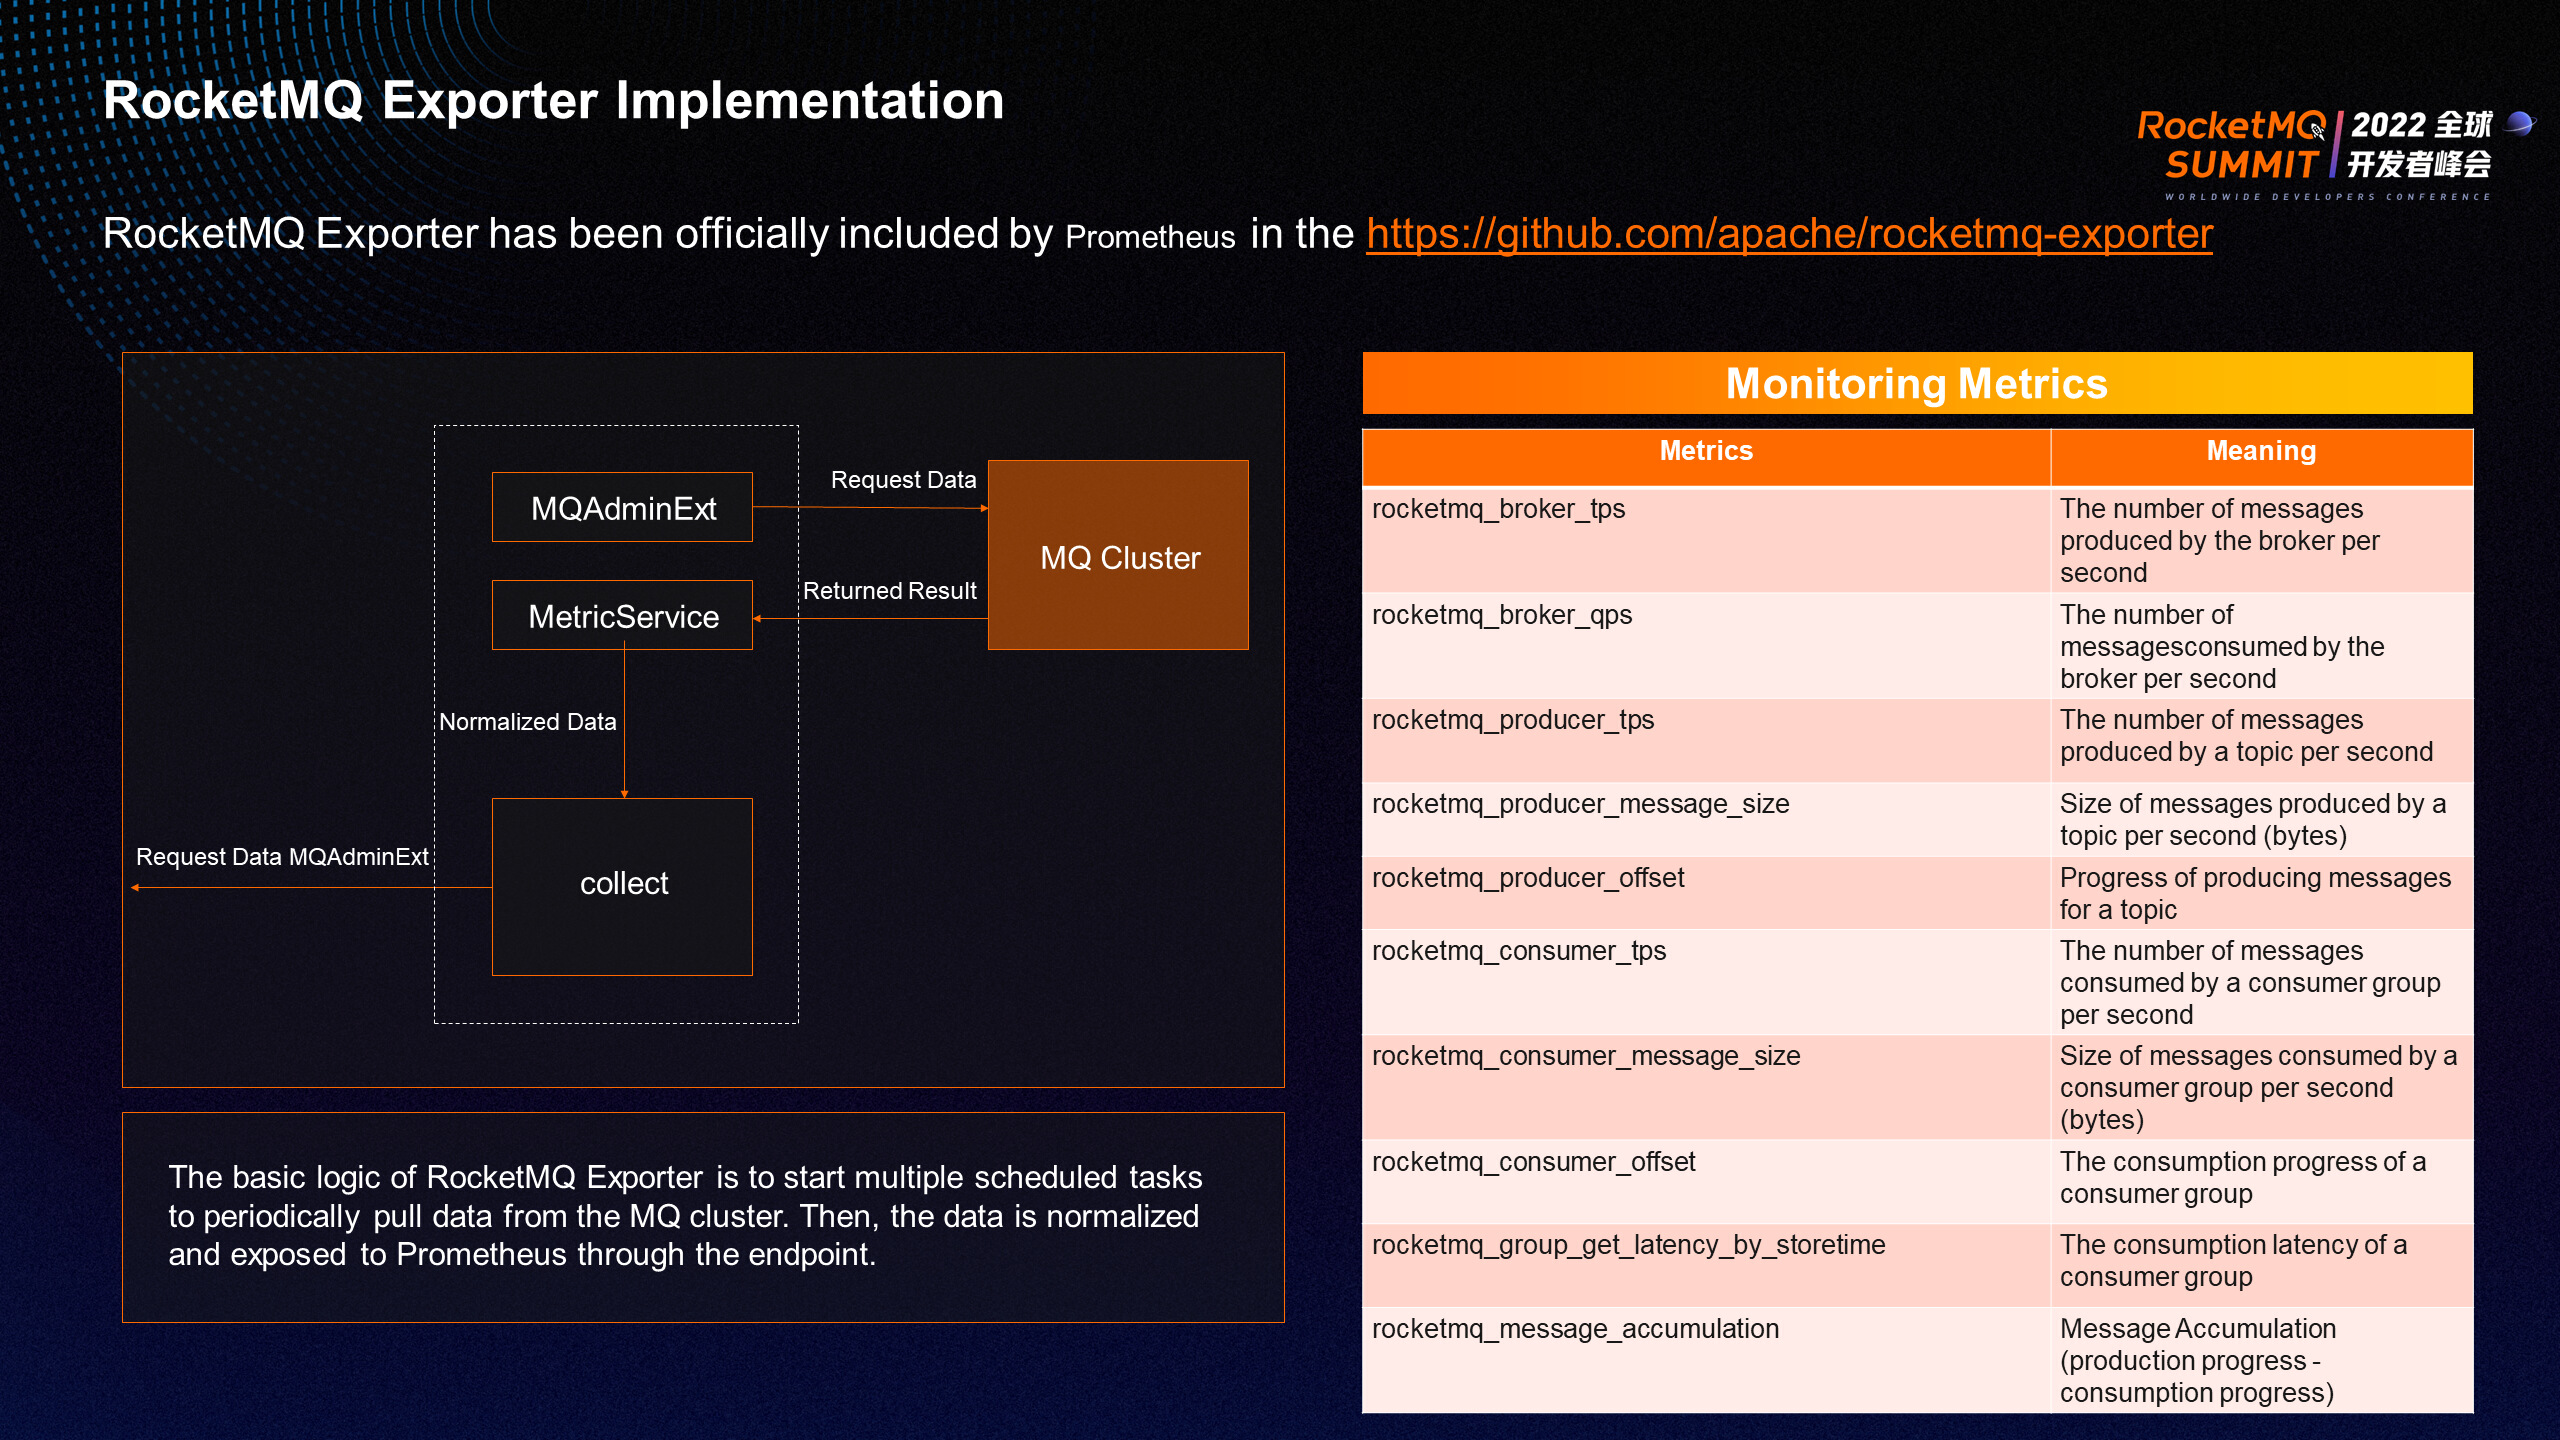
The RocketMQ exporter contributed by the RocketMQ Team has been included in the official open-source exporter ecosystem of Prometheus. It provides a wide range of monitoring metrics for various stages of brokers, producers, and consumers. The basic logic of Exporter is to start multiple scheduled tasks to periodically pull data from the MQ cluster, standardize the data, and expose it to Prometheus through the endpoint. The MQAdminExt class encapsulates the various interface logic exposed by MQAdmin. In terms of structure, the exporter of RocketMQ is an observer from the perspective of a third party, and all metrics are within the MQ cluster.
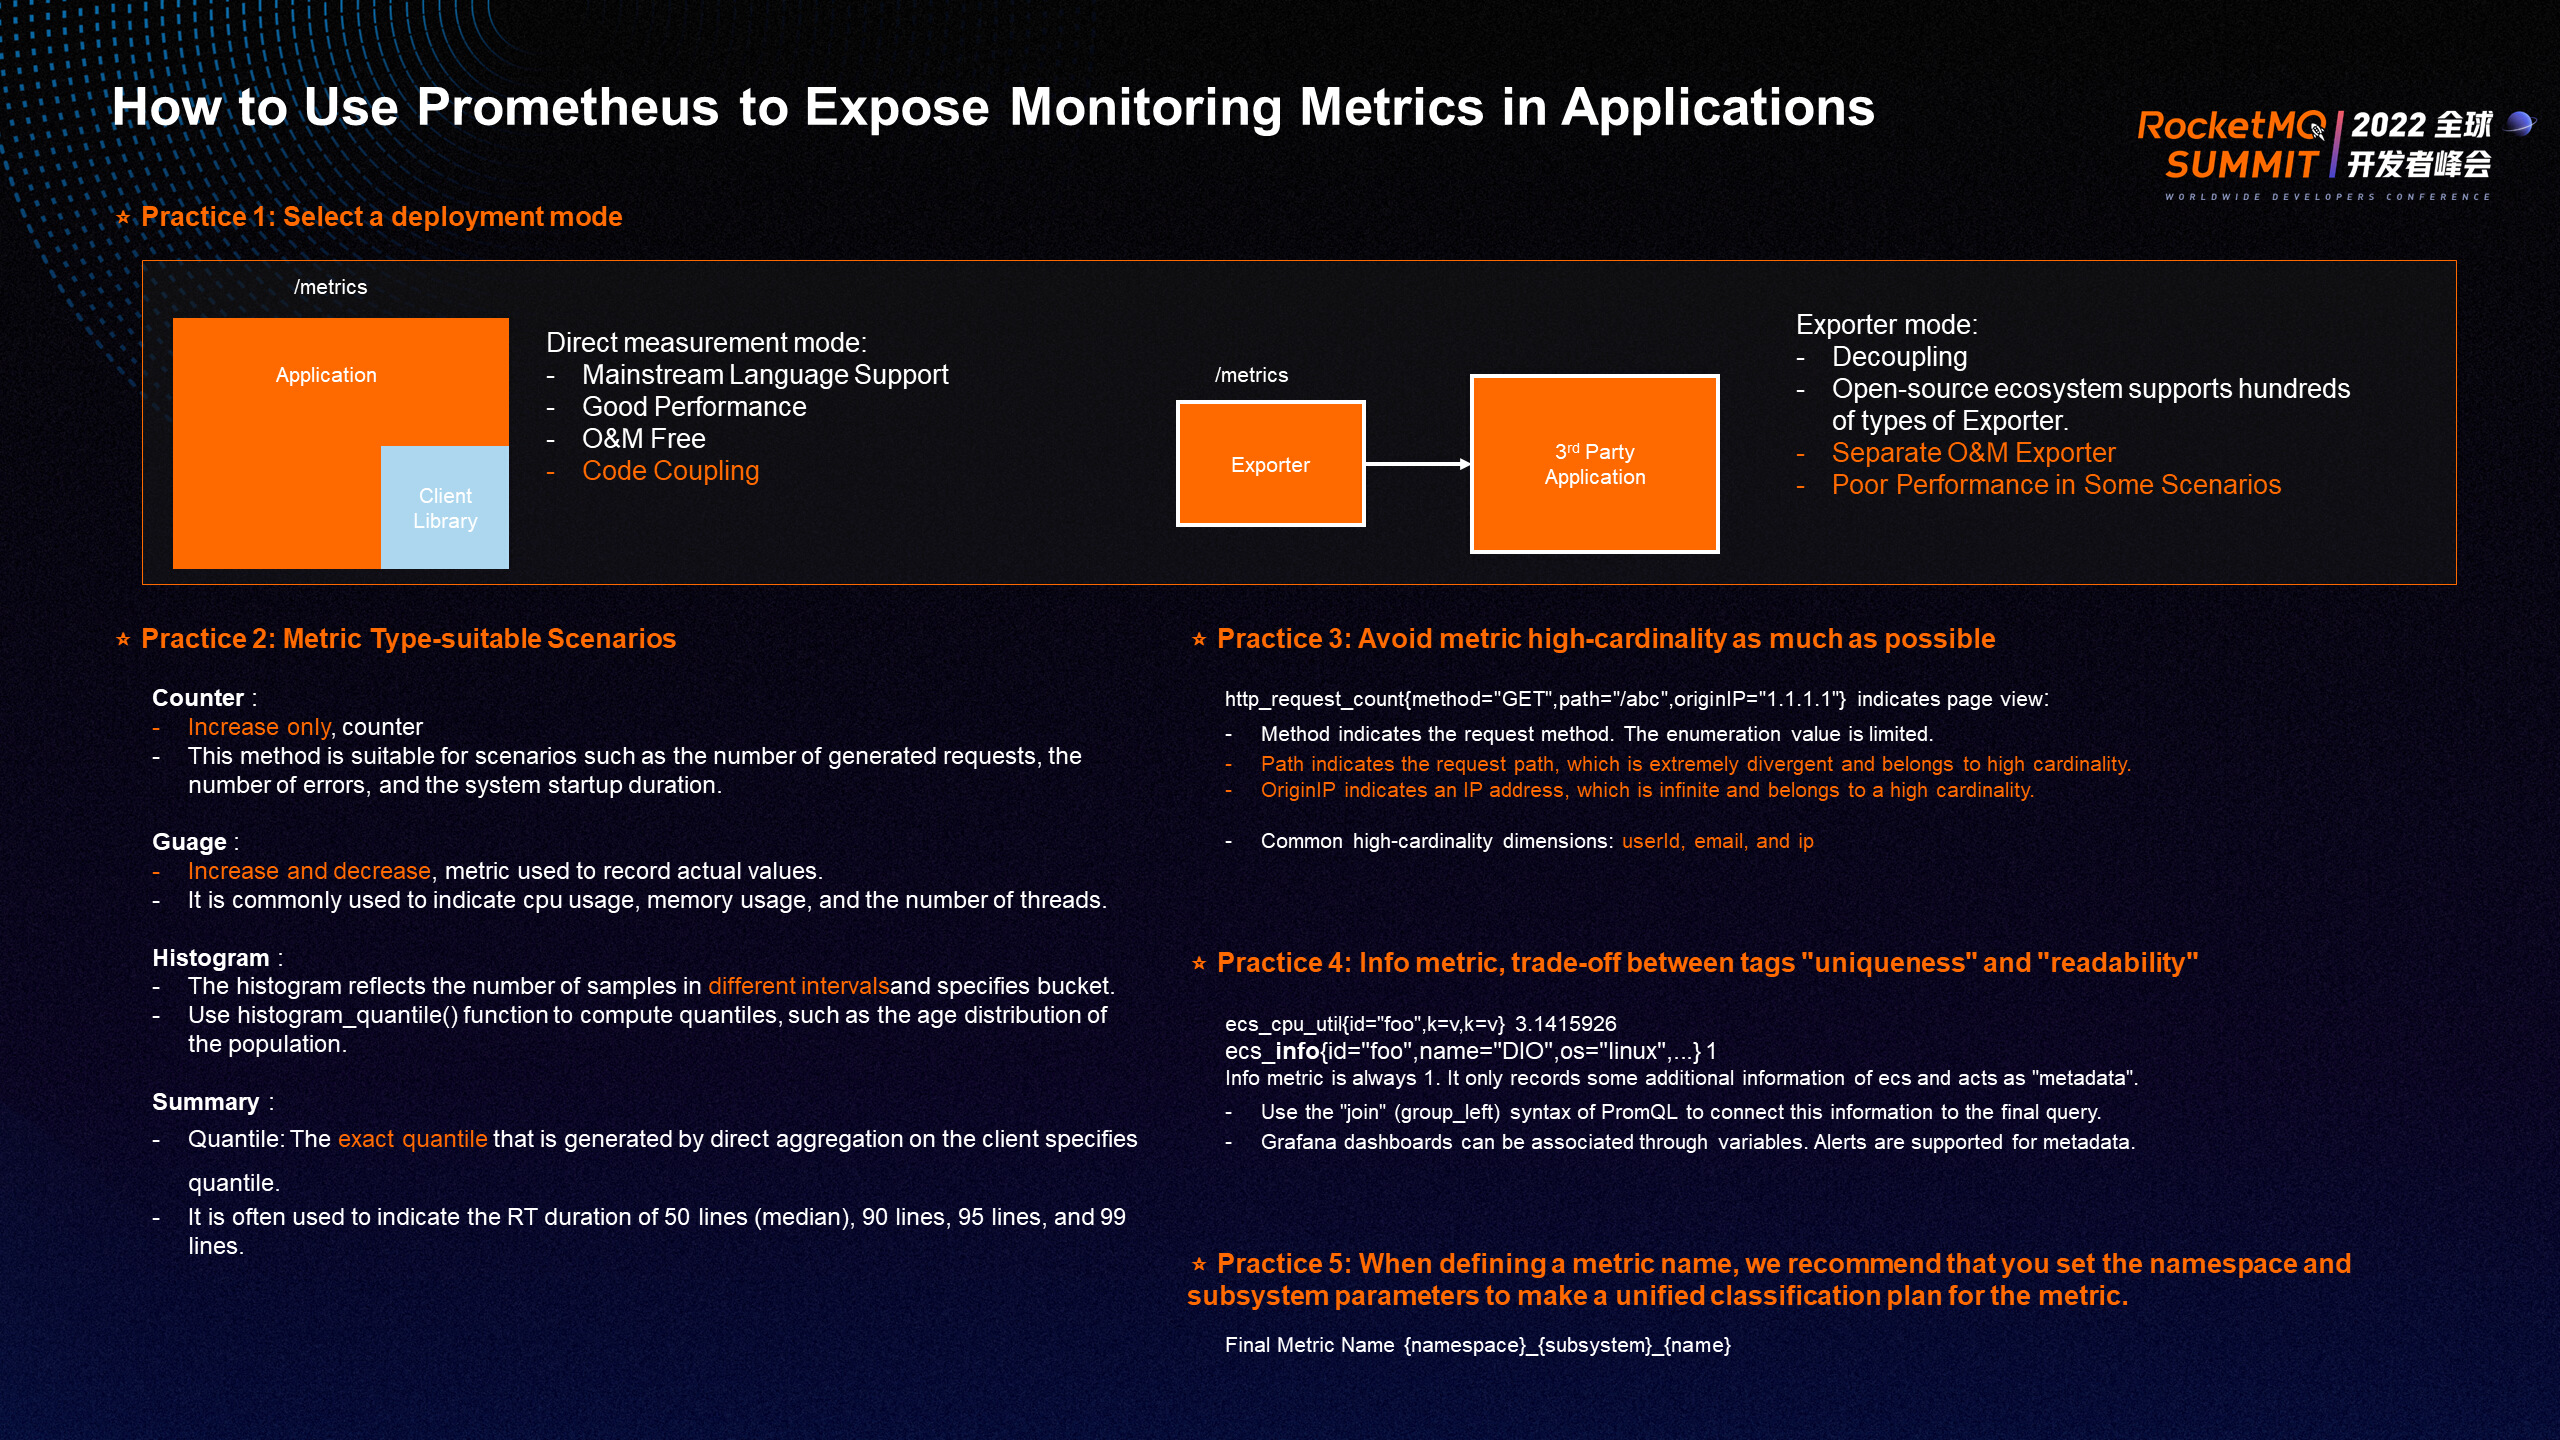
When Prometheus exposes monitoring metrics in applications, take note of the following points:
① The choice of exporter deployment mode is divided into the direct observation mode of embedding the Prometheus client into the application and the independent exporter mode outside the application. The direct observation mode has the advantages of mainstream language support, better performance, and is O&M-free. The disadvantage is code coupling. The exporter mode has the advantages of decoupling and rich open-source ecosystems. The biggest disadvantage is that it requires separate Exporter components for O&M. You need to deploy multiple Exporter components in the application architecture mode of cloud-native microservices, which brings a lot of burden on O&M. The deployment mode has no advantages or disadvantages. We recommend selecting the direct observation mode if you have control over the application code and selecting the exporter mode if you do not have control over the application code.
② Try to avoid the problem of high cardinality caused by the divergence of metric dimensions. It is convenient to add only one label to the extended dimension of the Prometheus metric model. Many users add as many dimensions as needed to the metric, which inevitably introduces some non-enumerable dimensions (such as common userid, url, email, and ip). The total number of timelines in Prometheus is calculated based on the product relationship between metrics and dimensions. Therefore, the high cardinality problem causes huge storage costs and significant performance challenges to the query side due to the excessive amount of data returned instantaneously. In addition, serious dimension divergence makes the metrics lose their statistical significance. Therefore, we should try to avoid the divergence of metric dimensions during usage.
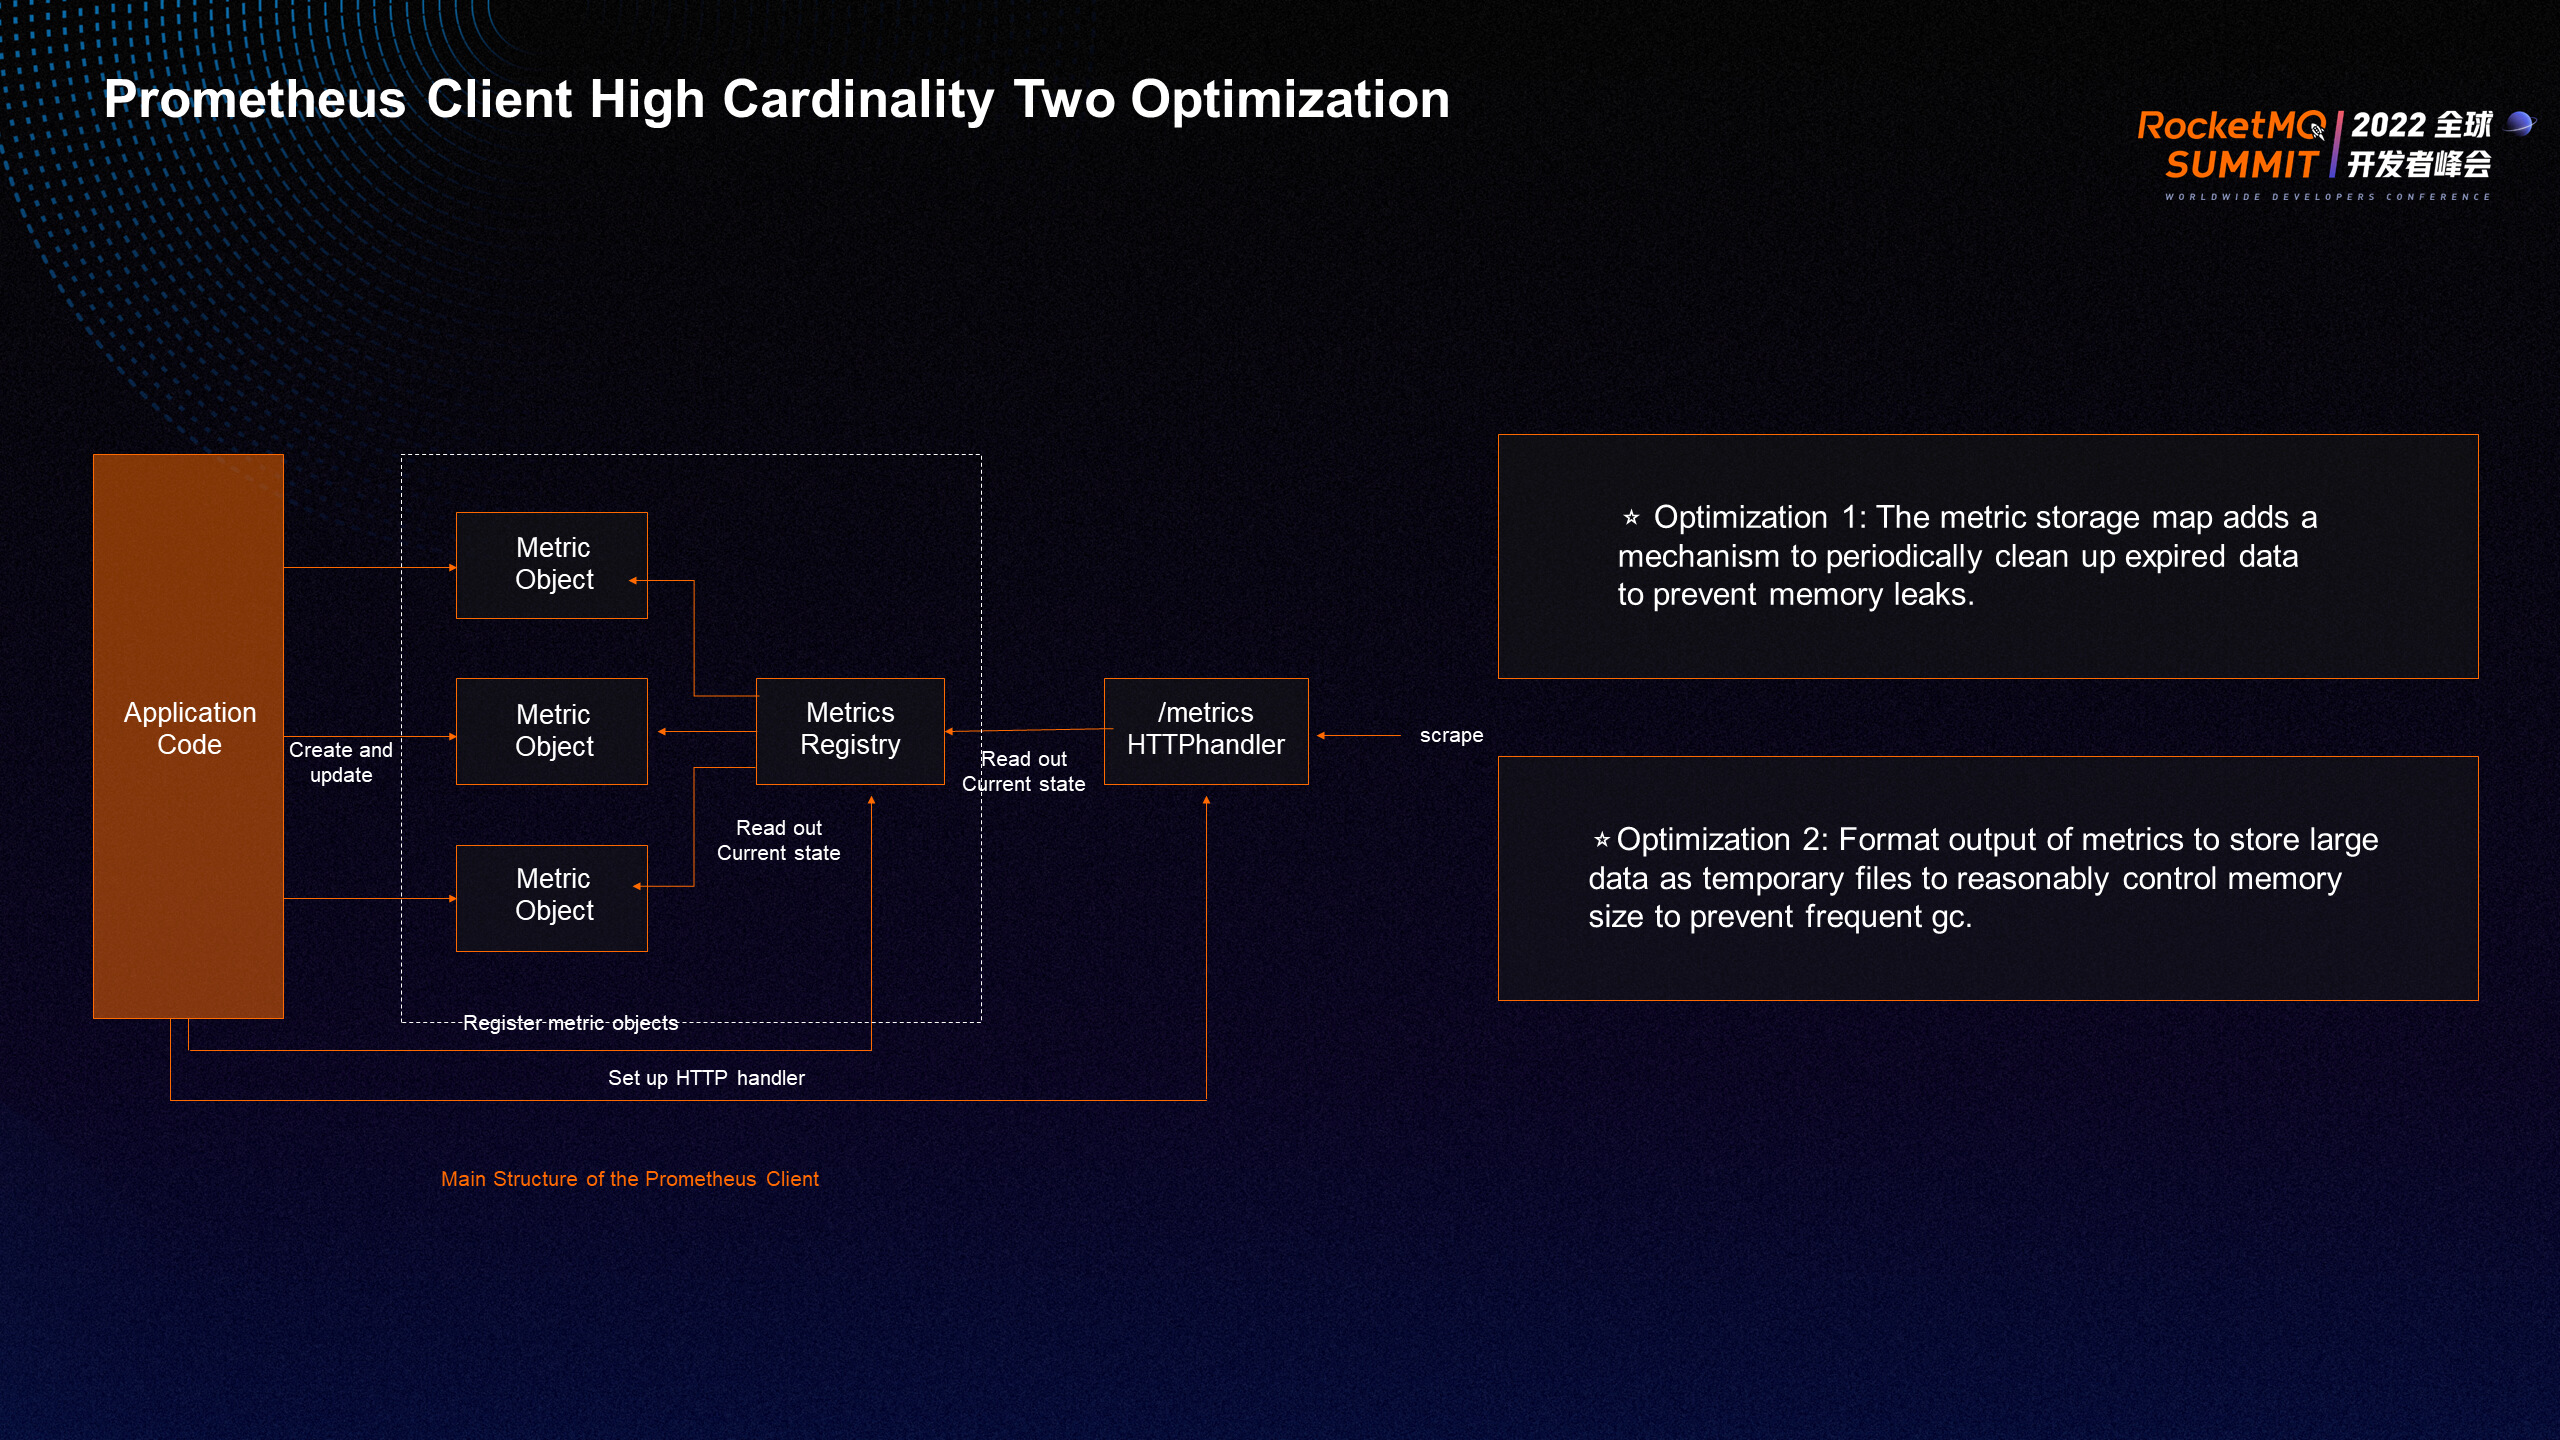
We encounter high cardinality issues when using Prometheus Client, especially the metrics of RocketMQ, which provide a combination of multiple dimensions (such as account, instance, topic, and consumer group ID), making the overall number of timelines at a high level. In practice, we have optimized two of Prometheus' native clients to effectively control the memory risks caused by the high cardinality of Exporter.
Customer-level monitoring of the sales tenant is required in the production environment of RocketMQ. RocketMQ resources of each customer are strictly isolated by the tenant. If you deploy a set of Exporter for each tenant, the architecture, O&M, and other aspects of the product are challenging. Therefore, RocketMQ chooses another way to connect to Prometheus in the production environment.
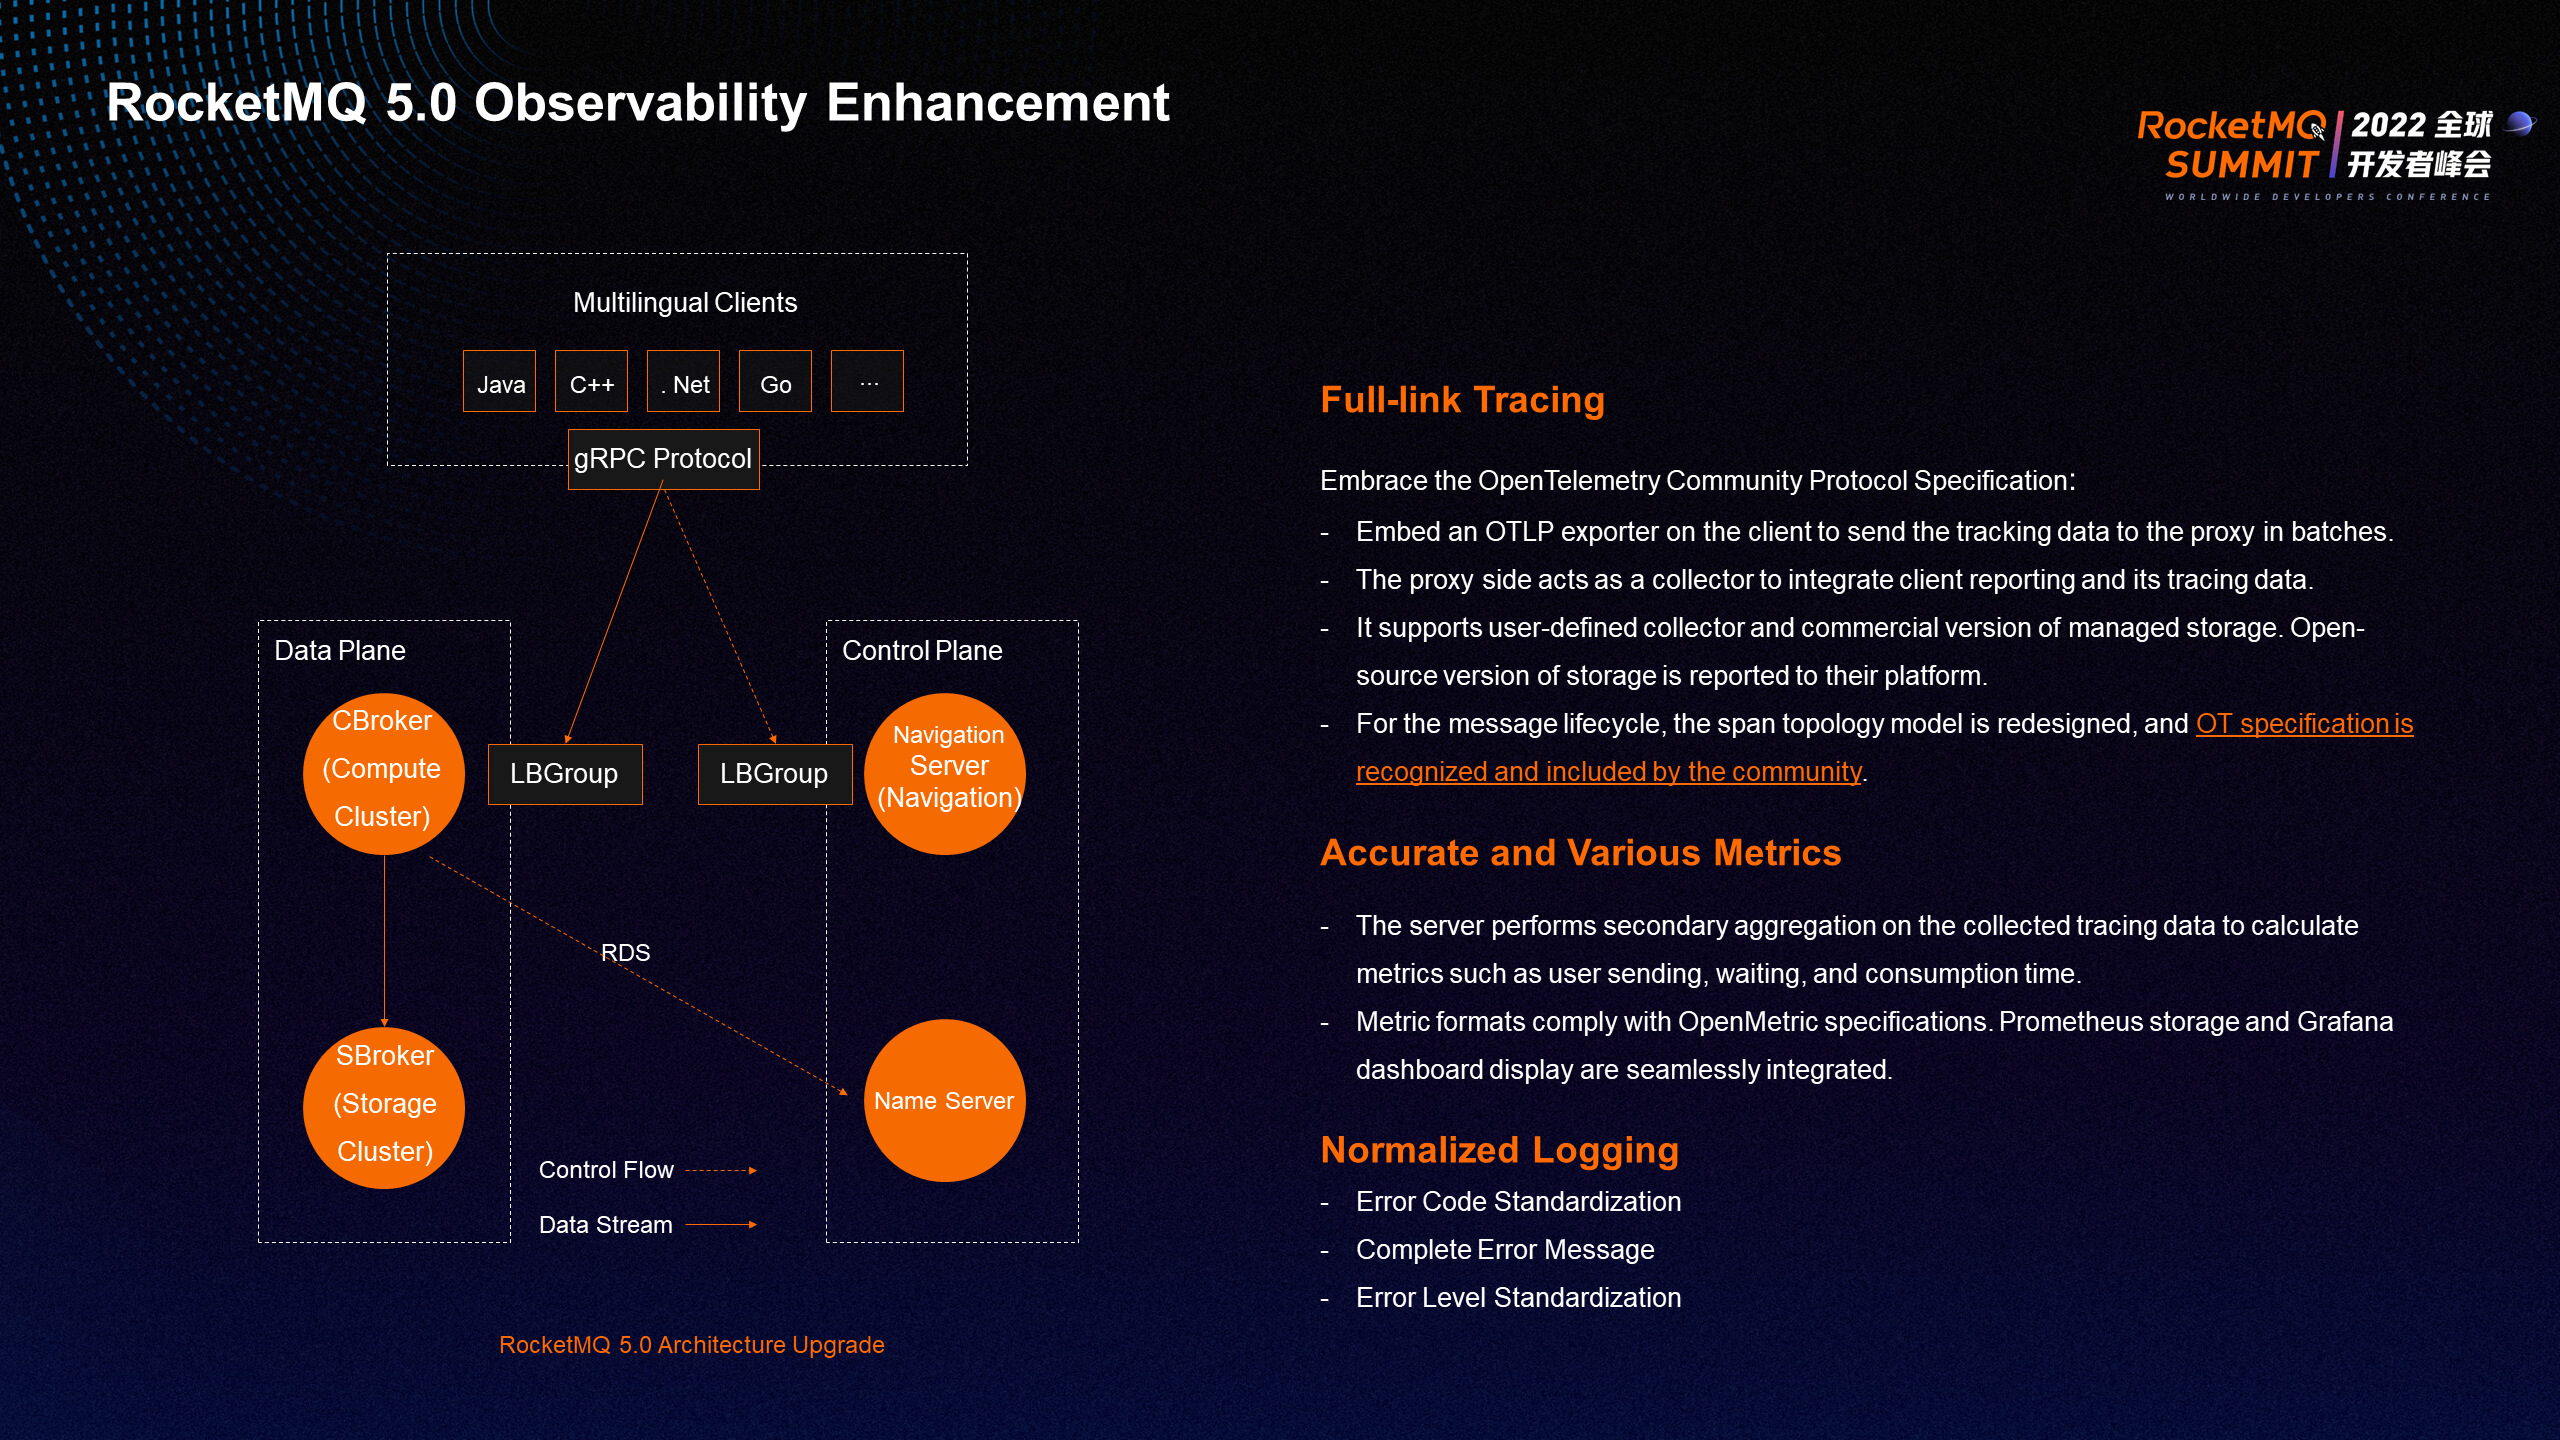
The architecture of RocketMQ 5.0 has been improved. The underlying layer of the multi-language thin client uses the gRPC protocol to send data to the server, and the MQ server is split into two roles: CBroker (proxy) and SBroker. At the same time as the architecture changes, RocketMQ 5.0 introduced the OpenTelemetry tracking standard for the client and the server.
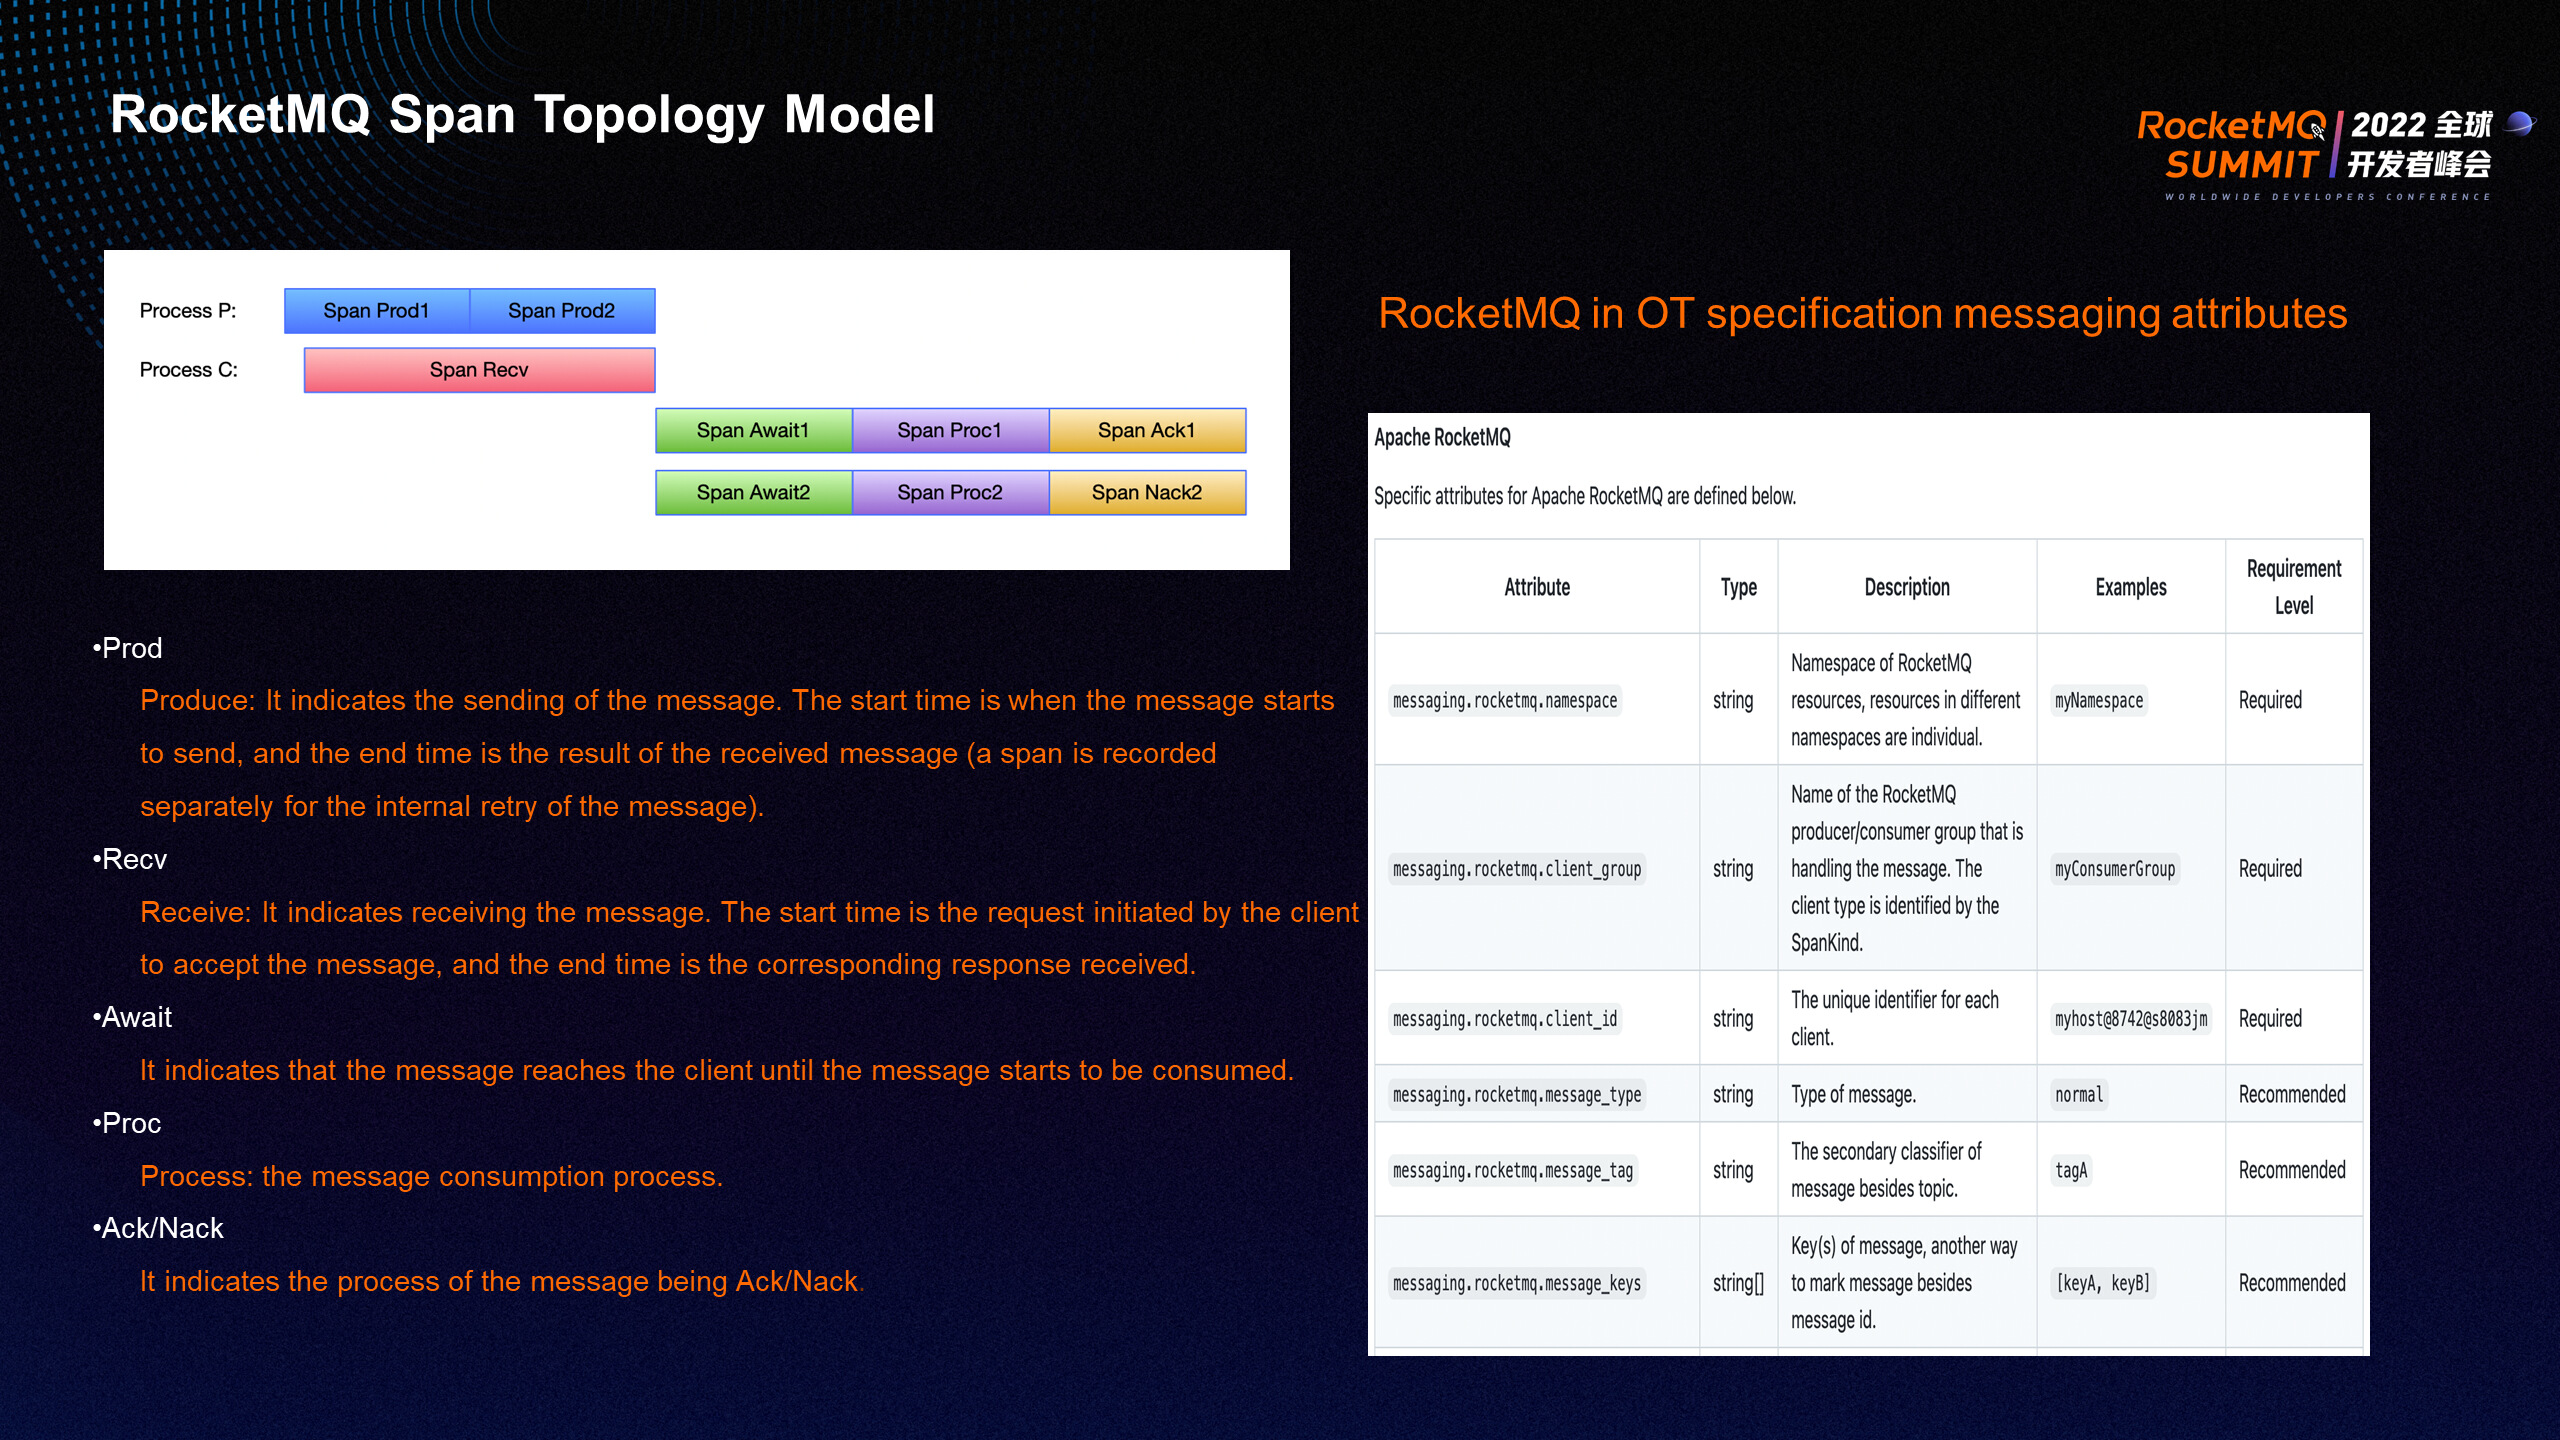
RocketMQ Span Topology Model
This topology model renormalizes the tracking points of the Prod, Recv, Await, Proc, and ACK/Nack phases. It also submits the attribute specifications of the OpenTelemetry tracking model to the OpenTelemetry Specification standard organization and is included.

The preceding improvements significantly enhance the message tracing function, which can query the relevant traces according to the basic information of the message and understand the various stages of the message lifecycle. Click the trace ID to see the detailed trace information, producers, consumers, and related resources (such as the display of machine information).
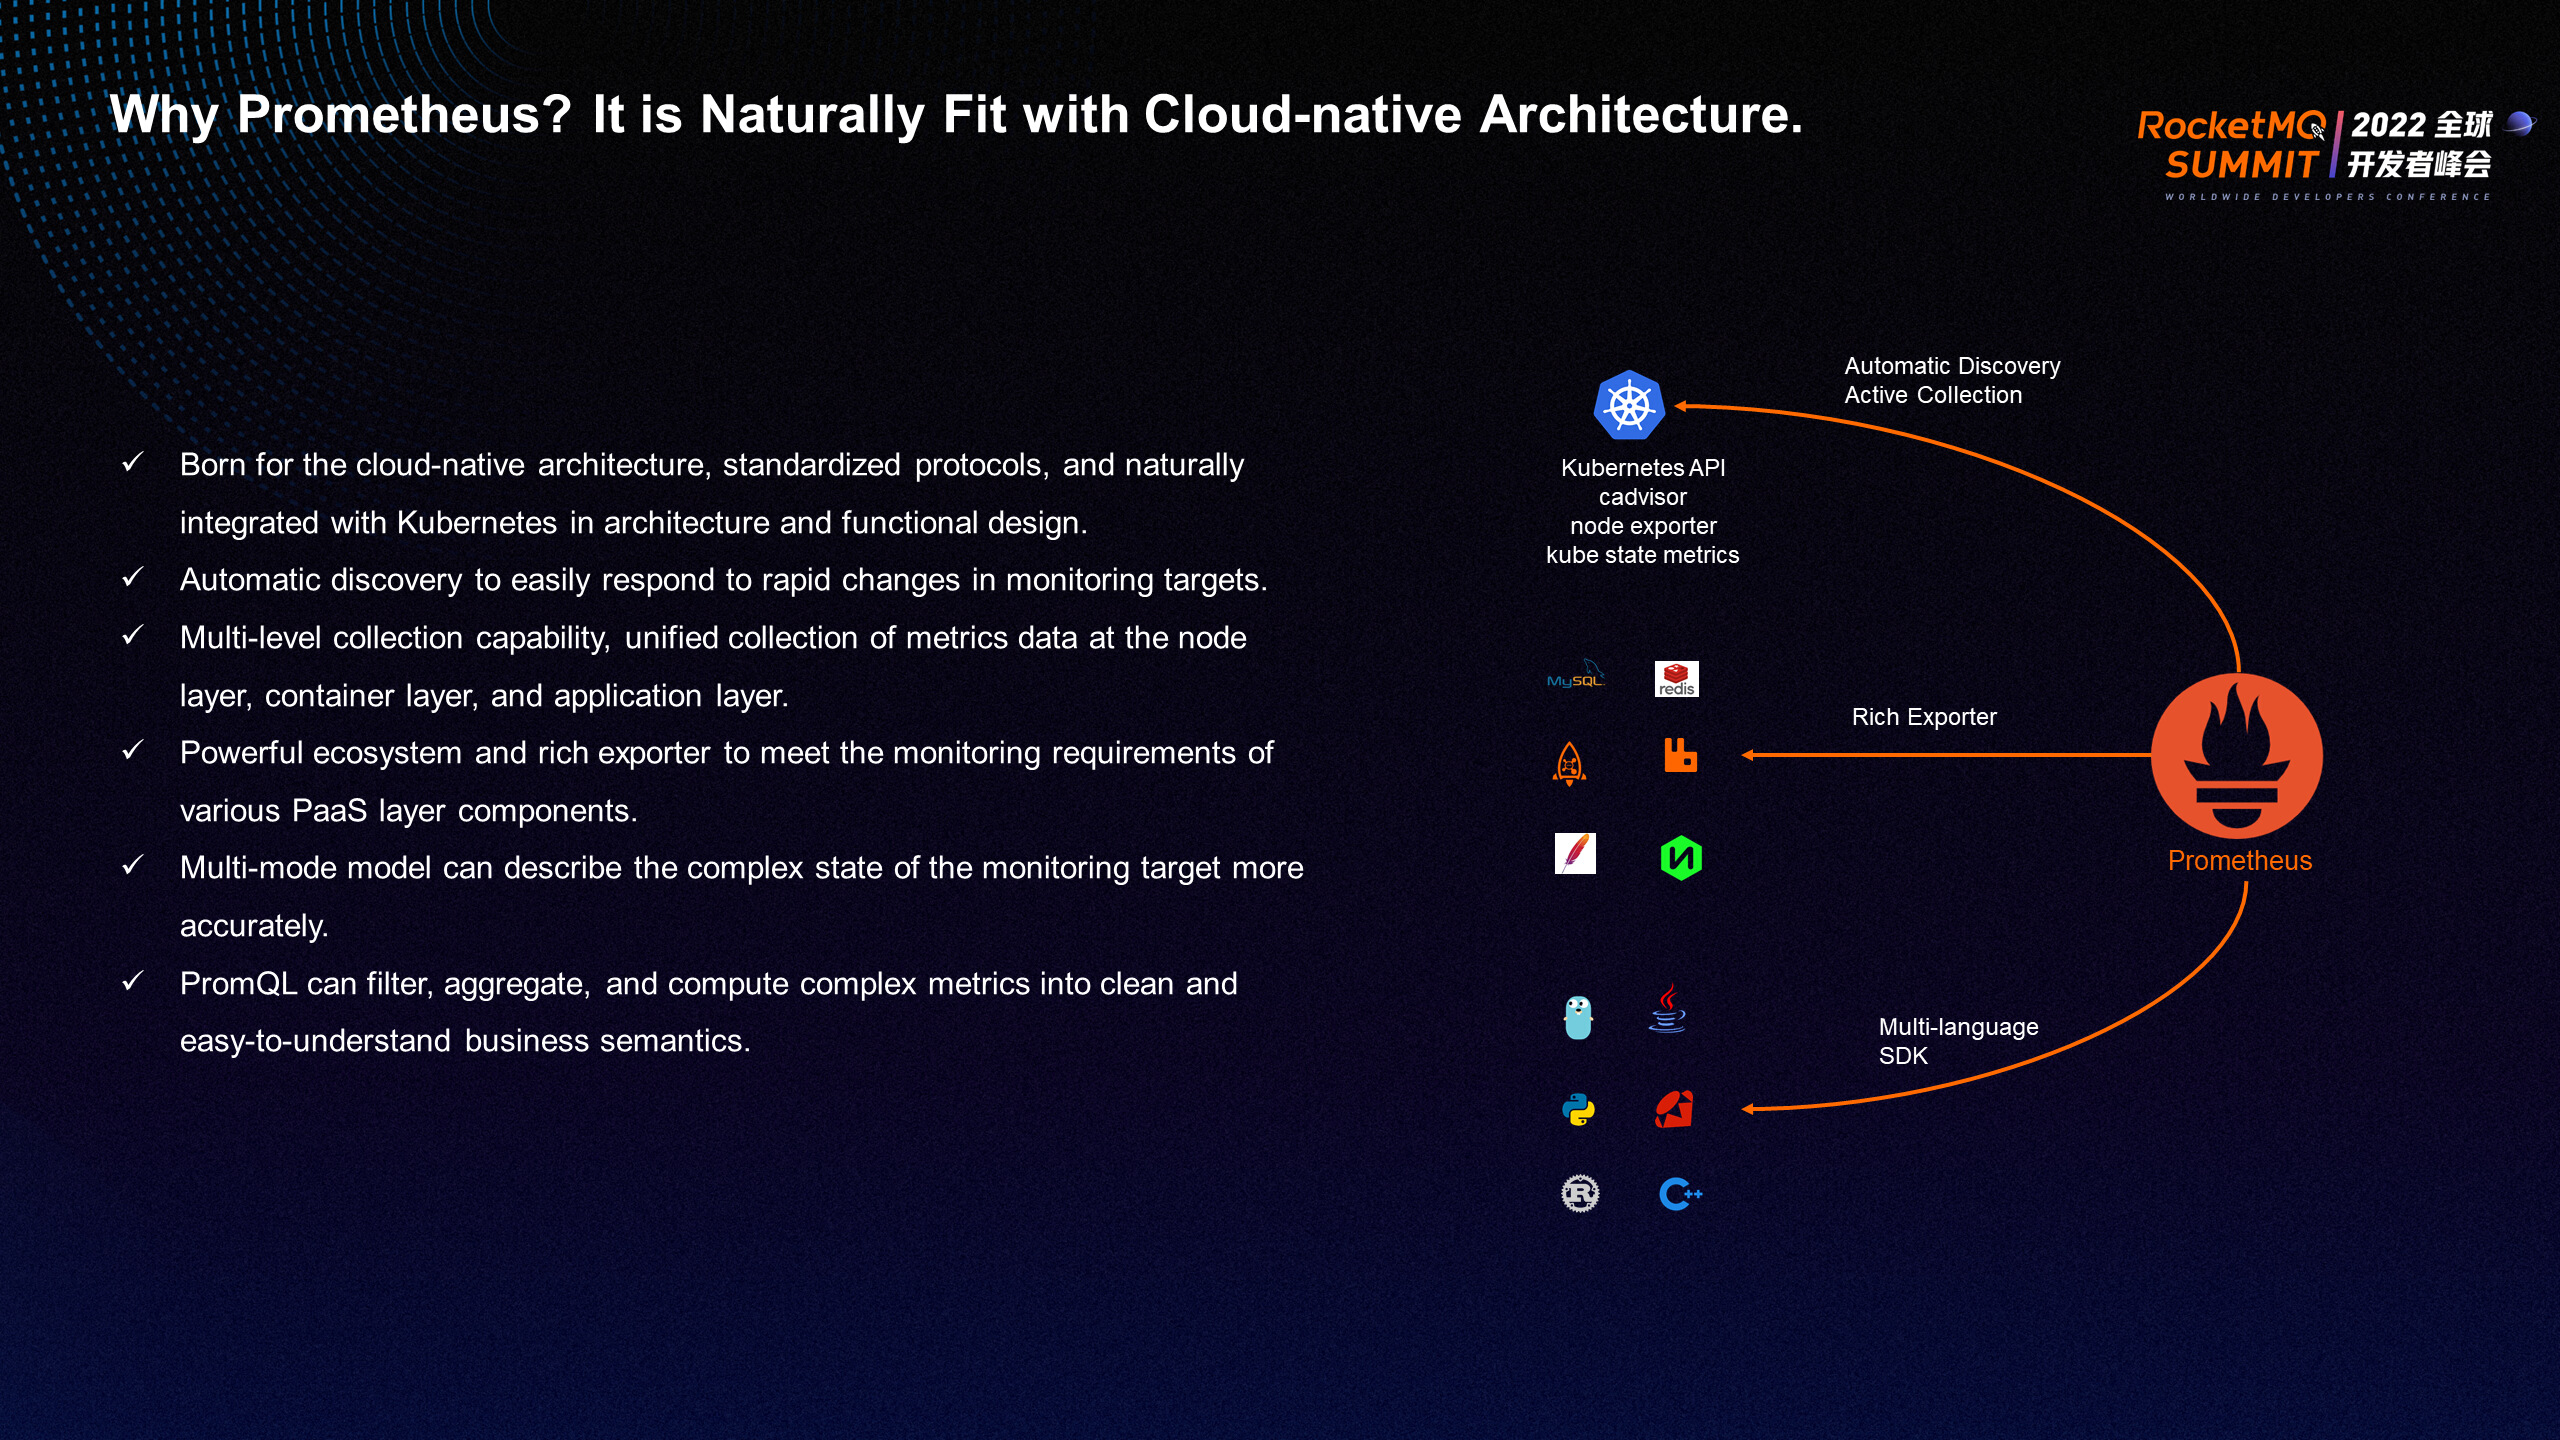
Why is the metric data of RocketMQ connected to Prometheus? Prometheus is naturally compatible with the cloud-native architecture. Prometheus is in the position of the fact standard for metrics in the open-source field. Prometheus is built on the cloud-native architecture and is naturally integrated with Kubernetes. Prometheus features automatic discovery and multi-level collection capabilities. It is a powerful ecosystem and has a common multi-modal metric model with a powerful PromQL query syntax.
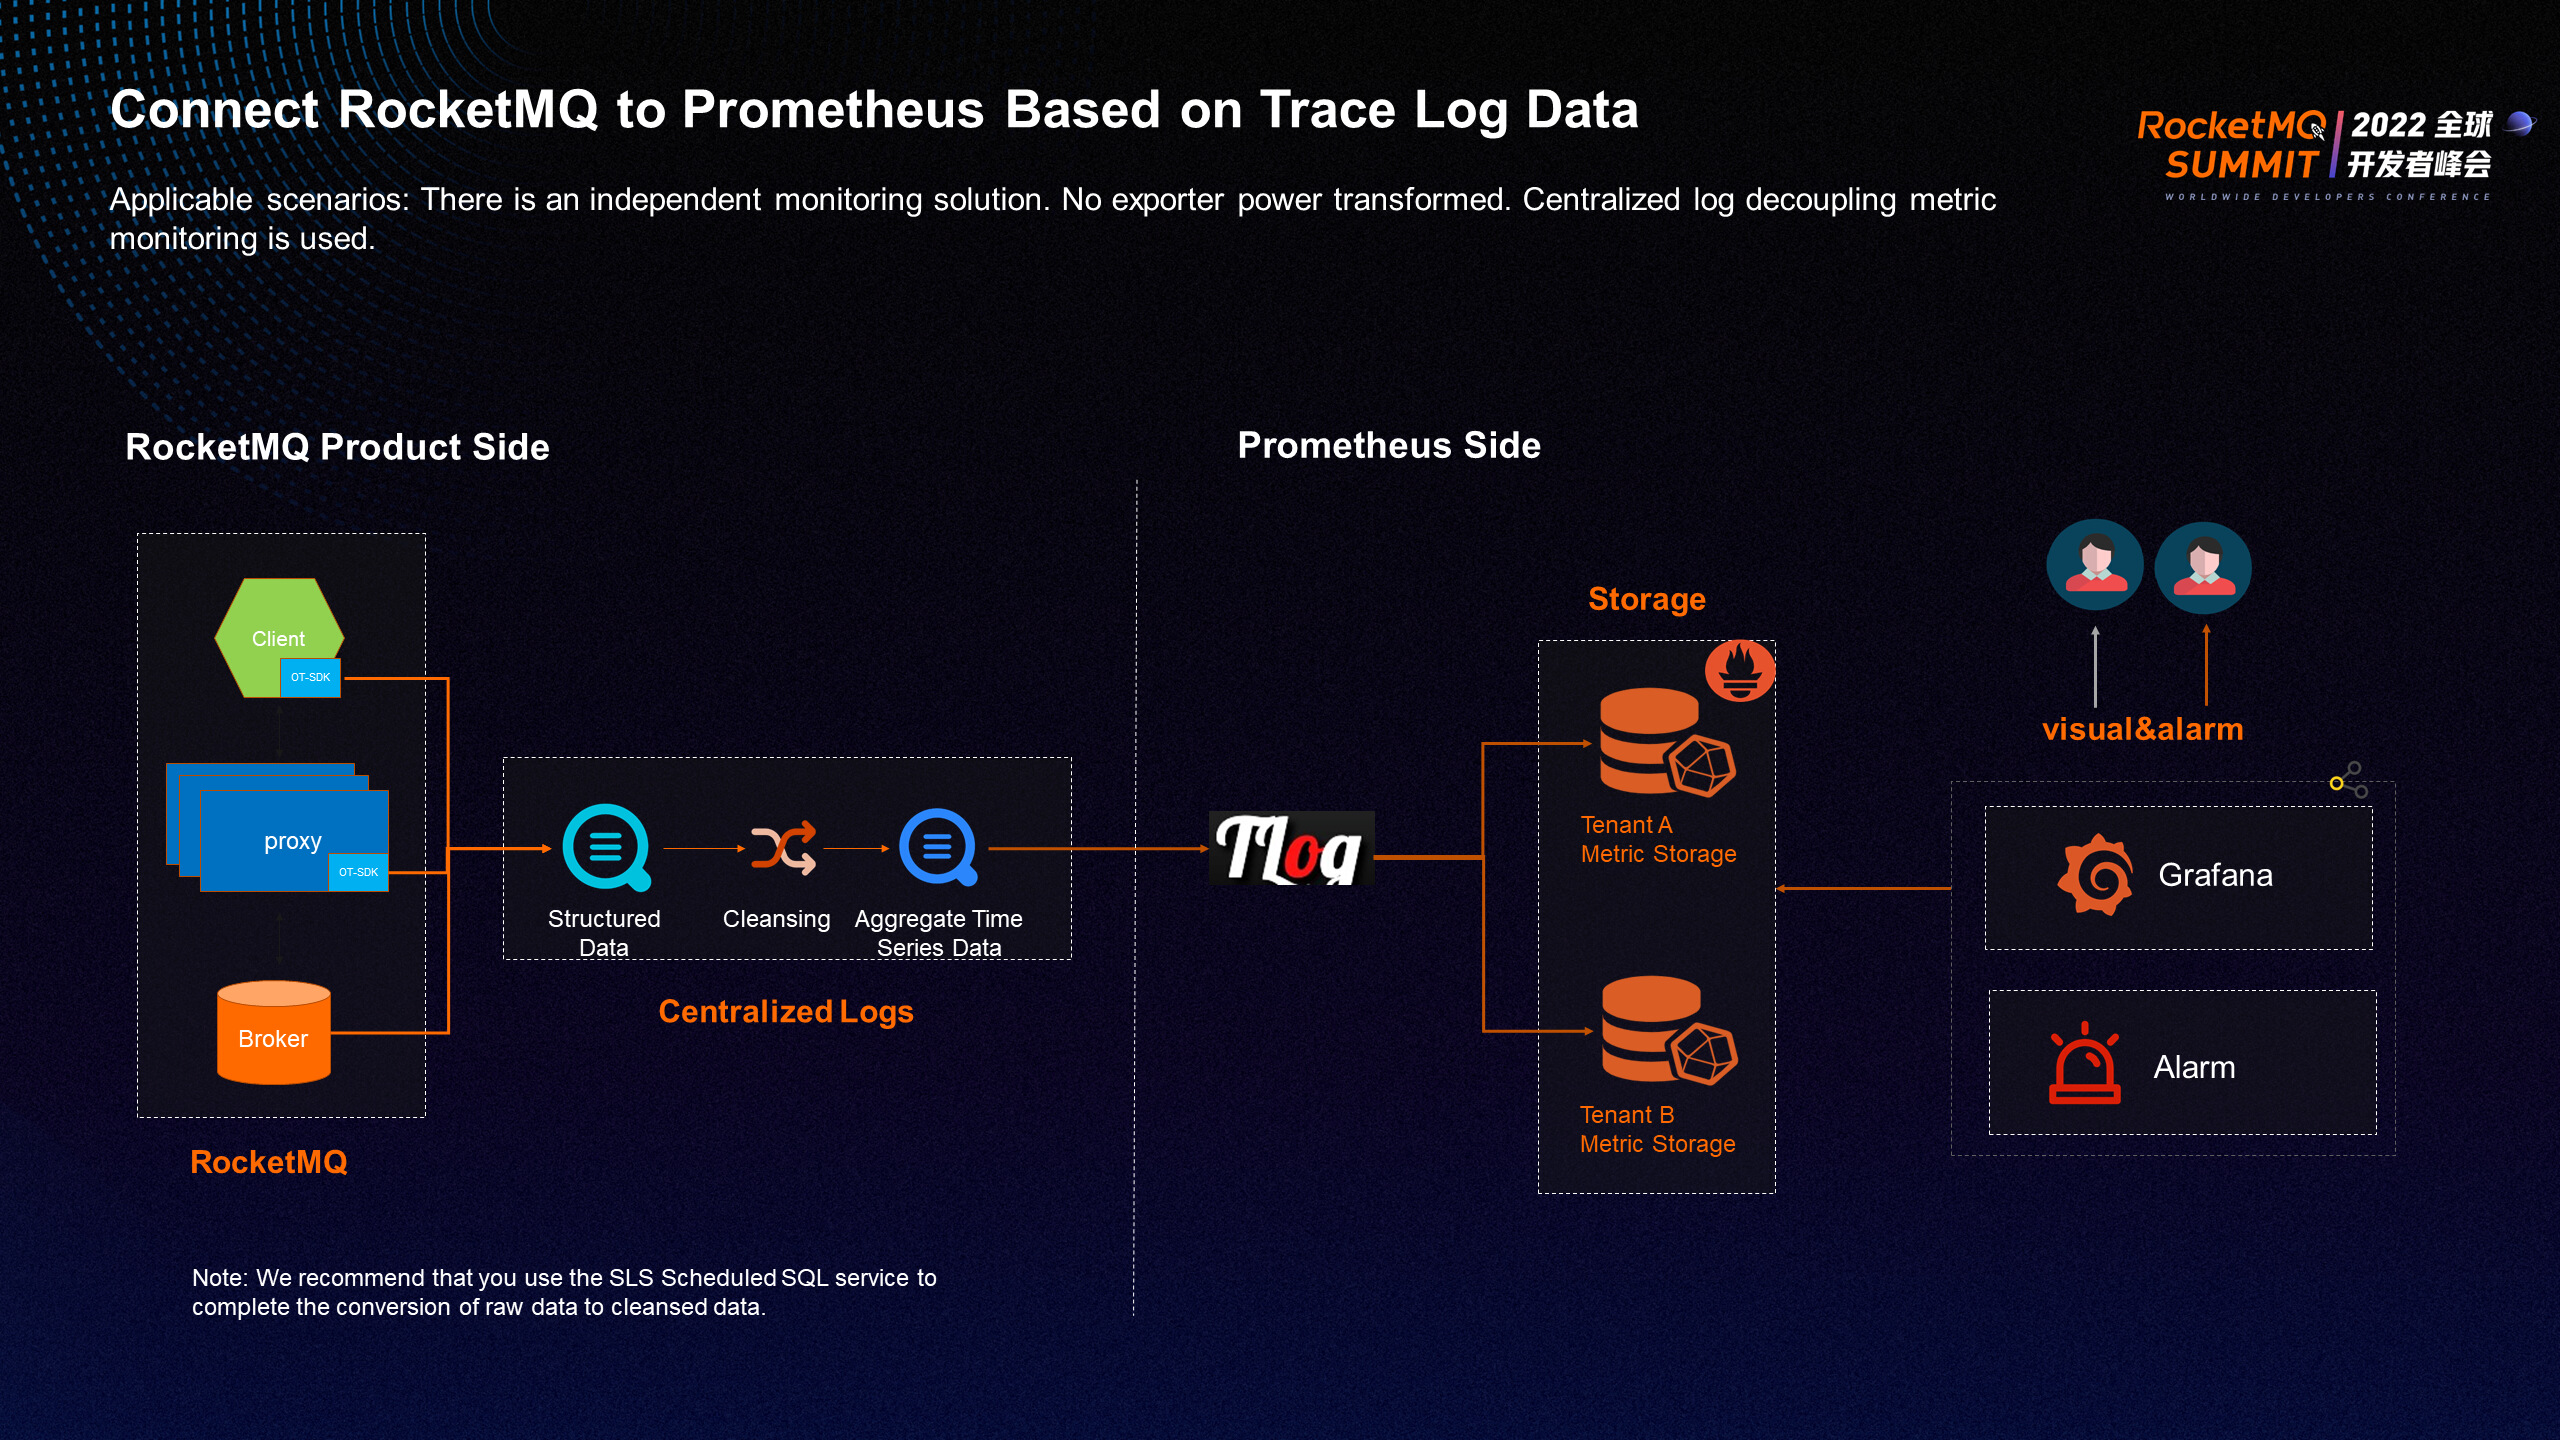
RocketMQ performs secondary computing based on trace data for metrics to connect to Prometheus. As mentioned earlier, RocketMQ 5.0 introduces the OpenTelemetry tracking system. The tracing data reported by the client and the server is stored in the Alibaba Cloud log system. The tracing data is aggregated based on multiple dimensions to generate time series data that meets the Prometheus metric specifications. Within the ARMS Team, the real-time ETL tool is used to convert log data into metrics by the tenant and store them in the Prometheus system. The RocketMQ console is deeply integrated with the dashboard and alarm modules of Grafana. You only need to activate Prometheus on the instance monitoring page of RocketMQ to obtain dashboard and alarm information in your name in one click.
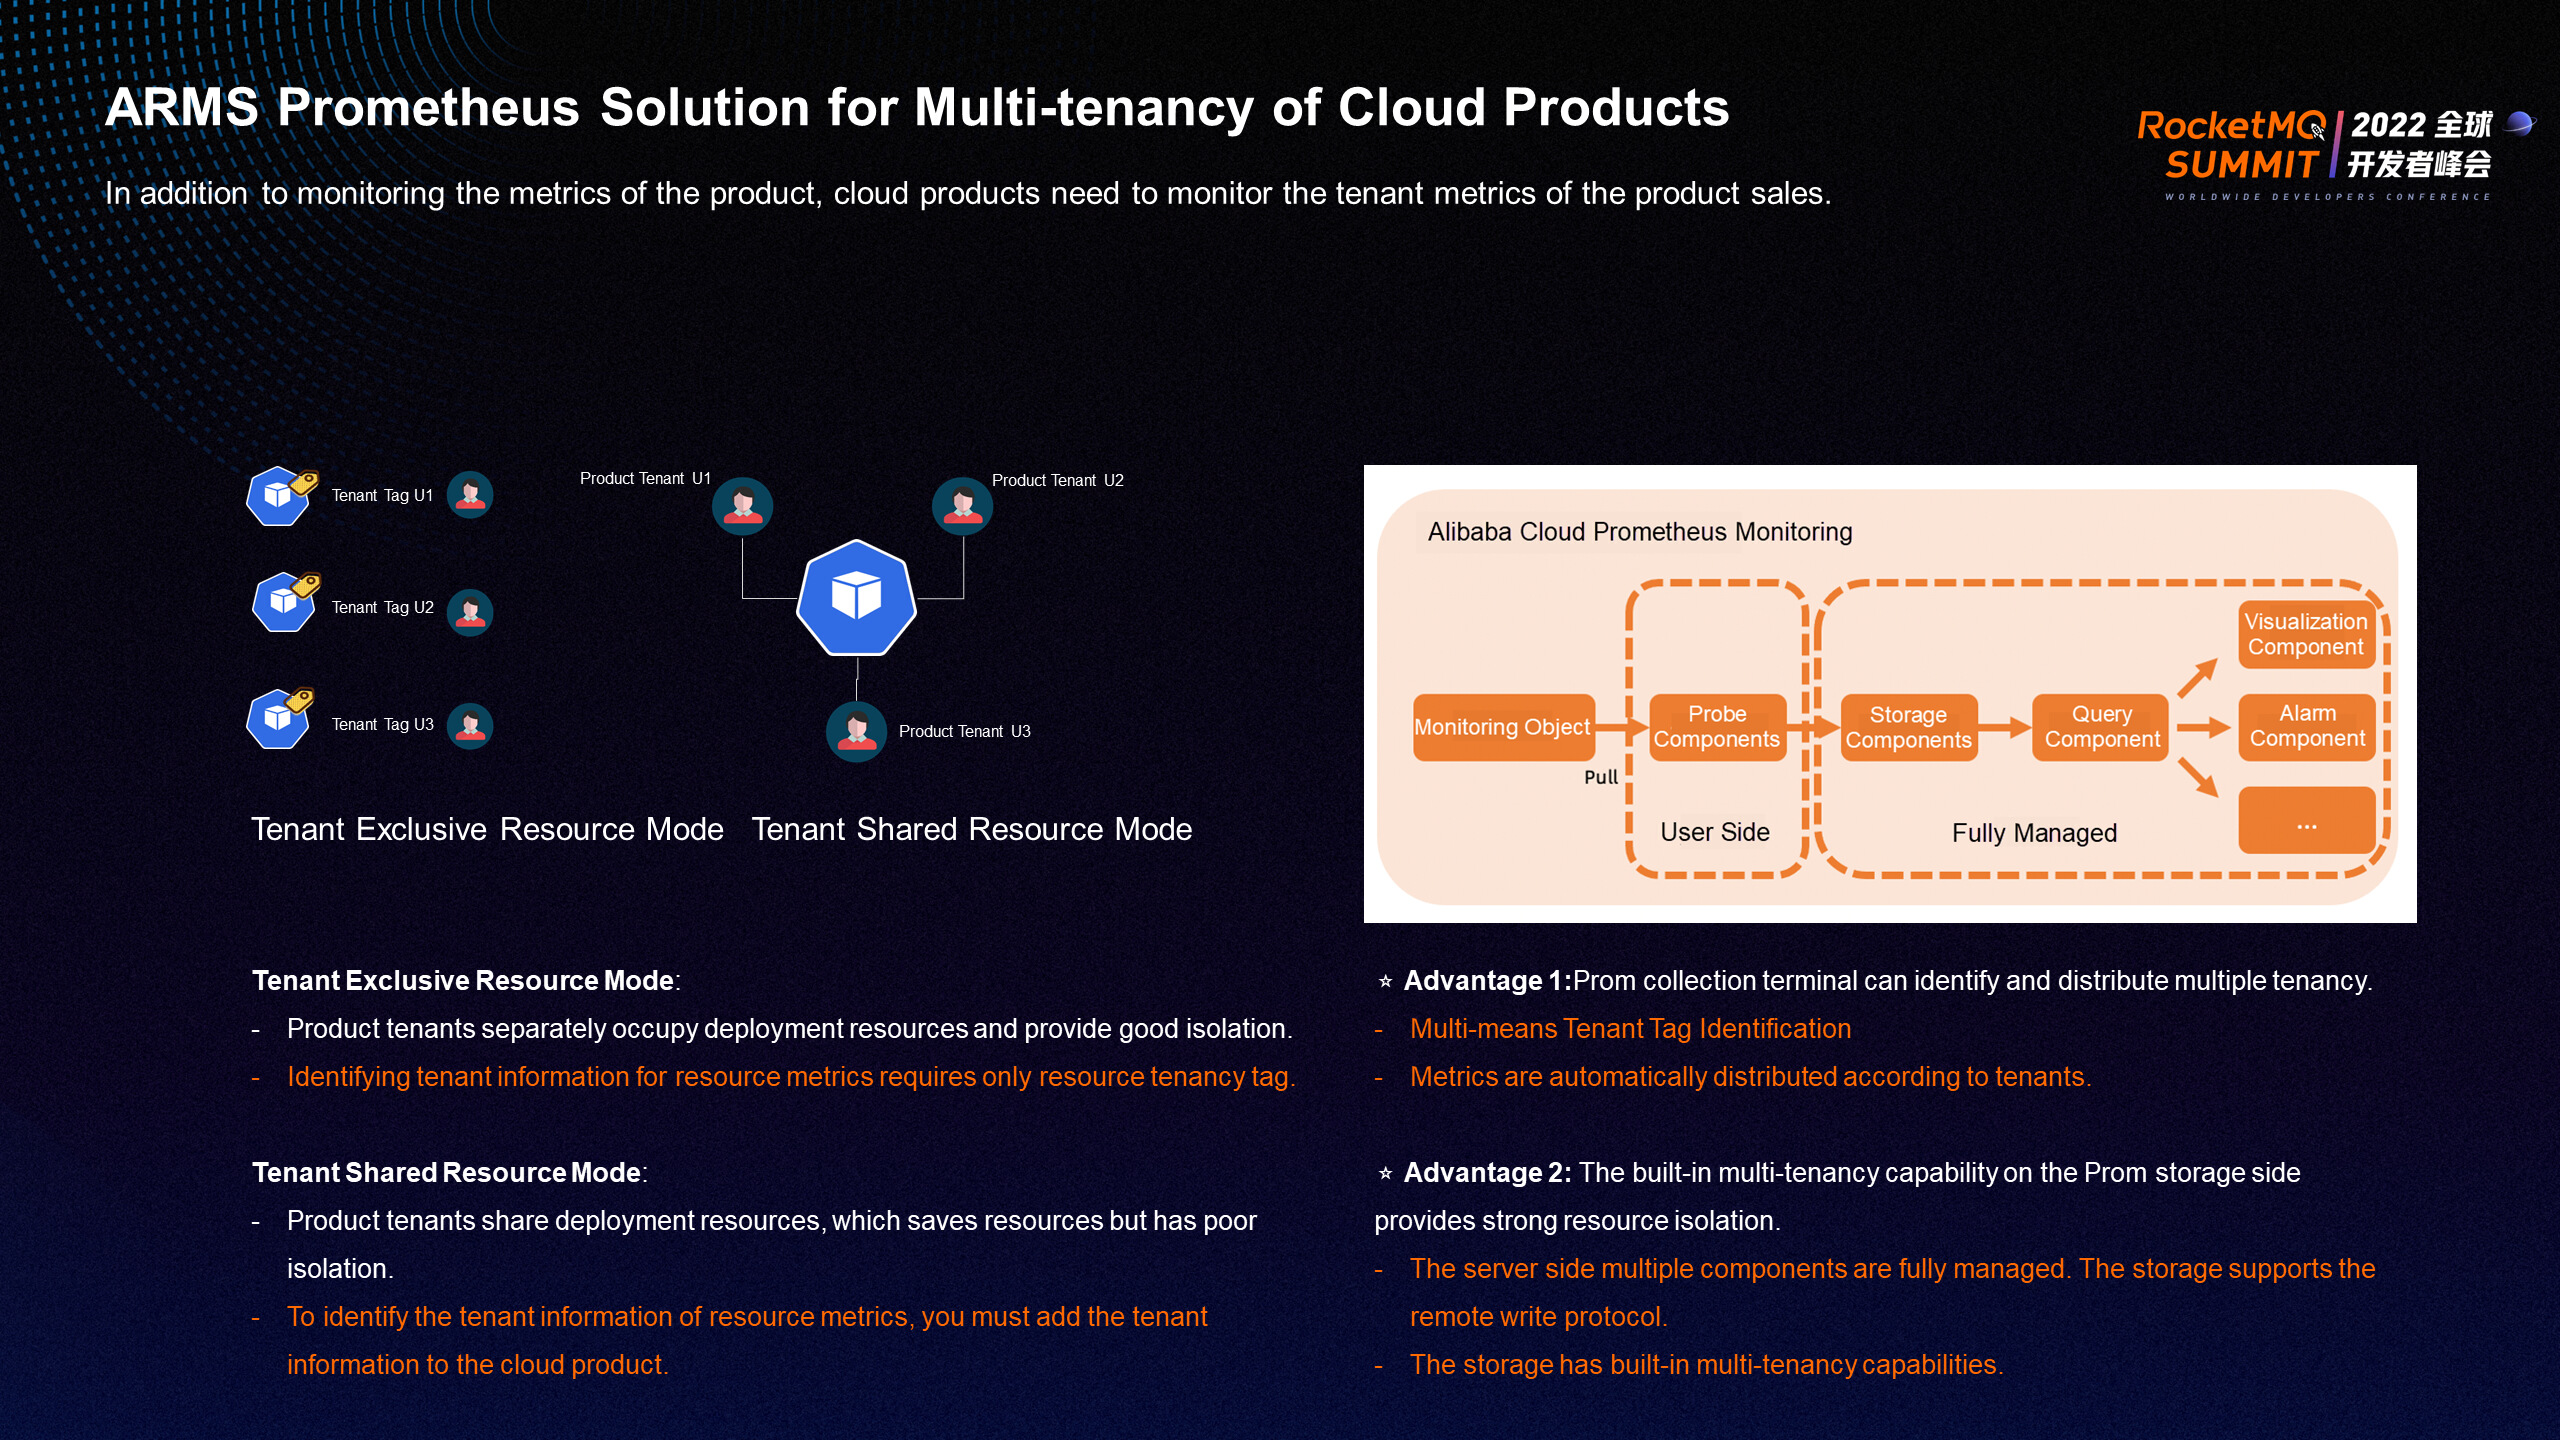
ARMS Prometheus integrates many monitoring metrics of cloud services and provides a complete solution to meet the multi-tenancy requirements of cloud services. In addition to the metrics of Alibaba Cloud products, you need to monitor the metrics of the tenants that sell products.
Cloud products are divided into tenant-exclusive resource mode and tenant-shared resource mode. Tenant-exclusive resource mode allows tenants to have exclusive access to deployment resources with good isolation, and tenant information can be identified by simply adding tenant indicators. Tenant-shared resource mode means that deployment resources are shared among tenants, and tenant information for identifying metrics needs to be added by cloud products.
Compared with open-source Prometheus, ARMS Prometheus Monitoring uses an architecture that separates collection and storage. The collection end has multi-tenancy identification and distribution capabilities, and the storage end has built-in multi-tenancy capabilities, which completely isolate resources between tenants.
ARMS Prometheus creates a Prometheus instance for each Alibaba Cloud user to store the metrics of Alibaba Cloud services that correspond to the users. ARMS Prometheus solves the problem of data silos formed by scattered monitoring system data in the past and provides deeply customized, out-of-the-box dashboards and alarming capabilities for each cloud service.

The preceding figure shows an example of a Grafana dashboard integrated with RocketMQ by default. Dashboards provide fine-grained monitoring data (such as overview, topic message sending, and group ID message consumption). Compared with the open-source implementation, this dashboard provides more accurate metric data. It also combines the best practice templates polished by the RocketMQ team's years of O&M experience in the messaging field and provides the ability to continuously iterate and update.
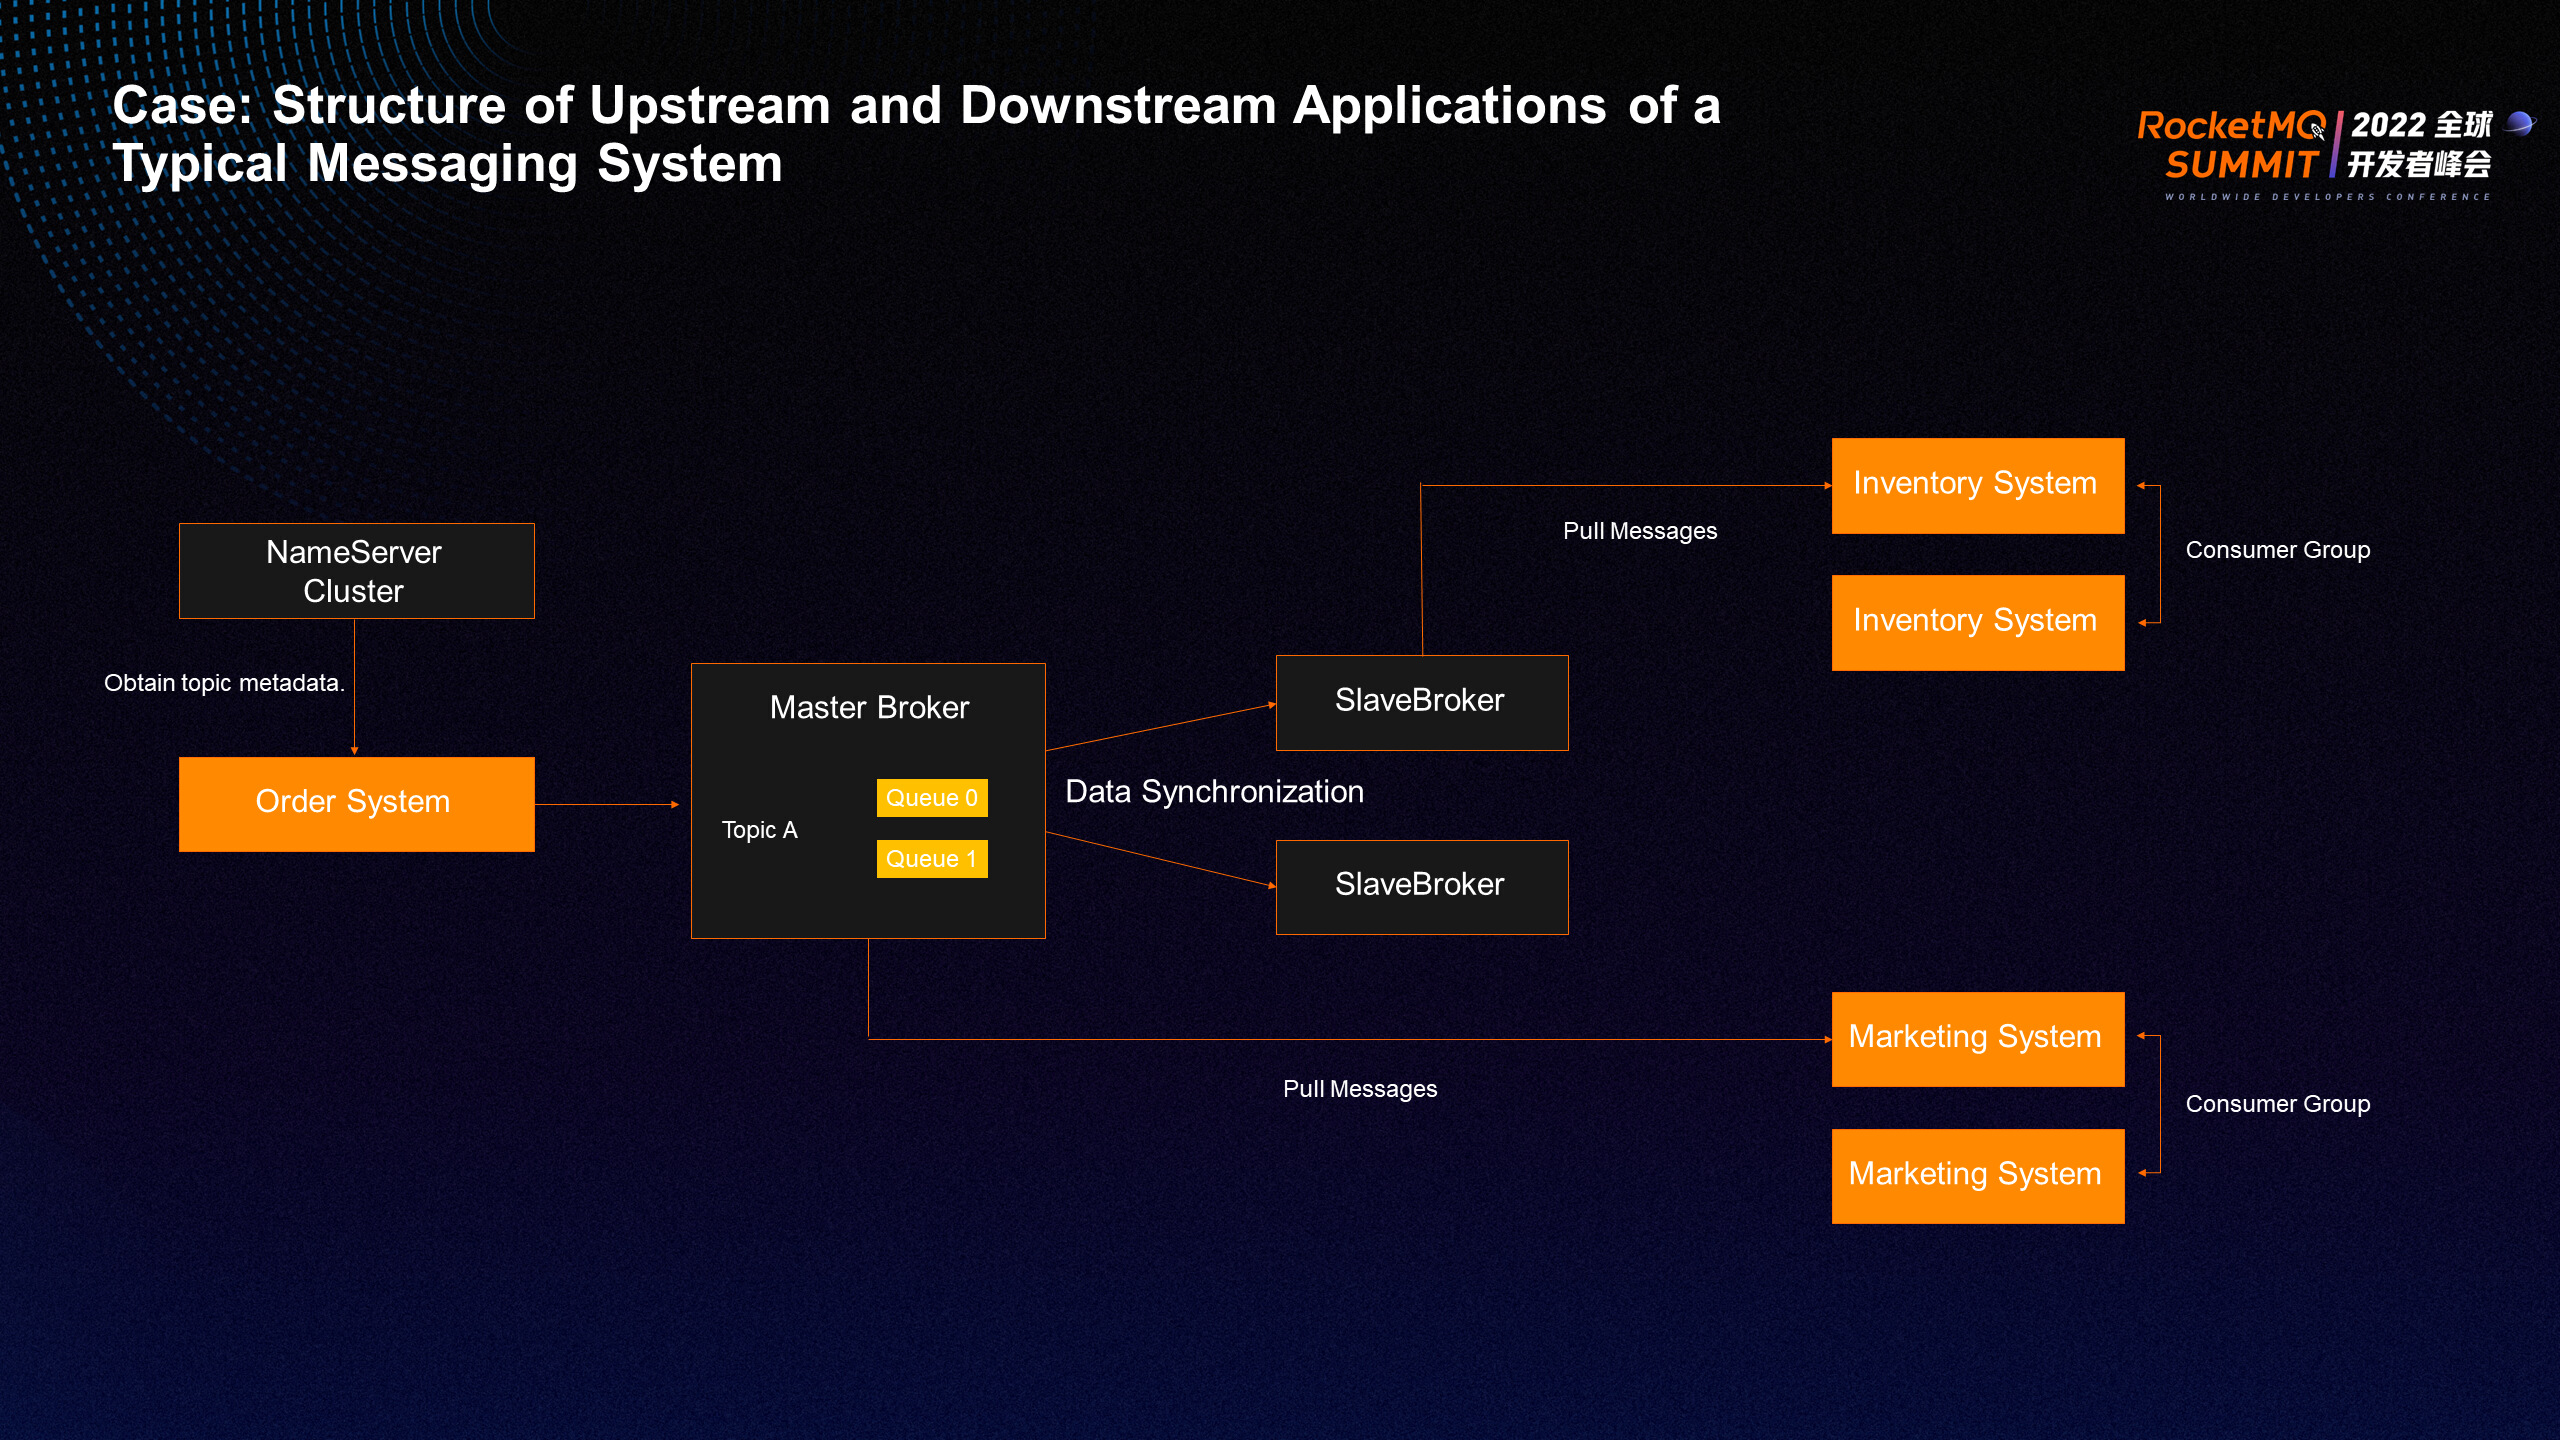
Only some problems can be identified when simply focusing on the observable data provided by the messaging system. In a real microservice system, users need to focus on the observable data at the access layer, business applications, middleware, containers, and underlying IaaS in the entire technology stack to accurately locate the problem. The preceding figure shows a typical upstream and downstream application structure of a messaging system. The upstream order system sends messages, and the downstream inventory system and marketing system subscribe to messages to implement upstream and downstream decoupling. How to find and solve problems in such a complex business system requires a comprehensive review of the entire system's observability.
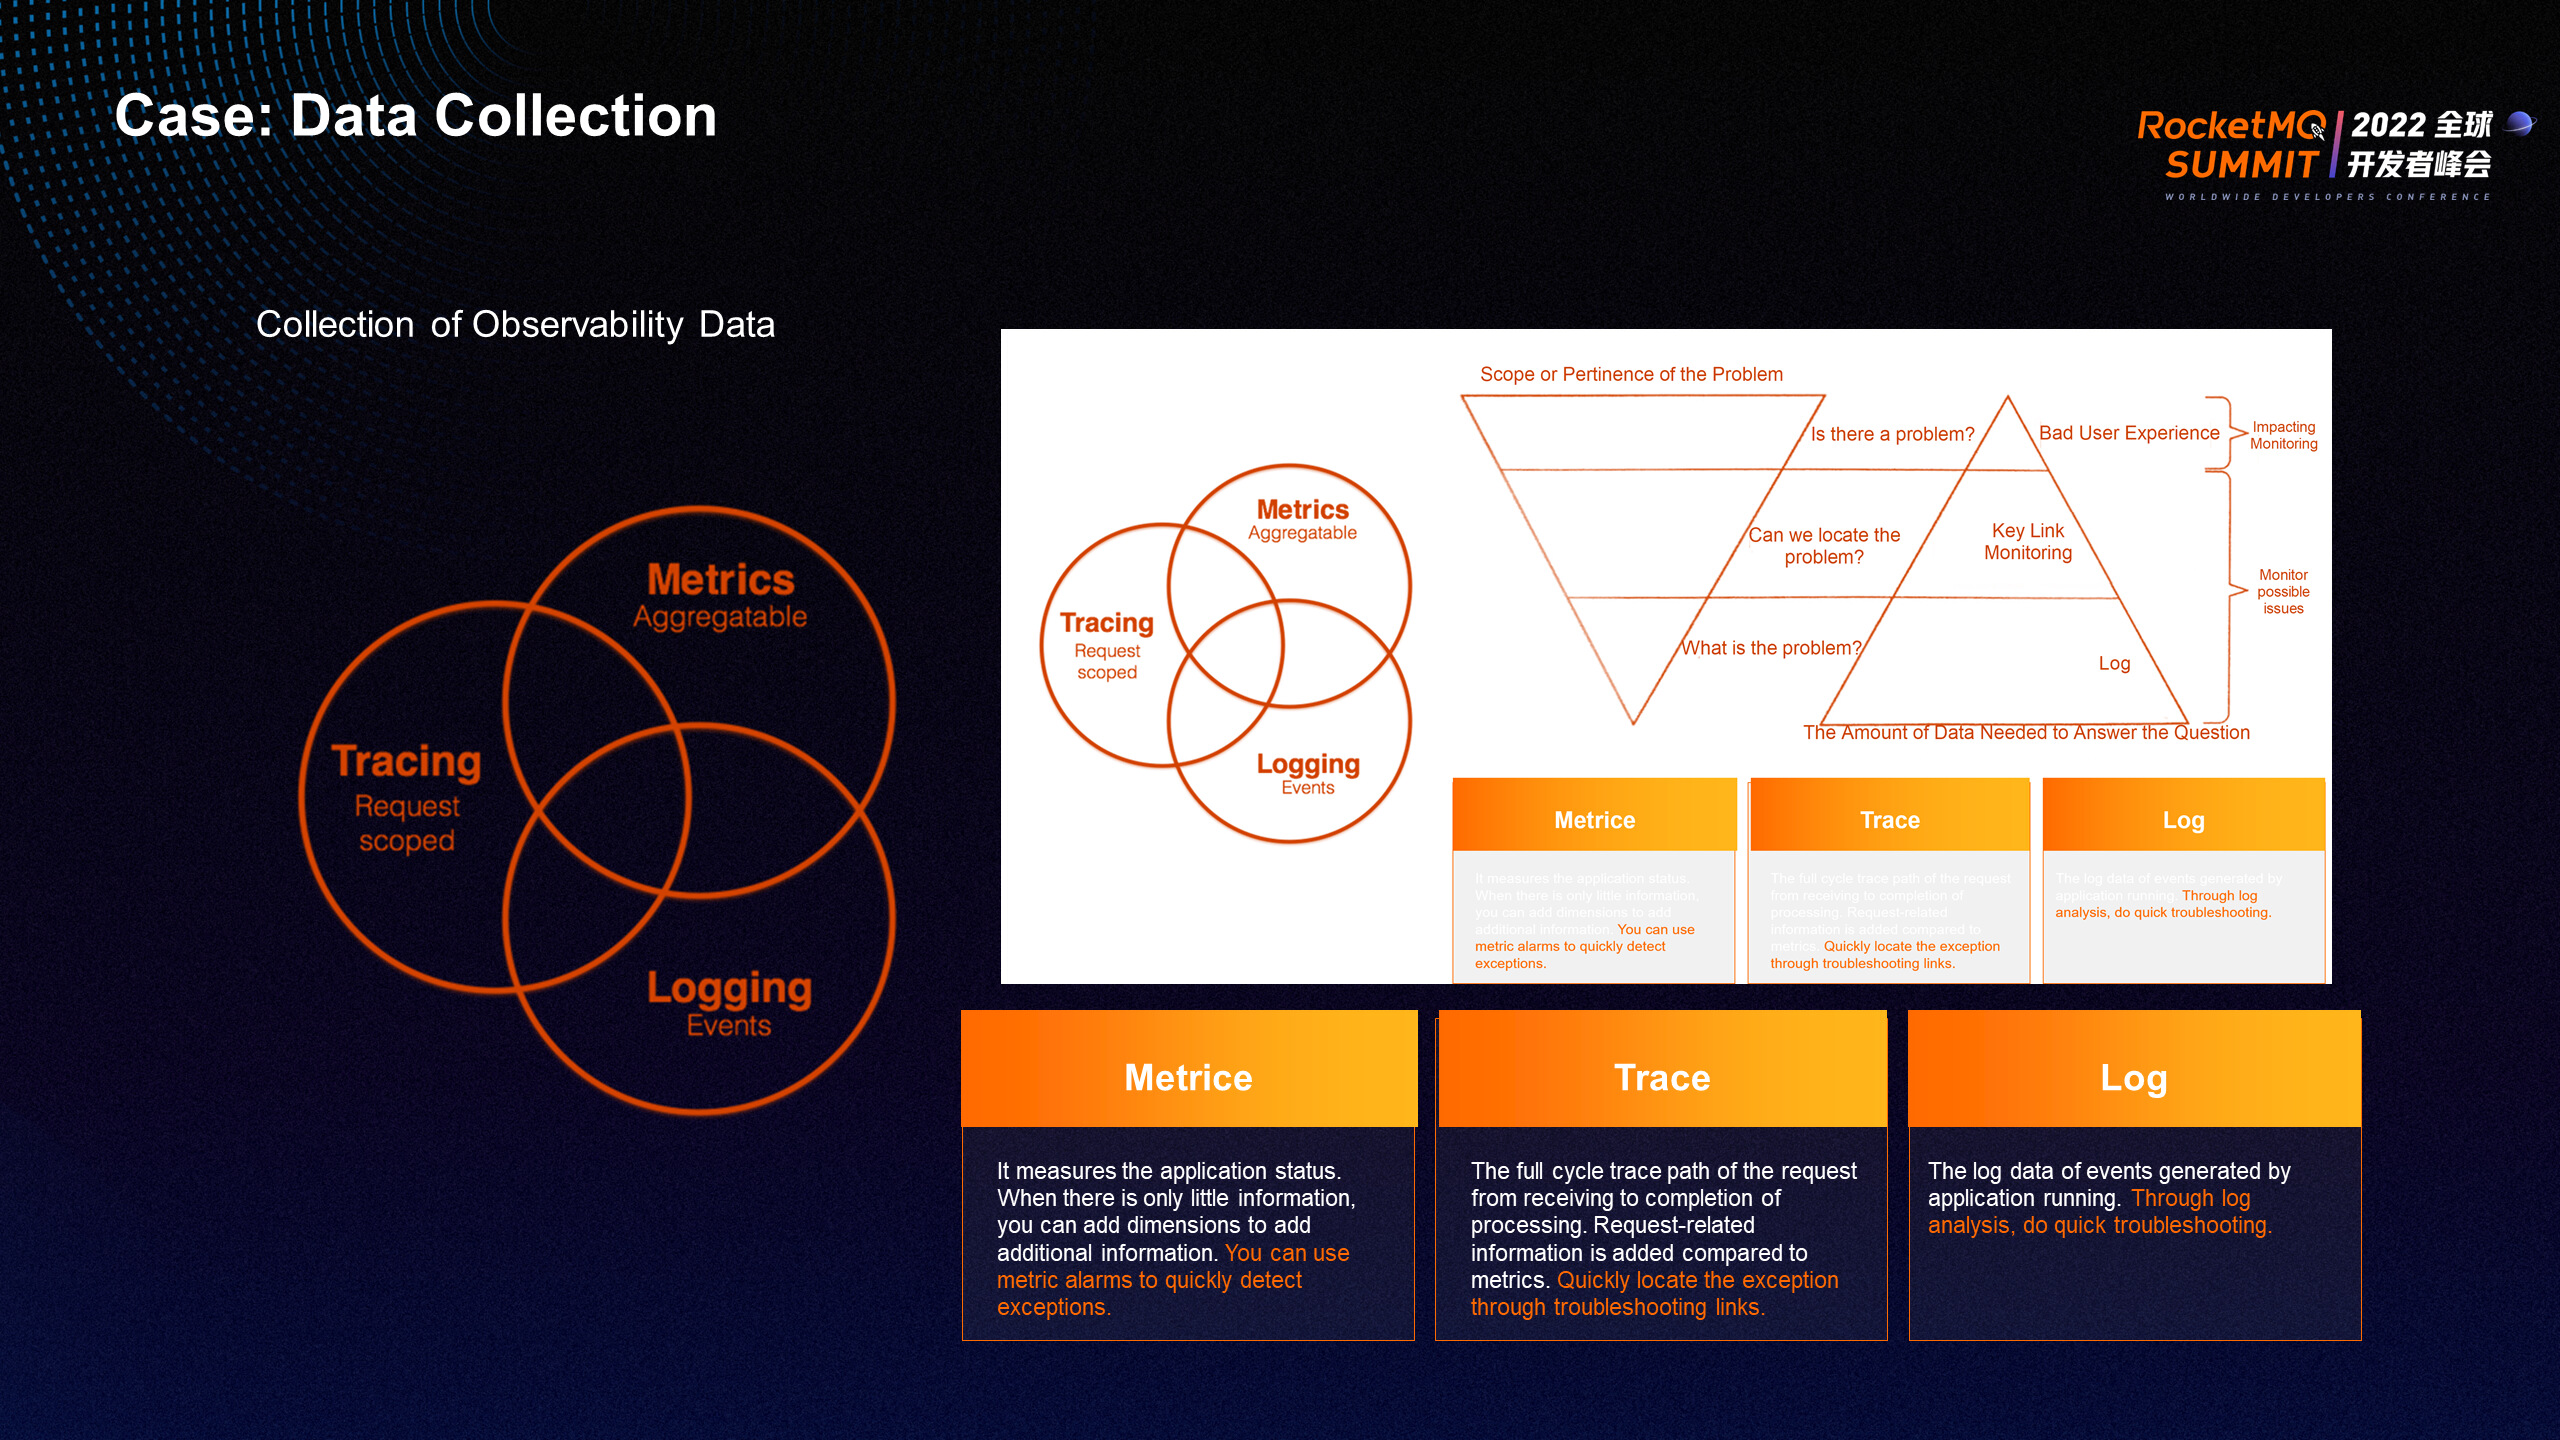
First, you need to collect the observable data of each component in the system. The three pillars of Metric, Trace, and Log are essential. Metric measures the application status and can quickly identify problems through metric alarms. Trace data can be used to trace the full cycle at the request level and troubleshoot through the call link. Log data records the events generated by the system in detail and can be quickly troubleshot through log analysis.

The preceding figure shows the diagnostic experience of ARMS Kubernetes monitoring precipitation. It provides a practical reference for us to diagnose and locate observable problems horizontally and vertically through the end-to-end and top-down full-stack correlation of the application technology stack. For business-related components, more attention needs to be paid to RED metrics that affect user experience, and more attention should be paid to metrics related to resource saturation at the resource layer. At the same time, you need to pay attention to logs, events, and trace correlations horizontally. Only multi-directional and full-view observability can be used to troubleshoot and locate problems more clearly.
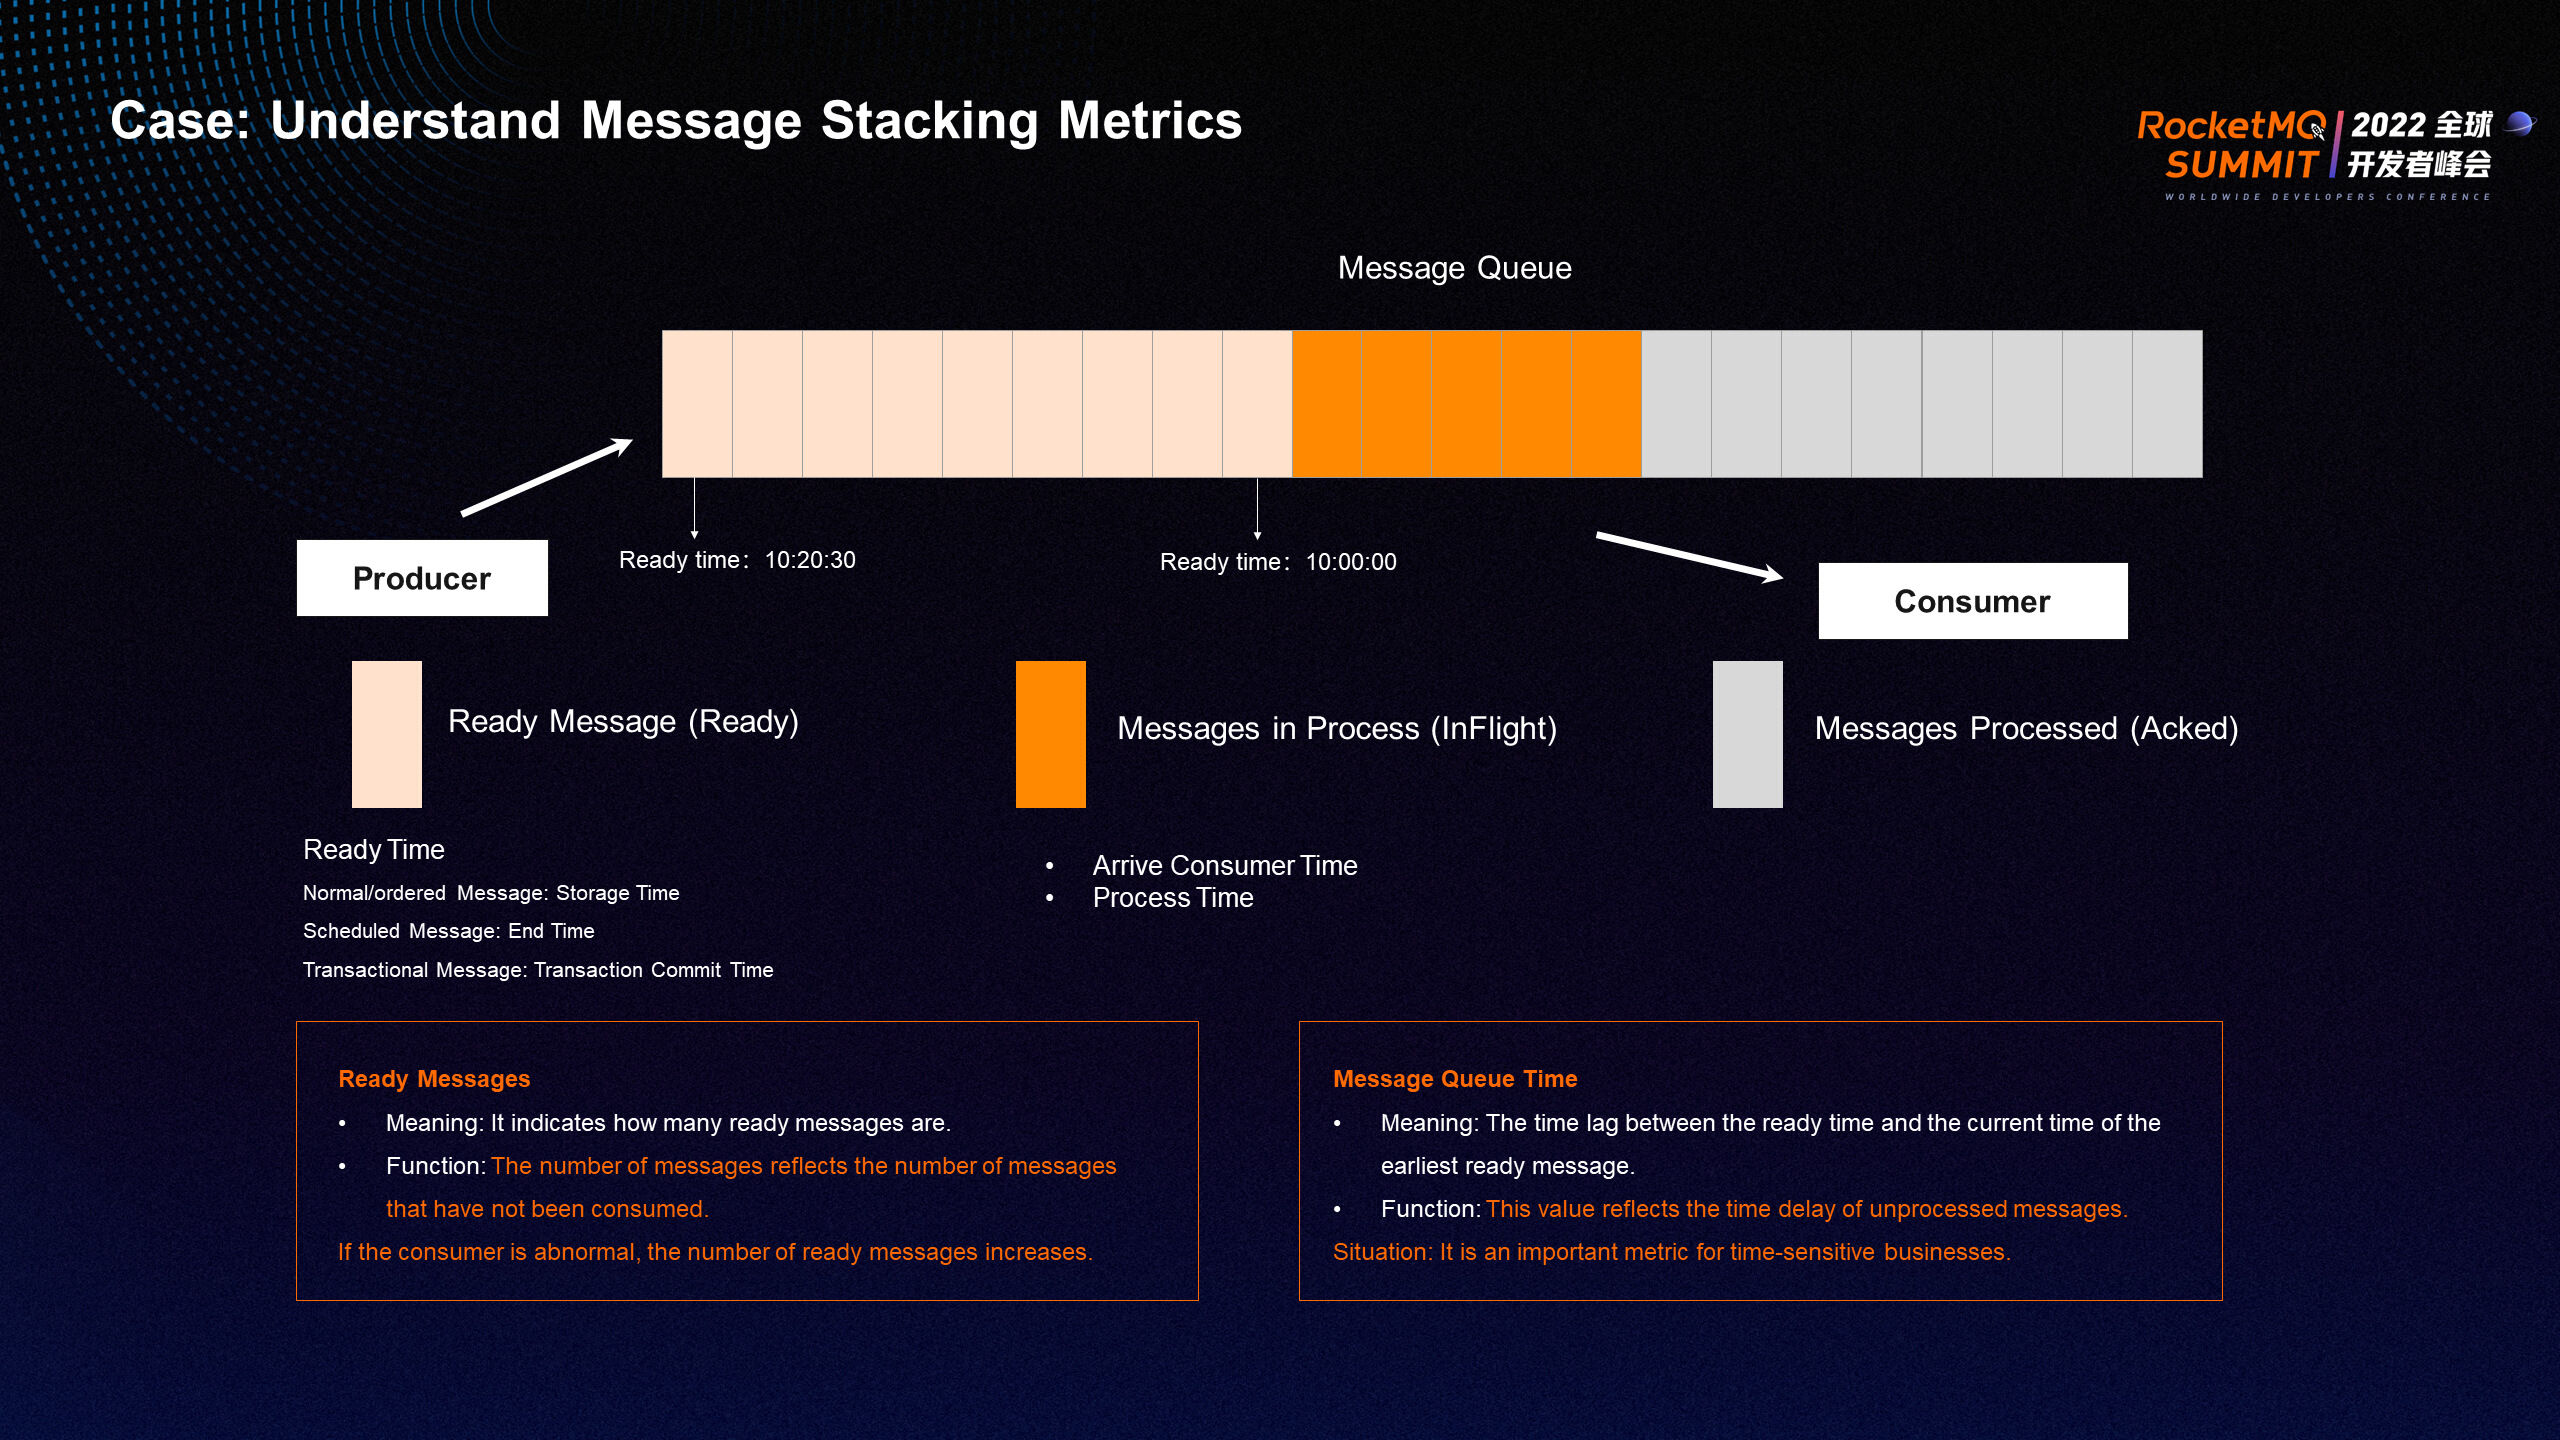
The preceding figure shows an example of a message-stacking scenario.
First, you need to understand the meaning of message stacking metrics. After a message is sent by a producer, it is in the Ready, inFlight, and Acked states at the message queue processing stage and the consumer consumption stage. You need to focus on two metrics. The Ready message indicates the number of messages that are ready. It reflects the number of messages that have not been consumed yet. If the consumer is abnormal, the number of ready messages increases. The queue time indicates the time difference between the earliest ready message and the current ready message. This time size reflects the time delay of the unprocessed message and is an important metric for time-sensitive services.

There are two main reasons for message stacking:
For the production end, more attention should be paid to the health of message sending, and alerts can be set up for the success rate of message sending. When an alarm occurs, you need to pay attention to metrics such as load, sending duration, and message volume to determine whether there is a sudden change in the number of messages. The consumer should focus on whether it consumes the consumption health in time. You can alert based on the queue time of ready messages. When an alarm is generated, you must check the message processing time, success rate of message consumption, message volume, load, and other related metrics to determine the changes in the message volume and consumption processing time and check whether relevant information is available (such as error logs and traces).
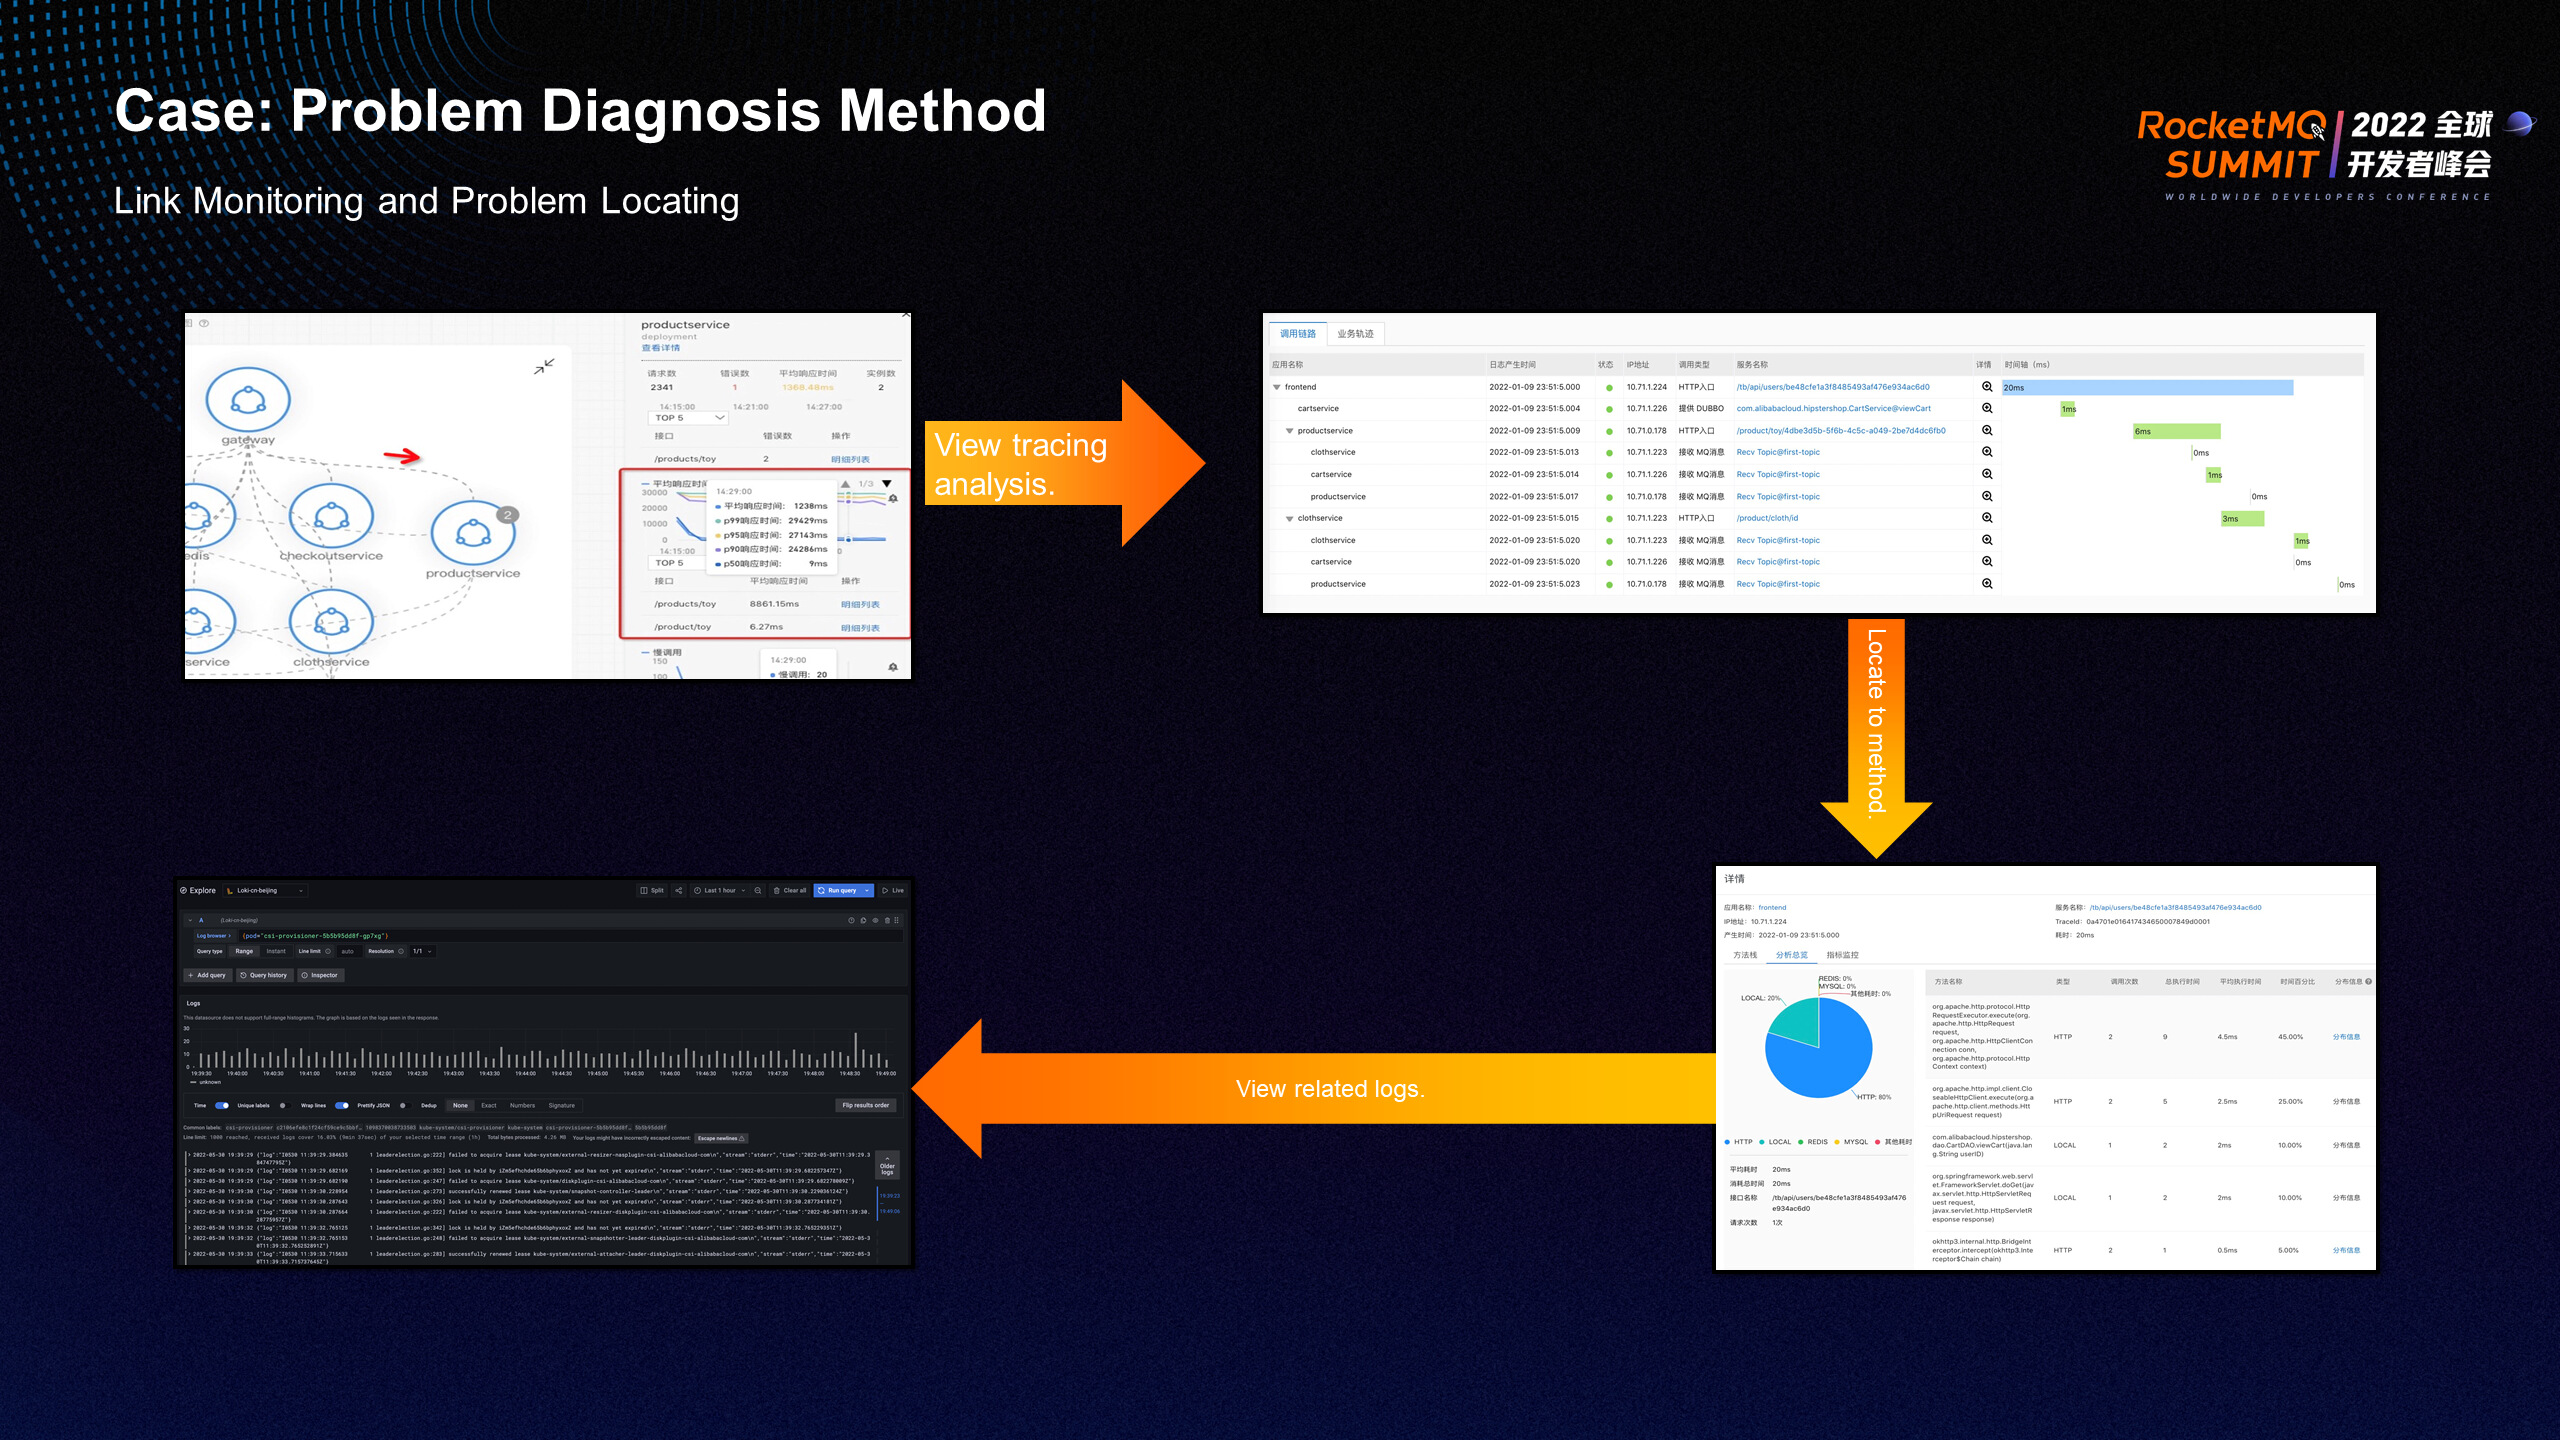
You can use Alibaba Cloud ARMS to handle the preceding troubleshooting process conveniently and quickly.
After receiving the alarm information, you can query the business topology, exception labels, and changes in business metrics and view the associated trace information with one click. You can obtain the processing duration of each stage of business processing and whether exceptions exist on the trace information. Each span node of the call chain can be drilled down to query the call stack and duration in real-time to locate the problem at the business code level. If the log accessed by users is associated with the traceID of the call chain according to the ARMS standard, you can also view the corresponding log details with one click to locate the root cause of the problem.
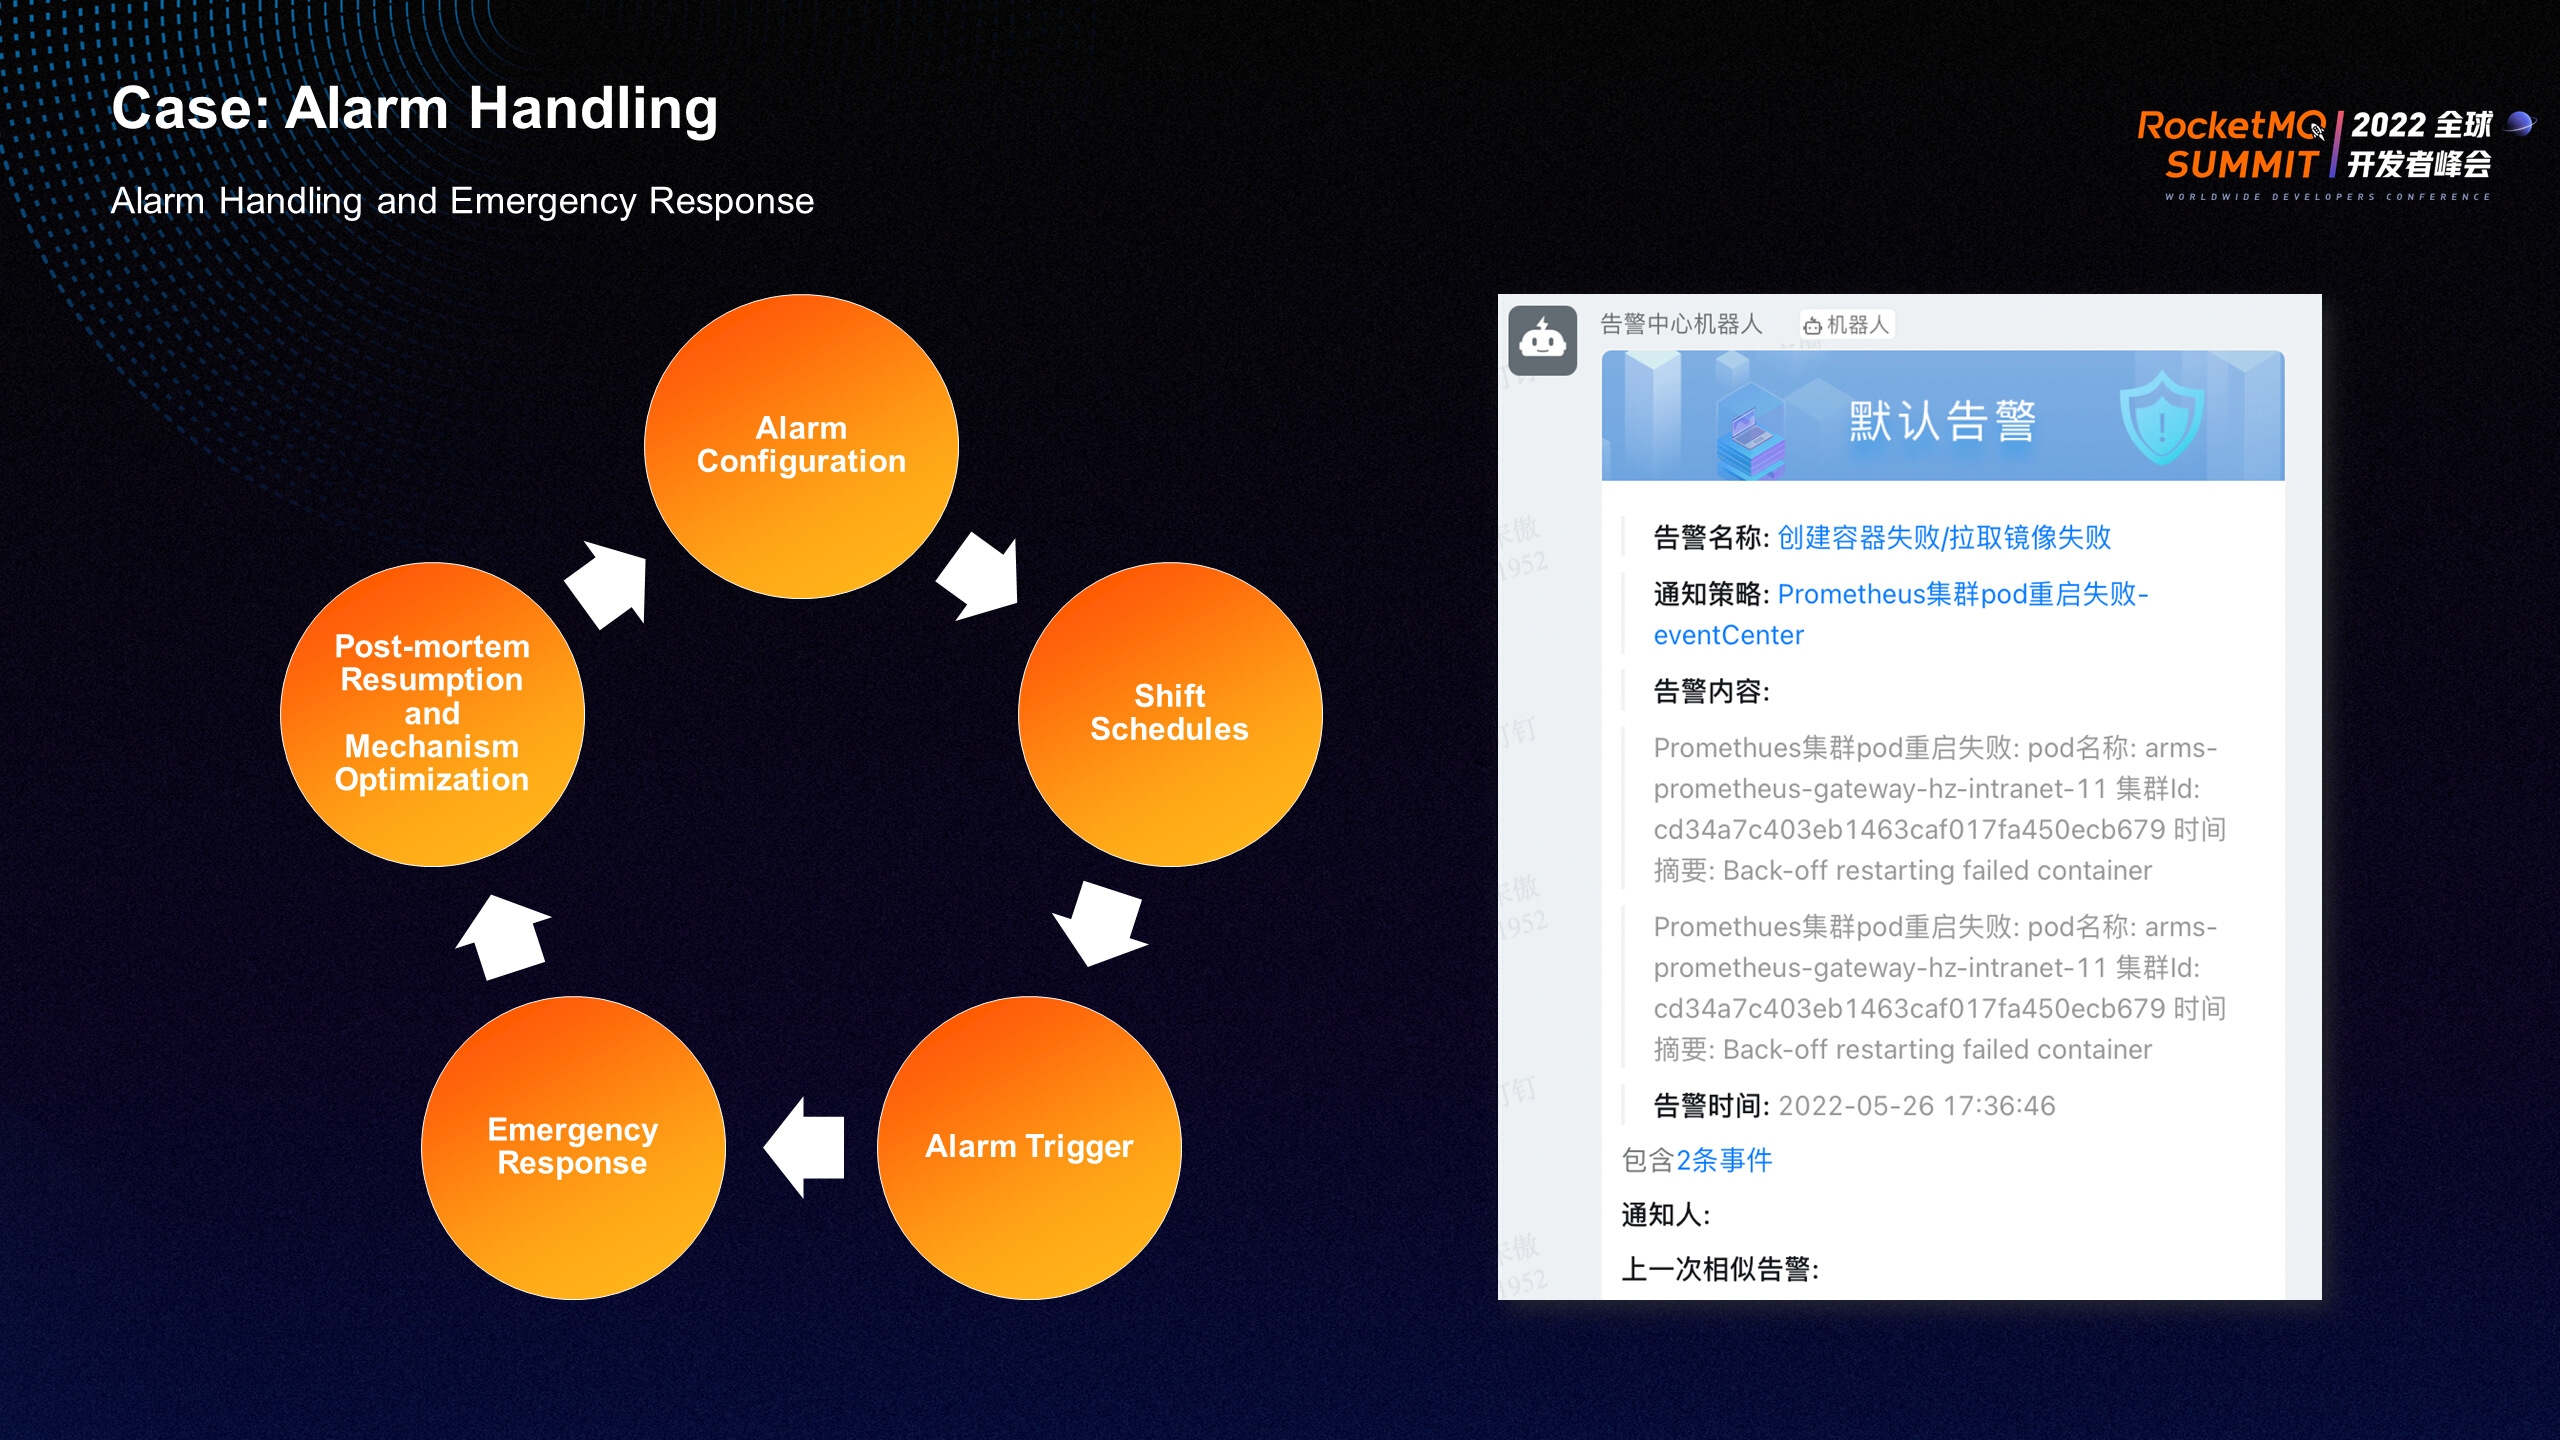
When a problem occurs, in addition to a convenient and fast problem location process, it is necessary to provide a relatively complete alarm handling and emergency response mechanism. ARMS Alarm provides the full-process functions of alarm configuration, alarm scheduling, and alarm handling. This facilitates the establishment of emergency handling, subsequent review, and mechanism optimization.

In addition, the intelligent alarm platform of ARMS supports the integration of more than ten monitoring data sources and multi-channel data push. DingTalk-based CHARTOPS allows alarms to be coordinated, traceable, and counted. It also provides algorithm capabilities (such as exception detection and intelligent noise reduction) to reduce invalid alarms and obtain the root cause analysis of alarms based on the application context.

Alibaba Cloud ARMS provides comprehensive, three-dimensional, unified monitoring and unified alarm capabilities for your terminals, applications, cloud services, third-party components, containers, and infrastructure. It is a comprehensive best practice platform for enterprises to build observability.
Exploration and Practice of Proxyless Mesh for Spring Cloud Applications

675 posts | 56 followers
FollowAlibaba Cloud Native Community - September 28, 2021
Alibaba Cloud Native - April 6, 2022
Alibaba Cloud Native Community - March 20, 2023
Alibaba Cloud Native Community - December 6, 2022
Alibaba Cloud Native Community - January 5, 2023
Alibaba Cloud Native Community - December 6, 2022

675 posts | 56 followers
Follow ApsaraMQ for RocketMQ
ApsaraMQ for RocketMQ is a distributed message queue service that supports reliable message-based asynchronous communication among microservices, distributed systems, and serverless applications.
Learn More Application Real-Time Monitoring Service
Build business monitoring capabilities with real time response based on frontend monitoring, application monitoring, and custom business monitoring capabilities
Learn More AliwareMQ for IoT
A message service designed for IoT and mobile Internet (MI).
Learn More Message Queue for RabbitMQ
A distributed, fully managed, and professional messaging service that features high throughput, low latency, and high scalability.
Learn MoreMore Posts by Alibaba Cloud Native Community
Dikky Ryan Pratama May 8, 2023 at 7:00 am
I have tried this tutorial to do monitoring