By Kenwei
Memcached is a free, open-source, high-performance, and distributed memory object caching system that allows you to store chunks of any data type in key-value pairs. Essentially, Memcached is versatile for all applications but was initially used to store frequently accessed static data and reduce the database load to speed up dynamic web applications.
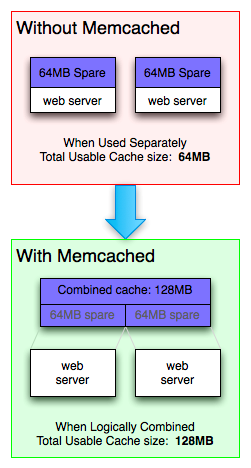
All data of Memcached is stored in memory. Unlike persistent databases such as PostgreSQL and MySQL, in-memory data stores don't have to make repeated round trips to disk. This allows them to provide memory-level response time (less than 1 millisecond) and support 1 billion operations per second.
The distributed multi-threaded architecture makes it easy to expand. It supports spreading data to multiple nodes to scale out by adding new nodes to the cluster. In addition, Memcached specifies multiple cores of a node and uses multiple threads to improve processing speed.
Memcached stores any type of data and supports storing all frequently accessed data. Memcached is suitable for various application scenarios. Complex operations such as union queries are not supported to improve query efficiency.
Memcached provides client programs in various language frameworks, such as Java, C/C++, and Go.
Caching
Memcached was initially used to store static web page data (such as HTML, CSS, images, and sessions). Such data is read more and modified less. You can preferentially return static data in memory when accessing a web page, thereby improving the response speed of the website. Like other caches, Memcached does not guarantee that data is available every time it is accessed, but provides the possibility of short-term access acceleration.
Database Frontend
Memcached can be used as a high-performance in-memory cache between the client and the persistent database in the system to reduce the number of accesses to the slower databases and reduce the load on the backend systems. In this case, Memcached is basically equal to a replica of a database. When reading data from a database, first check whether it exists in Memcached. If it does not exist, further access the database. If it exists, return it directly. When writing data to a database, the data is written to Memcached and then directly returned. Then, the data is written to the database during idle time.
For example, in a social APP, there are often functions such as "latest comment" and "hottest comment", which require a large amount of data calculation and are frequently called. If you use relational databases only, you need to perform a large number of read and write operations on the disk frequently. When such operations are performed, most of the data will be used repeatedly. Therefore, keeping them in memory briefly can greatly speed up the whole process. Since the last time the hottest comment was counted based on 1000 comments, 800 of them have been accessed again, and they can be kept in Memcached. The next time the hottest comment is counted, you only need to get 200 more comments from the database, saving 80% of database reads and writes.
Large Data Volume and High-frequency Read/Write Scenarios
Memcached is a pure in-memory database, and its access speed is much faster than other persistence devices. In addition, as a distributed database, Memcached supports scaling out to distribute high-load requests to multiple nodes and provide high-concurrency access mode.
The Object to Be Cached Is Too Large
Due to its storage design, Memcached officially recommends that objects for caching should not exceed 1 MB. This is because Memcached is not intended for storing and processing large media files or streaming huge binary objects.
Need to Traverse Data
Memcached is designed to support only a few commands, including set, put, inc, dec, del, and cas. It does not support traversing data. Memcached needs to complete read and write operations within a constant period of time, but the time required to traverse data increases as the amount of data increases. This process affects the execution speed of other commands and does not meet the design concept.
High Availability and Fault Tolerance
Memcached does not guarantee that the cached data will not be lost. On the contrary, Memcached has the concept of hit rate, implying that expected data loss behavior is acceptable. To ensure disaster recovery, automatic partitioning, and failover, it is best to store data in a persistent database, such as MySQL.
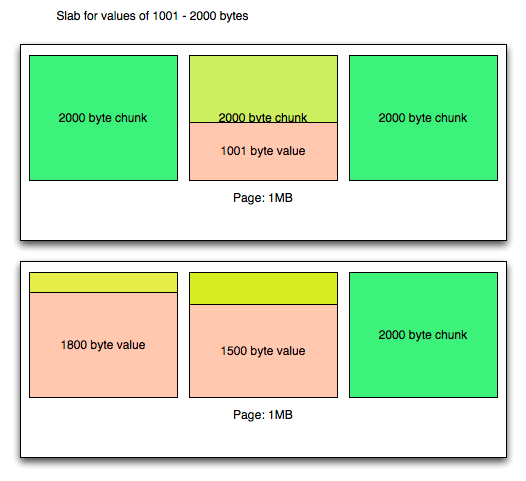
The following figure shows the memory management mode of Memcached:
To prevent memory fragmentation, Memcached uses slabs to manage it. Memcached divides memory into multiple regions called slabs. When storing data, select a slab based on the size of the data. Each slab is only responsible for storing data within a certain range. For example, the slab in the figure only stores values of 1001 - 2000 bytes. By default, the maximum value of the next slab in Memcached is 1.25 times that of the previous slab. You can modify the -f parameter to change the growth ratio.
A slab consists of pages. The fixed size of a page is 1 MB, which can be specified at startup through the -I parameter. If you need to apply for memory, Memcached will divide a new page and allocate it to the required slab. Once a page is allocated, it will not be reclaimed or reallocated until it is restarted.
When storing data, Memcached allocates a fixed-size chunk in the page and inserts the value into the chunk. It should be noted that regardless of the size of the inserted data, the size of the chunk is always fixed. Each piece of data will monopolize a chunk, so there is no such a case where two smaller pieces of data are stored in the same chunk. If the capacity of a chunk is insufficient, you can only store the data in the chunk of the next slab class, resulting in a waste of space.
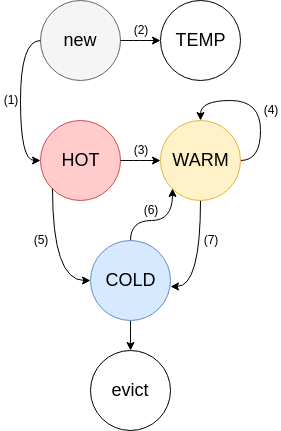
As shown in the figure, Memcached uses an improved LRU mechanism to manage items in memory.
Because items may have strong temporal locality or a very short TTL (time to live), items never move within HOT: once an item reaches the end of the queue, if the item is active (3), it will be moved to WARM; if it is inactive (5), it will be moved to COLD.
It acts as a buffer for scanning workloads, such as a web crawler reading old posts. Items that have never been hit twice cannot enter WARM. WARM items have a greater chance of surviving their TTL while also reducing lock contention. If the item at the end of the queue is active, we move it back to the head (4). Otherwise, we move the inactive items to COLD (7).
The least active items are included. Inactive items will flow from HOT (5) and WARM (7) to COLD. Once the memory is full, items are removed from the tail of COLD. If an item is active, it will be queued for asynchronous movement to WARM (6). When there is a burst or a large number of clicks on COLD, the buffering queue may overflow and the items will remain inactive. In the overload case, the move from COLD becomes a probabilistic event without blocking the worker thread.
As a queue for new items, it has a very short TTL (2) (typically a few seconds). Items in TEMP will not be replaced or flow to other LRUs, saving CPU resources and reducing lock contention. Currently, this feature is not enabled by default.
Crawl simultaneously traverses each crawler item backward through LRU from bottom to top. The crawler checks each item it passes to see if it is out of date and reclaims it if it is.
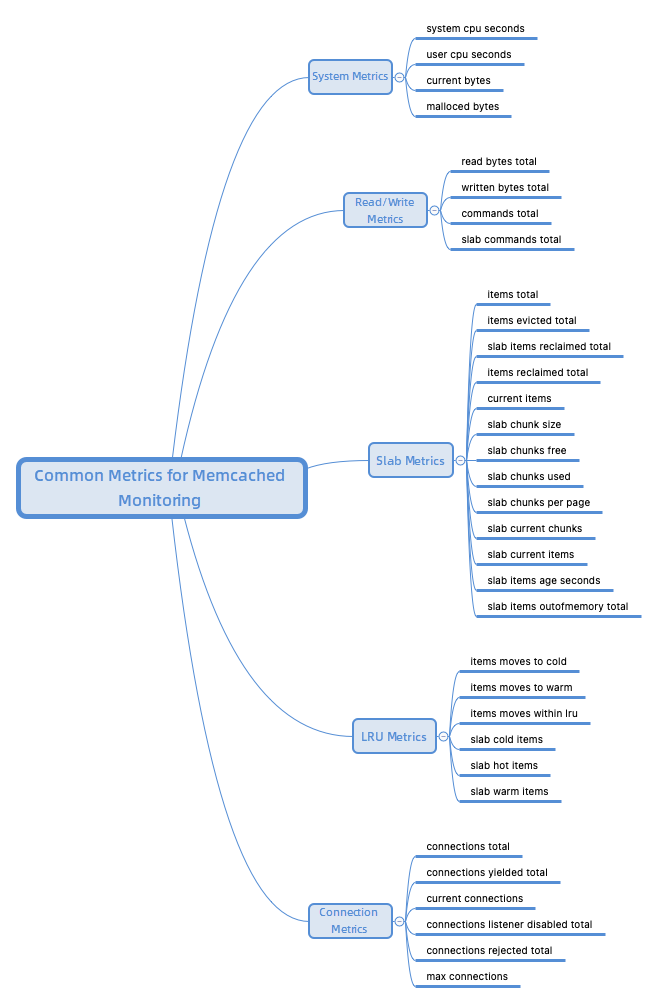
The following section describes some key metrics for Prometheus to monitor open source Memcached.
The startup status is a fundamental metric for monitoring Memcached, indicating whether the Memcached instance is running normally or has been restarted. Although the impact on the entire system's functionality may not be significant when Memcached is down, the absence of a Memcached cache will decrease the system's operational efficiency by at least an order of magnitude.
Checking the Memcached startup duration can help confirm if Memcached has been restarted. Since all data in Memcached is stored in memory, any cached data will be lost during a Memcached restart. Consequently, the hit rate of Memcached will sharply decline, leading to a cache avalanche scenario and placing considerable strain on the underlying database, thereby reducing system efficiency.
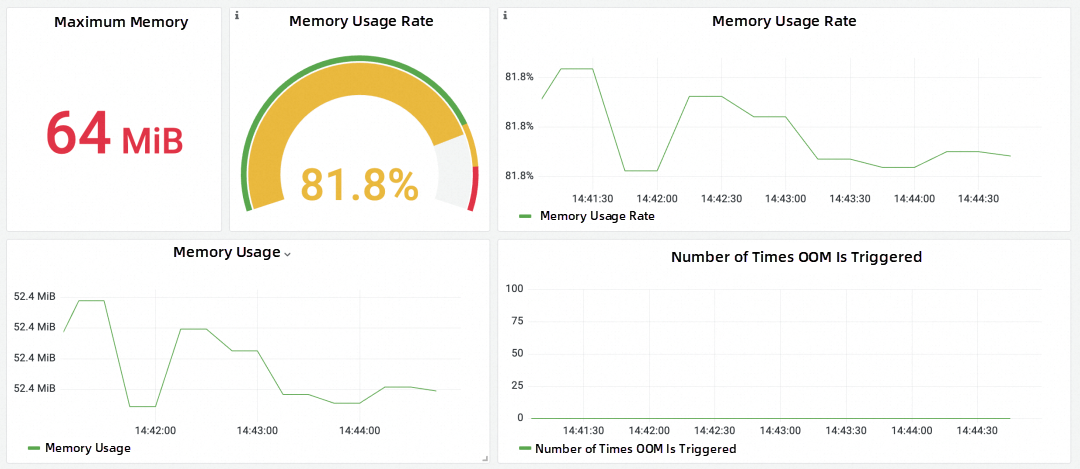
As a high-performance cache, Memcached needs to fully utilize the hardware resources of nodes to provide rapid data storage and query services. If the resource usage of nodes exceeds expectations or reaches the limit, it can result in performance degradation or system breakdown, impacting normal business operations. Since Memcached stores data in memory, it is essential to monitor memory usage. Excessive Memcached memory usage may affect other running tasks on the node. It is important to assess whether the design of key metrics is reasonable and consider increasing hardware resources and other optimization solutions.
The read/write rate is a critical metric for assessing a Memcached cluster's performance. When the read/write latency is high, the system may experience extended response times, high node loads, and system bottlenecks. Read/write metrics provide an overview of Memcached's operational efficiency. In instances of high read/write latency, operations and maintenance personnel should focus on other monitoring data to troubleshoot issues. Slow read/write rates may be attributed to various factors, including low hit rates and node resource shortages. Different troubleshooting and optimization measures should be implemented to enhance performance based on the specific problem.
Memcached supports a variety of commands, such as set, get, delete, CAS, and incr. Monitoring the rate of each command can pinpoint the bottleneck of Memcached. A low command rate affects the overall rate. Adjusting the item storage policy and modifying the access mode can enhance Memcached performance.
Caching can enhance query performance and efficiency while reducing the number of disk reads, thereby improving system response speed and throughput. The hit rate is a critical Memcached metric. A high hit rate indicates that most data accesses are in memory.
In a caching system, scenarios like cache avalanche, cache penetration, and cache breakdown may cause the hit rate to drop within a specific period. Consequently, system operation is severely impacted, as most data access occurs on the disk, placing significant pressure on the underlying database. Monitoring changes in the hit rate is crucial to ensure that Memcached fulfills its role in the system. For instance, if a website's response significantly slows down during a specific period, and it is found that the hit rate is very low during this time, analyzing other metrics, such as the slab metrics below, can help resolve issues of low hit rate.
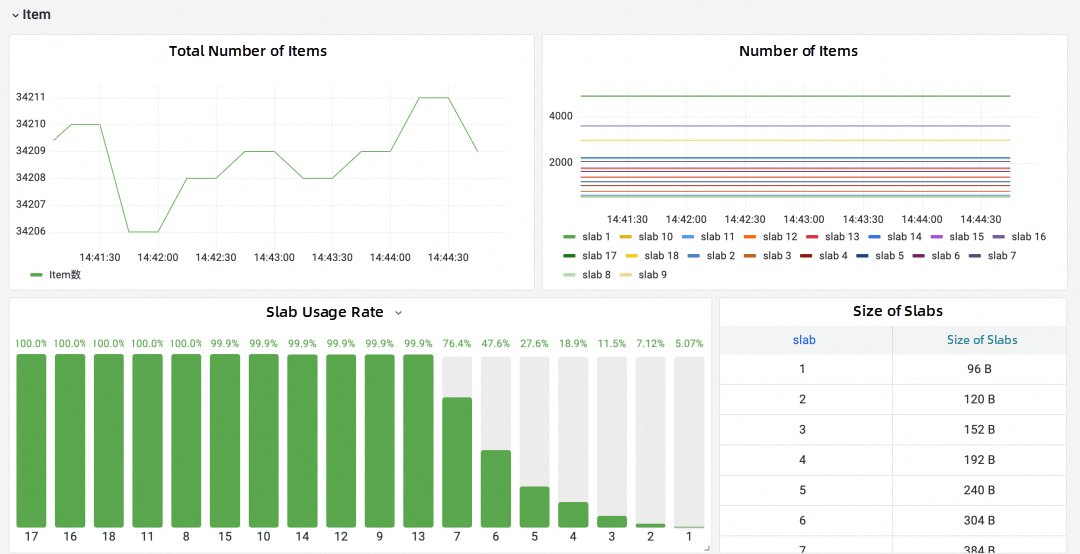
As a key-value database, Memcached refers to a pair of key-values in memory as an item. Understanding the storage of items in Memcached can optimize memory usage efficiency and improve the hit rate.
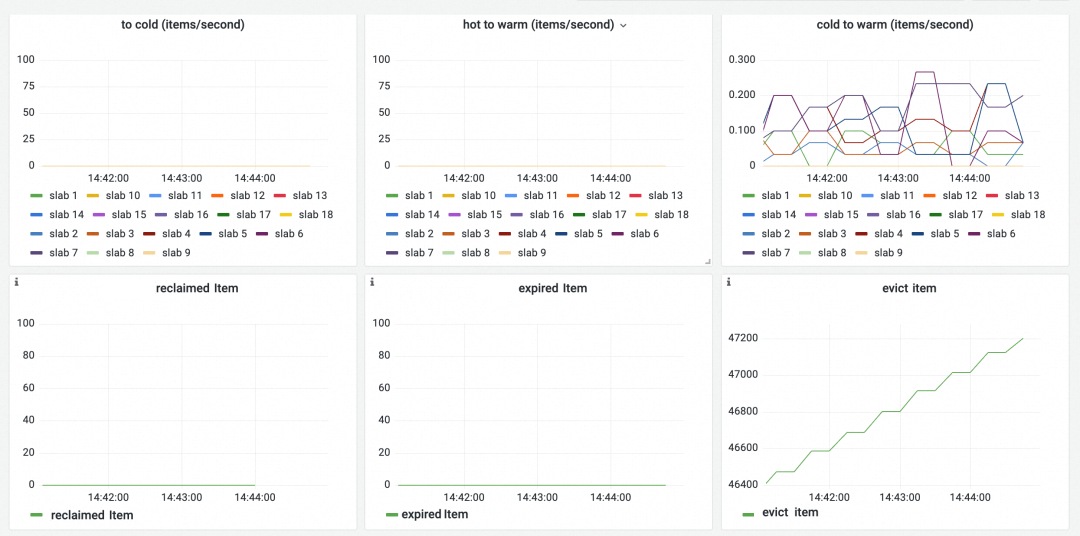
General monitoring of the storage status of items includes observing the total number of items stored in Memcached, the total number of items reclaimed, and the total number of items evicted. By gauging the trend of the total number of items, one can assess the pressure on Memcached storage and the storage mode of Memcached applications.
Eviction and reclamation differ in that when an item needs to be evicted, Memcached looks at some of the items around the LRU tail to look for expired items that can be reclaimed and reuses their memory space instead of evicting the real tail.
According to Memcached's design, the size of items stored in each slab is the same, and each item has an exclusive chunk to improve memory utilization. However, there is room for optimization in this design during use.
Memcached calcification is a common issue. When memory reaches the Memcached limit, the service process executes a series of memory reclamation schemes. However, regardless of the reclamation scheme, there is one major premise for reclamation: only reclaim slabs that are consistent with the data blocks to be written.
For example, if a large number of items with a size of 64 KB were previously stored, and there is now a need to store a large number of items with a size of 128 KB, Memcached can only choose to evict other items with a size of 128 KB to store new data if there is insufficient memory and these 128 KB items are constantly updated. It is found that the original 64 KB item has not been evicted and continues to occupy memory space before it expires, resulting in space wastage and eventually a lower hit rate.
To address calcification, it is essential to understand the distribution metrics of items in each slab. Monitoring the comparison of the number of stored items between slabs can help identify whether some slabs store significantly more items than others. Adjusting the size of each slab and reducing the growth factor can ensure even distribution of items in each slab, effectively alleviating the problem of calcification and improving memory usage efficiency.
In Memcached's LRU, each region serves a distinct function. The HOT region stores the latest stored items, the WARM region stores the hot items, and the COLD region stores items that are about to expire. Understanding the number of items in each region offers deeper insights into the state of Memcached and provides tuning solutions. Here are some examples:
If there are fewer items in the HOT region and more items in other regions, it indicates that fewer new items are created, data in Memcached is infrequently updated, and the system experiences more read-intensive data. Conversely, when a large number of items are in the HOT region, it indicates an increase in newly created items. In such cases, data in the system is write-intensive.
If there are more items in the WARM region than in the COLD region, it suggests that items are frequently hit, an ideal situation. Conversely, a low hit rate suggests that optimization is needed.
Whether an item is hit or not influences the LRU region in which it is located. By monitoring the movement of items in the LRU region, we can understand data access status. Here are some examples:
An increase in the number of items moved from the COLD region to the WARM region indicates that items about to expire are being hit. If this number is too high, it suggests that some less popular data has suddenly become hot data, necessitating attention to prevent a decrease in the hit rate.
A large number of items moving from the HOT region to the COLD region indicates that many items are no longer accessed after being inserted. These data may not need to be cached, and direct storage in the underlying database can alleviate memory pressure.
A large number of items in the WARM region suggests that a significant number of items are inserted and then accessed. This scenario is ideal, indicating that the data stored in Memcached is frequently accessed, resulting in a high hit rate.
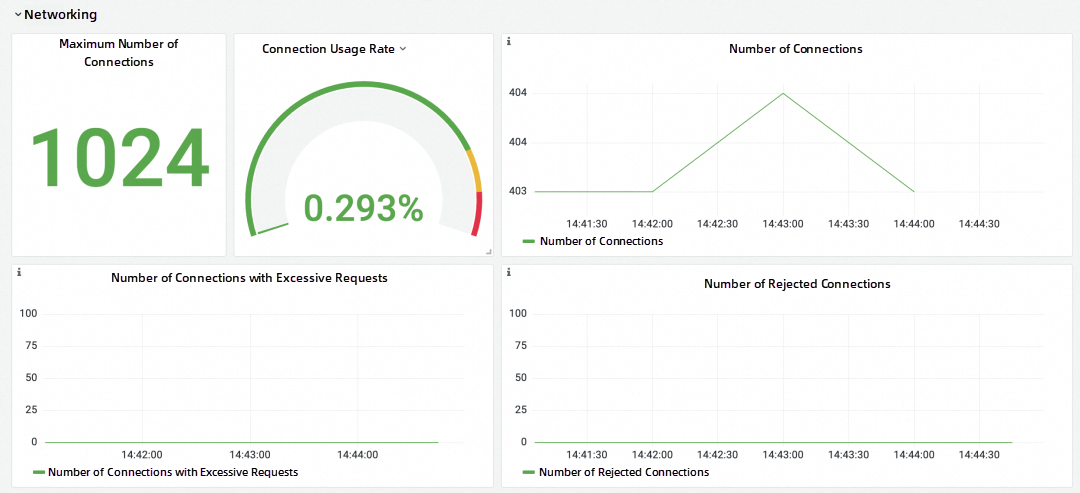
Due to its event-based architecture, Memcached does not slow down even with a large number of clients. It remains functional even with hundreds of thousands of connected clients. Monitoring the current number of user connections provides an overview of the status of Memcached work.
Memcached limits the number of requests that a single client connection can make for each event, determined by the -R parameter when Memcached is enabled. When a client exceeds this value, the server prioritizes other clients before continuing with the original client request. It is crucial to monitor if this situation occurs to ensure normal client use of Memcached. By default, the maximum number of Memcached connections is 1024. Operations and maintenance personnel need to monitor whether the number of connections exceeds this limit to ensure normal functionality.
| Metric | Description |
| memcached_process_system_cpu_seconds_total | The system CPU usage time of the process |
| memcached_process_user_cpu_seconds_total | The user CPU usage time of the process |
| memcached_limit_bytes | Storage capacity |
| memcached_time_seconds | Current time |
| memcached_up | Enabled or not |
| memcached_uptime_seconds | Uptime |
| memcached_version | Versions |
| Metric | Description |
| memcached_read_bytes_total | The total size of data read in the server |
| memcached_written_bytes_total | The total size of data sent in the server |
| memcached_commands_total | The total number of all requests by command in the server |
| memcached_slab_commands_total | The total number of all requests by command in the slab class |
| Metric | Description |
| memcached_items_total | The total number of stored items |
| memcached_items_evicted_total | The number of evicted items |
| memcached_slab_items_reclaimed_total | The number of expired items, sorted by slabs |
| memcached_items_reclaimed_total | The total number of expired items |
| memcached_current_items | The number of items in the current instance |
| memcached_malloced_bytes | The size of slab pages |
| memcached_slab_chunk_size_bytes | The size of chunks |
| memcached_slab_chunks_free | The number of free chunks |
| memcached_slab_chunks_used | The number of used chunks |
| memcached_slab_chunks_free_end | The number of free chunks in the latest page |
| memcached_slab_chunks_per_page | The number of chunks in the page |
| memcached_slab_current_chunks | The number of chunks in the slab class |
| memcached_slab_current_items | The number of items in the slab class |
| memcached_slab_current_pages | The number of pages in the slab class |
| memcached_slab_items_age_seconds | The seconds since the last item in the slab class was accessed |
| memcached_current_bytes | The actual size of items |
| memcached_slab_items_outofmemory_total | The number of items that trigger out of memory error |
| memcached_slab_mem_requested_bytes | The storage size of items in a slab |
| Metric | Description |
| memcached_lru_crawler_enabled | Whether the LRU crawler is enabled |
| memcached_lru_crawler_hot_max_factor | Set the idle period for HOT LRU to WARM LRU conversion |
| memcached_lru_crawler_warm_max_factor | Set the idle period for WARM LRU to WARM LRU conversion |
| memcached_lru_crawler_hot_percent | The percentage of slab left for the HOT LRU |
| memcached_lru_crawler_warm_percent | The percentage of slab left for the WARM LRU |
| memcached_lru_crawler_items_checked_total | The number of items checked by the LRU crawler |
| memcached_lru_crawler_maintainer_thread | Split LRU mode and backend threads |
| memcached_lru_crawler_moves_to_cold_total | The number of items that move to the COLD LRU |
| memcached_lru_crawler_moves_to_warm_total | The number of items that move to the WARM LRU |
| memcached_slab_items_moves_to_cold | The number of items that move to the COLD LRU, sorted by slab |
| memcached_slab_items_moves_to_warm | The number of items that move to the WARM LRU, sorted by slab |
| memcached_lru_crawler_moves_within_lru_total | The number of items that are processed by the crawler and disrupted in the HOT and WARM LRUs |
| memcached_slab_items_moves_within_lru | The number of items exchanged when hit between the HOT and WARM LRUs |
| memcached_lru_crawler_reclaimed_total | The number of items in LRU reclaimed by the LRU crawler |
| memcached_slab_items_crawler_reclaimed_total | The number of items in the slab reclaimed by the LRU crawler |
| memcached_lru_crawler_sleep | LRU crawler interval |
| memcached_lru_crawler_starts_total | LRU uptime |
| memcached_lru_crawler_to_crawl | The maximum number of items to be crawled per slab |
| memcached_slab_cold_items | The number of items in the COLD LRU |
| memcached_slab_hot_items | The number of items in the HOT LRU |
| memcached_slab_hot_age_seconds | The age of the oldest item in the HOT LRU |
| memcached_slab_cold_age_seconds | The age of the oldest item in the COLD LRU |
| memcached_slab_warm_age_seconds | The age of the oldest item in the WARM LRU |
| memcached_slab_items_evicted_nonzero_total | The total number of times that an item with an explicitly set expiration time must be deleted from the LRU before it expires |
| memcached_slab_items_evicted_total | The total number of evicted and unfetched items |
| memcached_slab_items_evicted_unfetched_total | The total number of expired and unfetched items |
| memcached_slab_items_tailrepairs_total | The total number of times an item with a specific ID needs to be fetched |
| memcached_slab_lru_hits_total | The total number of LRU hits |
| memcached_slab_items_evicted_time_seconds | The seconds since the last item in the slab was accessed |
| memcached_slab_warm_items | The number of items in the WARM LRU, sorted by slabs |
| Metric | Description |
| memcached_connections_total | The total number of accepted connections |
| memcached_connections_yielded_total | The total number of connections running because the Memcached -R limit was triggered. |
| memcached_current_connections | Open connections |
| memcached_connections_listener_disabled_total | The total number of connections that triggered the limit |
| memcached_connections_rejected_total | The number of rejected connections and the Memcached -c limit is triggered. |
| memcached_max_connections | Limit the size of connections on the client |
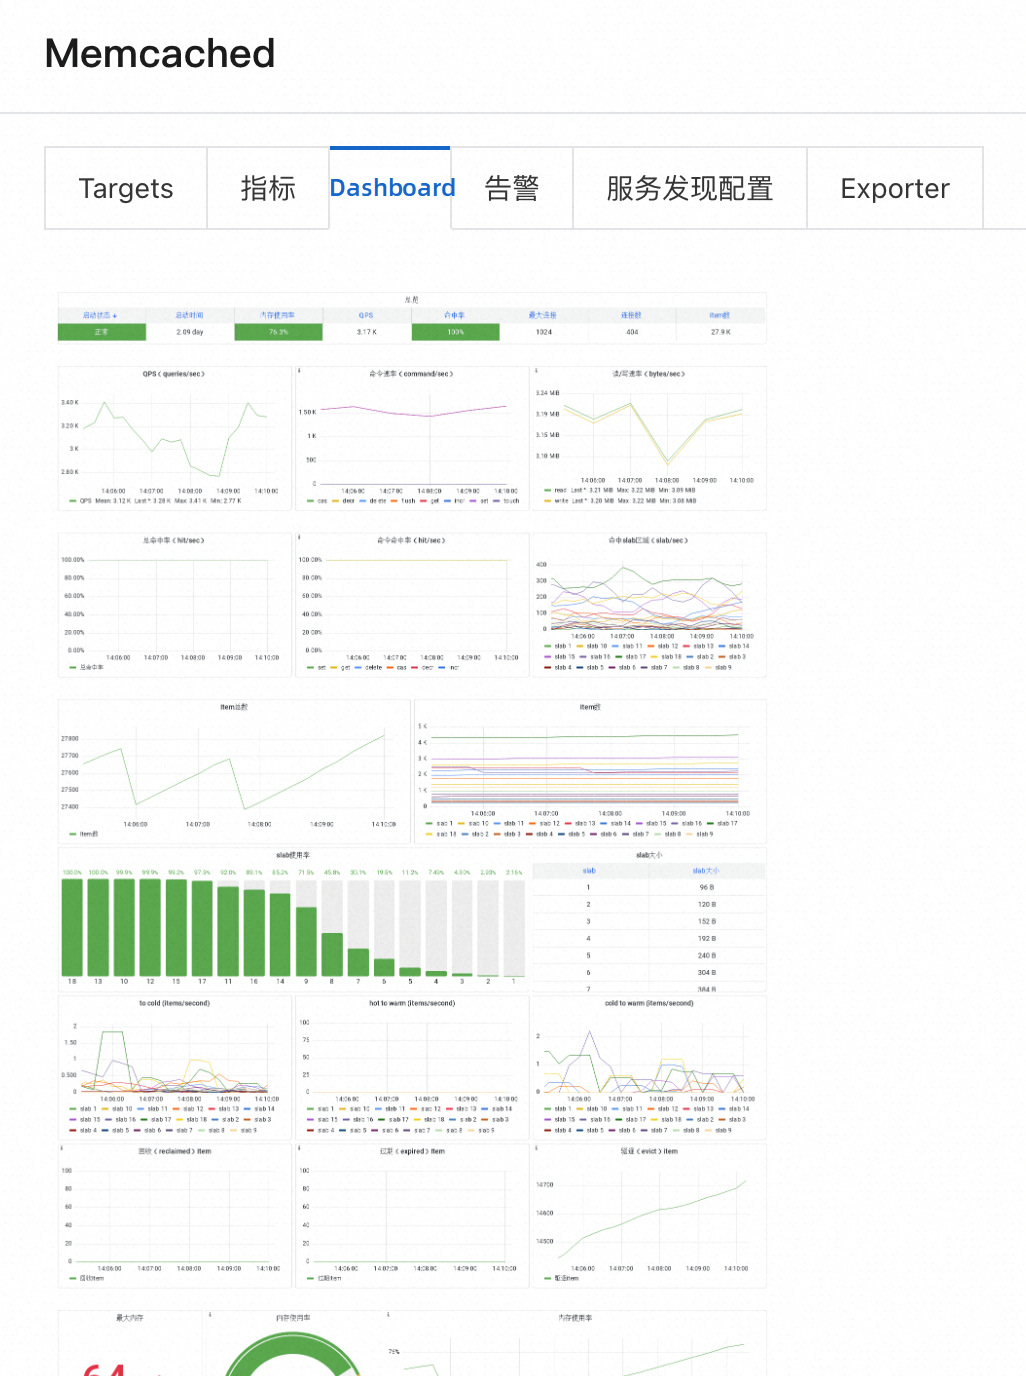
The Memcached overview dashboard is provided by default.
In this panel, you can view the metrics that need to be focused on when Memcached is running. When checking the Memcached status, first check whether there is any abnormal status in the overview and then check the specific metrics.

In the following panels, you can view the running speed of Memcached. There are three categories:

The hit rate is a metric that needs to be focused on. You can learn more about the hit status of Memcached through the following three panels.

Item indicates the storage status of Memcached. Use the following panels to check the memory usage status of Memcached.
Memory is the key hardware resource of Memcached. You can use this panel to understand the memory usage of Memcached:
Although Memcached provides high concurrency and lossless support, network resources are not infinite and you need to keep an eye on the following panels:
Handle is a system metric that involves network connections and other resources.

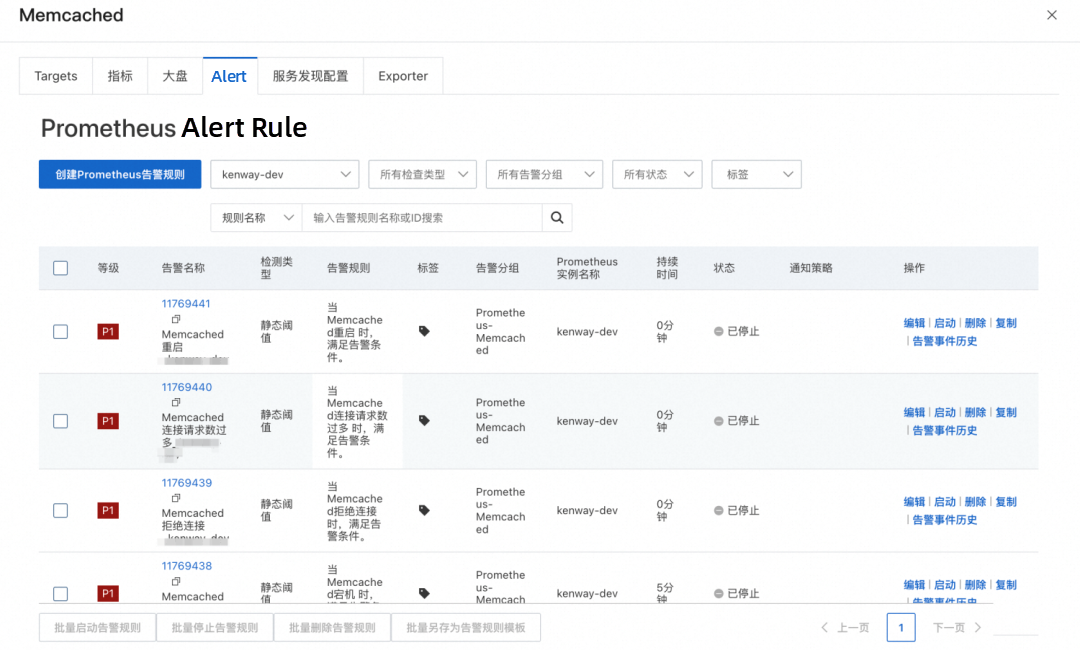
When configuring alert rules for Memcached, we recommend configuring alert rules based on the collected metrics above from the following aspects: operation status, resource usage, and connection usage. Generally, we generate alert rules that affect the normal use of Memcached by default, which has a higher priority. Business-related alerts, such as the read /write rate, are customized by users. The following are some recommended alert rules.
Memcached not working is an alert rule with a threshold between 0 and 1. Generally, Memcached services deployed in Alibaba Cloud environments such as ACK are highly available. When one Memcached instance is stopped, other instances continue to work. It is possible that a program error occurs and the Memcached instance cannot be redeployed. This is a very serious situation. By default, we set an alert to be reported if Memcached cannot recover within 5 minutes.
For other services, restarting an instance is not a problem. However, Memcached is a typical stateful service, and its main data is stored in memory. When the instance is restarted, all cached data is lost. In this case, the hit rate decreases, resulting in poor system performance. Therefore, we recommend monitoring the restart alerts of Memcached to find the corresponding problems when the restart occurs to prevent the situation from happening again.
If the memory usage is too high, Memcached cannot run properly. We set a danger value and an alert value when the memory usage is 80% and 90%, respectively. When the memory usage is 80%, the node runs under high load, but the normal use is not affected. When the memory usage is 90% for a long period of time, an alert is sent to indicate that O&M resources are in short supply. You should handle this problem as soon as possible.
When the memory usage exceeds the total node memory, an out-of-memory (OOM) condition may cause a full cache refresh of data, interrupting your applications and business. When the node memory usage metric is close to 100%, the instance is more likely to experience an OOM condition. We have set an alert with a threshold between 0 and 1. If an OOM occurs, an alert will be generated immediately.
In general, an increase in the number of connections does not affect the running of Memcached unless the maximum number of connections is exceeded. In this case, the client cannot obtain the Memcached service normally. We have set an alert with a threshold between 0 and 1. Once a connection is rejected, an alert is immediately sent to ensure the normal operation of the client.
We set an alert with a threshold between 0 and 1. Once the number of connection requests is excessive, an alert is immediately sent to ensure the normal operation of the client. In such a case, Memcached temporarily does not accept the connection command.
There are various causes of the low hit rate, and we need to troubleshoot them based on multiple metrics.
When self-managed Prometheus monitors Memcached, the following typical problems are encountered due to the typical deployment of Memcached on ECS:

| Parameter | Description |
| Exporter Name | The unique name of the Memcached exporter. The name must meet the following requirements: • It can contain only lowercase letters, digits, and hyphens (-), and cannot start or end with a hyphen (-). • It must be unique. |
| Memcached address | The endpoint of the Memcached instance. Format: ip:port. |
The installed exporters are displayed in the Installed section of the Integration Center page. Click the component. In the panel that appears, you can view information such as targets, metrics, dashboards, alerts, service discovery configurations, and exporters.
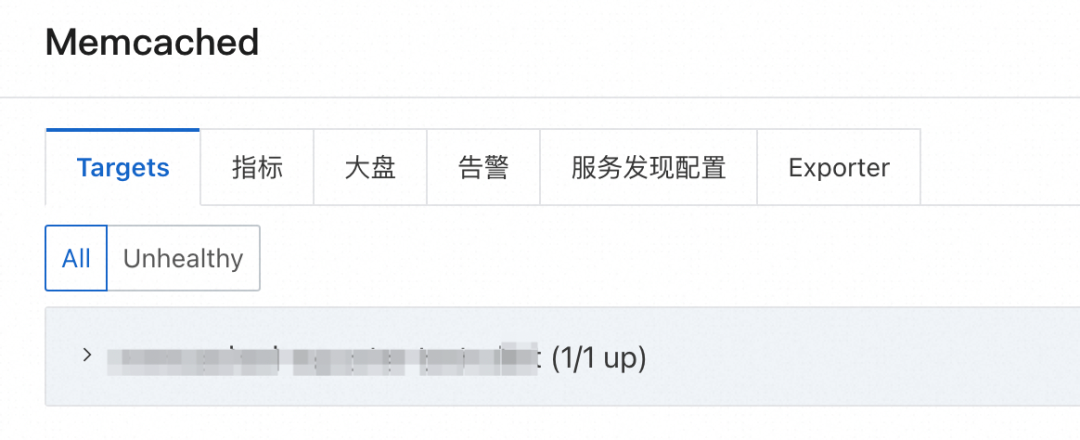
The following figure shows the key alert metrics provided by Managed Service for Prometheus.
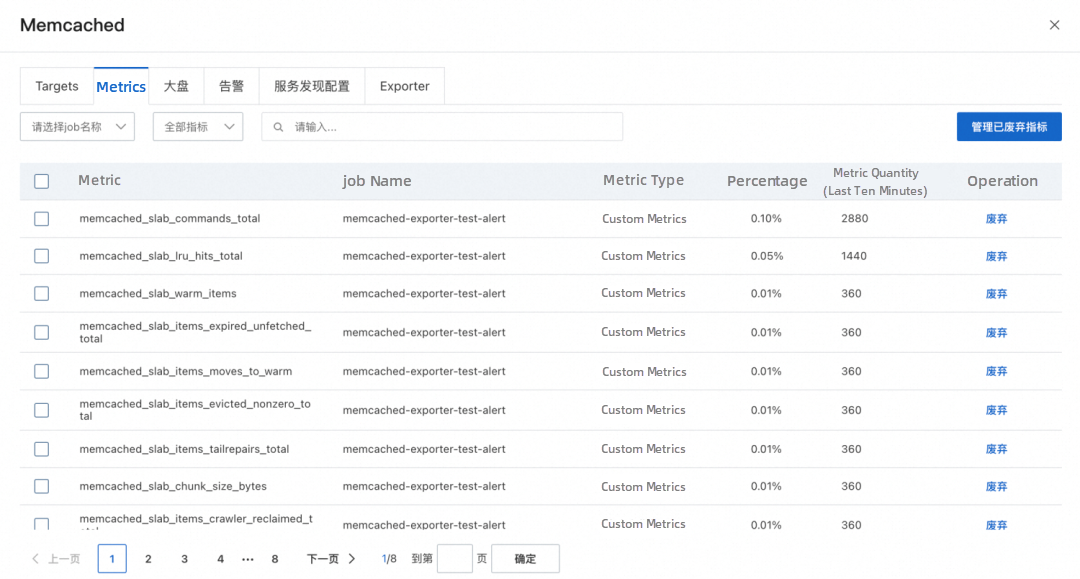
On the Dashboards tab, you can click a dashboard thumbnail to go to the Grafana console and view the details of the dashboard.
You can click the Alerts tab to view the Prometheus alerts of the Memcached instance. You can also create alert rules based on your business requirements. For more information, see Create an alert rule for a Prometheus instance [2].
| Self-managed Prometheus systems | Alibaba Cloud Managed Service for Prometheus | |
| Deployment costs and O&M costs | Prometheus, Grafana, and AlertManager are deployed in multiple VPCs, resulting in high O&M costs. | Prometheus, Grafana, and the alert center are integrated, fully managed, O&M-free, and out-of-the-box. |
| Service discovery | Service discovery should be configured by yourself, which is inconvenient to use and has high maintenance costs. | A graphical interface greatly simplifies the configuration and maintenance complexity of service discovery. |
| Grafana dashboard | The open source dashboard is too simple to obtain effective information. | The professional Memcached dashboard template allows you to quickly and accurately understand the running status of Memcached and troubleshoot the causes of problems. |
| Alert rules | The default alert is missing and needs to be configured by the user. | It provides professional and flexible alert metric templates based on the monitoring time. |
[1] https://memcached.org/about
[2] https://memcached.org/blog/modern-lru/
[3] https://www.scaler.com/topics/aws-memcached/
[1] ARMS console
https://arms-ap-southeast-1.console.aliyun.com/#/tracing/list/ap-southeast-1
[2] Create an alert rule for a Prometheus instance
https://www.alibabacloud.com/help/en/arms/prometheus-monitoring/create-alert-rules-for-prometheus-instances#task-2121615
Model Service Mesh: Model Service Management in Cloud-native Scenario

212 posts | 13 followers
FollowAlibaba Cloud Native - March 6, 2024
Alibaba Cloud Native - September 8, 2023
Alibaba Cloud Native - August 14, 2024
Alibaba Cloud Native - November 6, 2024
Alibaba Cloud Native - November 16, 2023
Alibaba Cloud Native Community - February 2, 2026

212 posts | 13 followers
Follow Best Practices
Follow our step-by-step best practices guides to build your own business case.
Learn More Managed Service for Prometheus
Multi-source metrics are aggregated to monitor the status of your business and services in real time.
Learn MoreMore Posts by Alibaba Cloud Native