GanosBase is a next-generation cloud-native spatial intelligence engine jointly developed by Alibaba Cloud Database Division and Alibaba Cloud Feitian Database and Storage Laboratory. It integrates spatiotemporal data processing capabilities into core products such as the cloud-native relational database PolarDB, the cloud-native multi-model database Lindorm, the cloud-native data warehouse AnalyticDB, and the cloud database ApsaraDB RDS for PostgreSQL. GanosBase currently features ten core engines: Geometry, Raster, Trajectory, Surface Mesh, Volume Mesh, 3D Real Scene, Point Cloud, Path, Geometry Grid, and Fast Display. These engines provide integrated capabilities for the storage, query, analysis, and service of new multi-modal, multi-typed spatiotemporal data in databases.
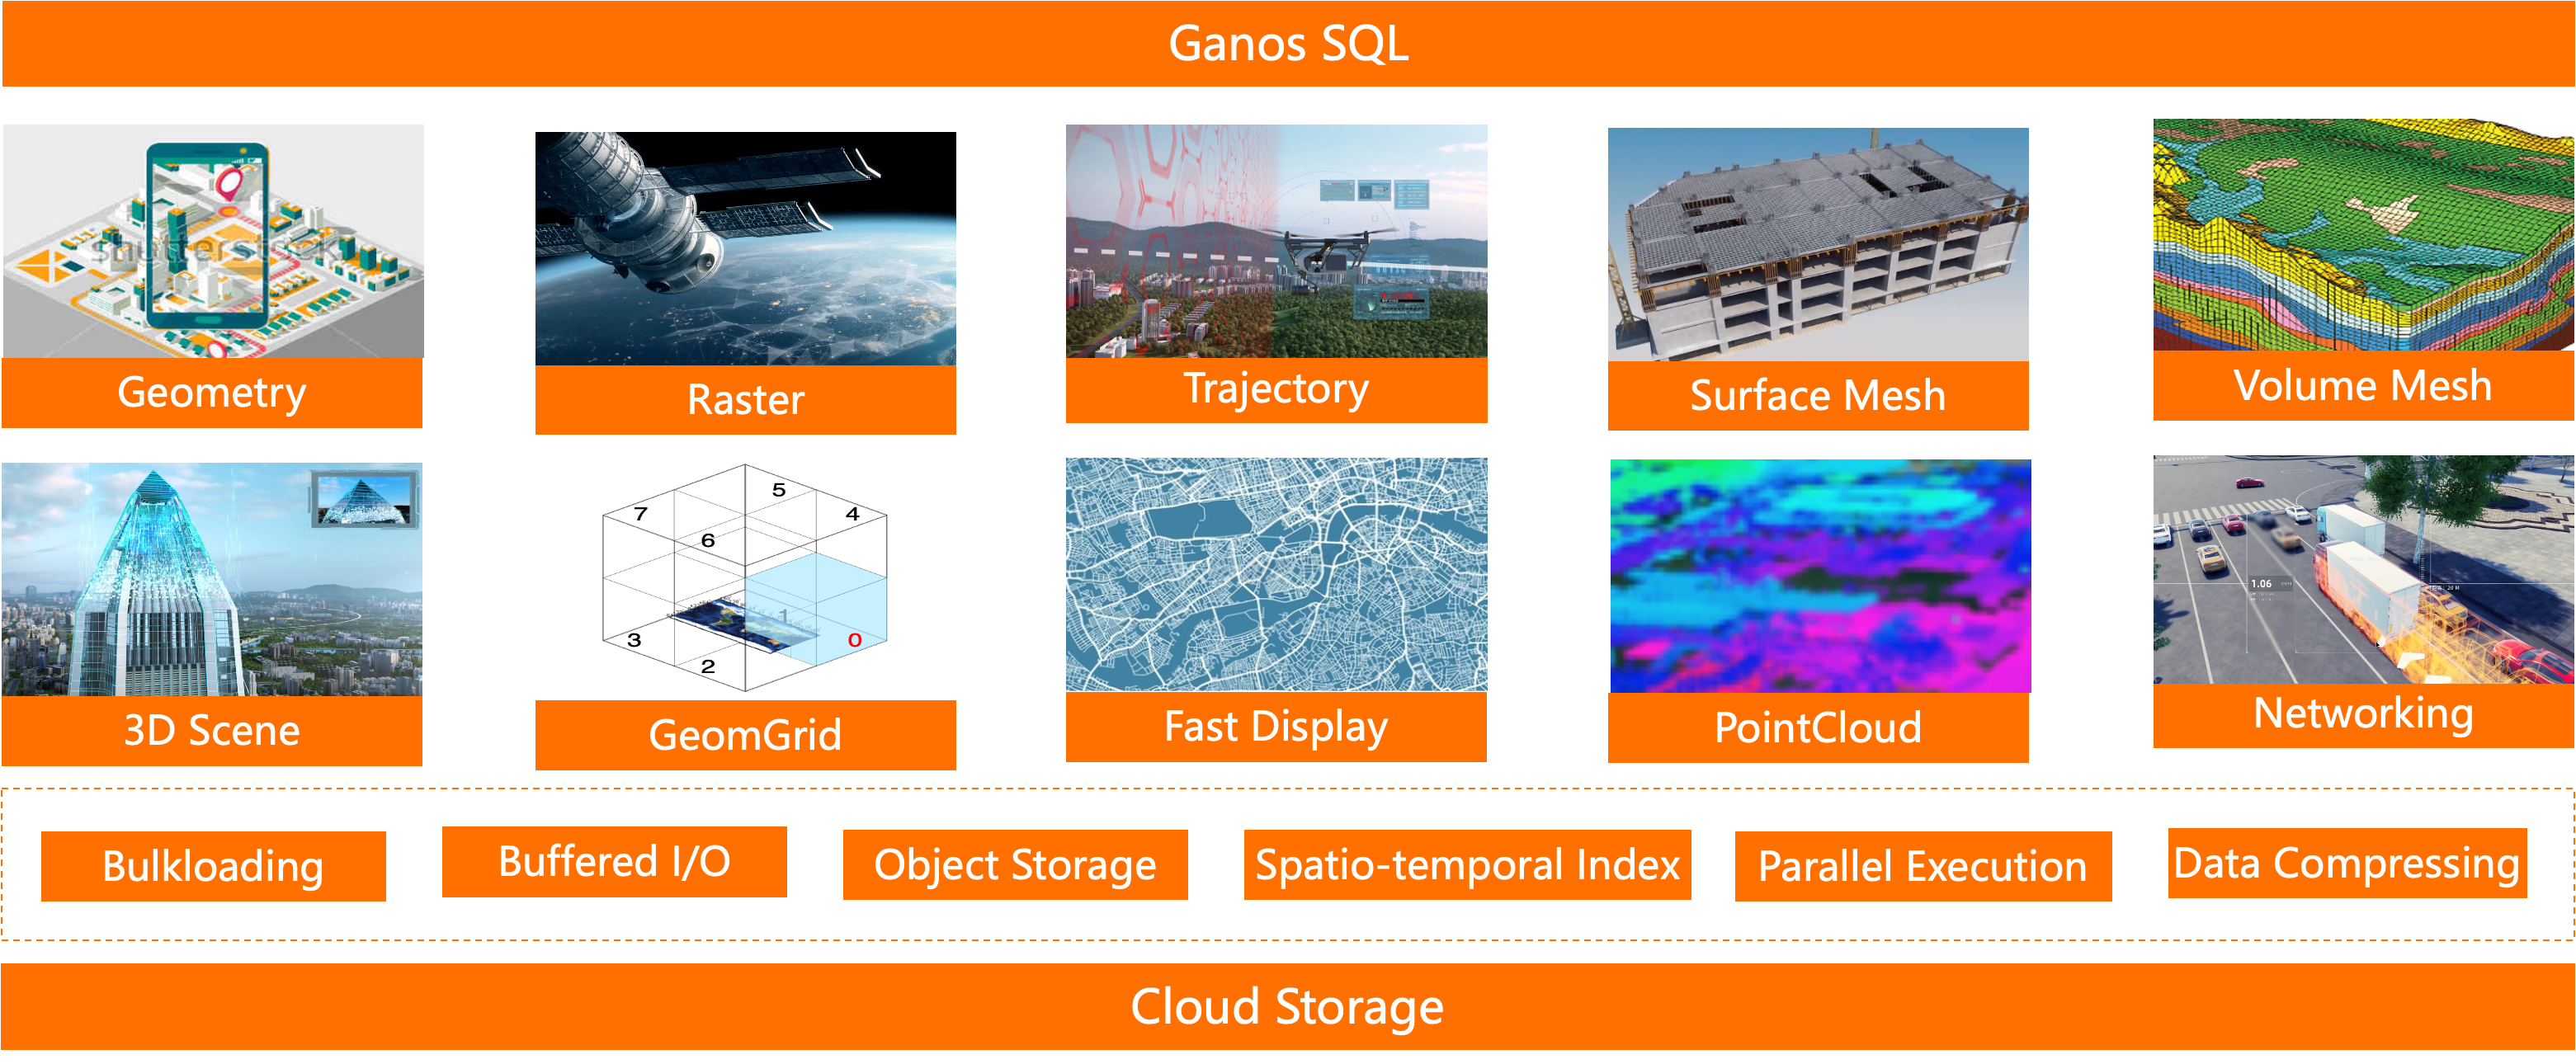
The geographical grid engine capabilities introduced in this article are built and output based on Alibaba Cloud's cloud-native relational database PolarDB.
The geographical grid is a collection of polygon grid units that represent the Earth's surface and can be used to represent the location information of features in geographical space, integrating with other types of spatiotemporal data. Geographical grid computing generally proceeds from coarse to fine, progressively subdividing the Earth's surface, approximating the Earth's surface using polygon grids of a certain size. The goal is to integrate the positioning and description of geographical features within the grid units' error range. Each grid unit is encoded, with a one-to-one correspondence between grids and codes. Three-dimensional geographical grids consider not only latitude and longitude but also include height in the subdivision and encoding range.
GanosBase's geographical grid engine currently covers two types of geographical grids: GeoSOT and H3. GeoSOT is a set of geospatial subdivision theories proposed by China, developed into a discrete, multi-scale regional location identification system. H3 is a two-dimensional geographical grid covering the Earth's surface developed by Uber, using a global, unified, multi-layered hexagonal grid system to represent the Earth's surface. H3's unique design lies in its hexagonal structure, which, compared to traditional square or triangular grids, offers more uniform distribution, fixed neighbor relationships, and directionlessness. This makes it more precise and efficient in organizing and querying geospatial data in fields such as spatial data analysis, path planning, geocoding, and geofencing.
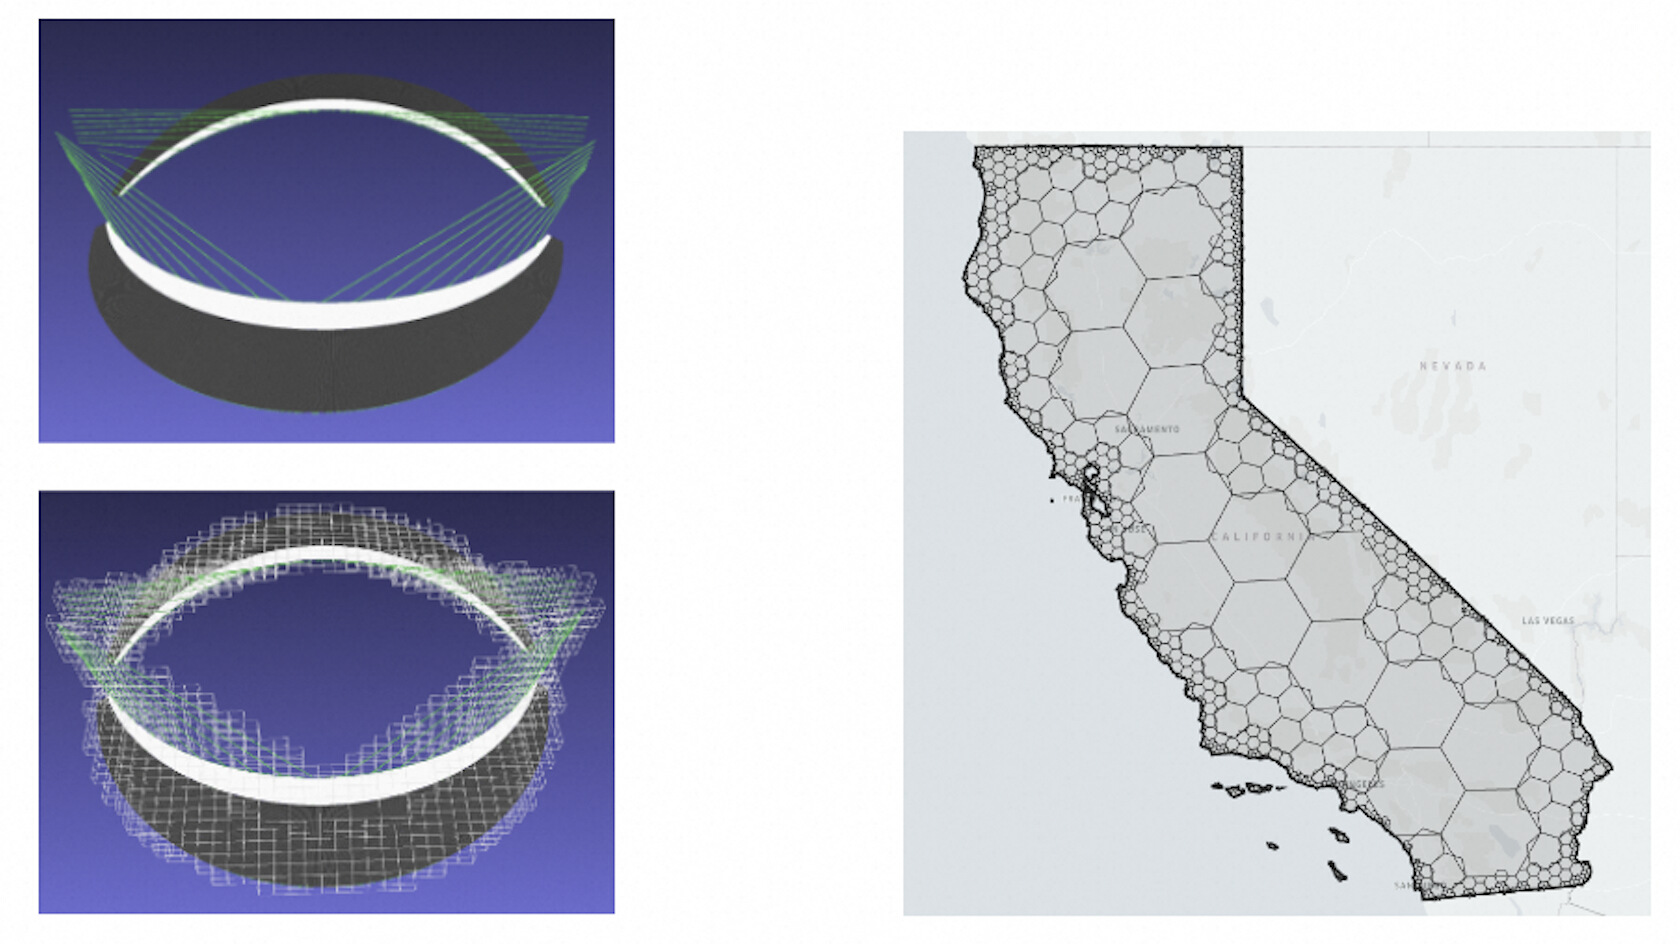
Using GanosBase's geographical grid functions, different spatial ranges can be converted into grid codes, and the spatial range, hierarchy, and parent-child grids of grid codes can be determined. GanosBase supports degenerated grid computing (as shown in the figure below, the left one is GEOSOT grid and the right one is H3 grid), fully utilizing the hierarchical relationship of grids to express the spatial range with a more streamlined grid combination. Additionally, GanosBase's self-developed geographical grid index can be used for efficient grid code querying and accelerating aggregate calculations.
H3 geographical grid technology is widely used in many business scenarios, including:
● Logistics and Travel Services: Developing route planning, area coverage analysis, delivery range delineation, hotspot area discovery, etc., based on the geographical grid;
● Data Analysis: Conducting population density analysis, mobile user behavior analysis, geographical market segmentation, and other big data analysis fields based on the geographical grid;
● Internet of Things (IoT): Analyzing the spatial distribution of monitoring data based on geographical grids in scenarios requiring real-time monitoring such as smart cities, environmental monitoring, and asset tracking;
● Social Networks: Building applications for location-based services (LBS), friend location sharing, event notifications, etc., in social scenarios based on geographical grids;
● Emergency Response and Public Services: Conducting disaster distribution analysis, disaster warning heatmaps, emergency resource distribution, and emergency rescue area delineation based on geographical grids;
In summary, H3 grid technology provides enterprises and developers with a powerful tool to better manage and utilize geospatial data, improving the efficiency and accuracy of location-related decision-making.
GanosBase H3 geographical grid includes various capabilities such as grid input/output, parent-child grid relationship judgment, grid path analysis, and grid querying. The geographical grid also supports conversion to the GanosBase Geometry type for spatial analysis with other vector data. Notably, GanosBase H3 geographical grid also supports degradation, using a more streamlined grid combination to express spatial ranges, thereby reducing the database storage costs incurred by encoding.
For detailed functionalities of GanosBase H3 geographical grid, refer to the GanosBase Geographical Grid User Manual.
Below, we use real-world scenario data to introduce how to use GanosBase H3 to perform functions such as spatial point data storage, encoding, querying, and final display. For testing, we chose Uber's 2023 New York Taxi Pickup Dataset FOIL. FOIL data records the location data of all taxi pickups and drop-offs in the New York area. For more details, refer to https://www.kaggle.com/datasets/fivethirtyeight/uber-pickups-in-new-york-city

Before using GanosBase H3, you need to create the GeomGrid extension with the following SQL:
CREATE EXTENSION Ganos_GeomGrid CASCADE;GeomGrid provides the h3grid field type to represent H3 codes. The following SQL statement creates a data table FOIL2013 with the h3grid type, where the field h3_lev13 represents the 13th level H3 code. Different levels of H3 grids have different resolutions, and users can define them flexibly according to their specific business needs. For the spatial resolution corresponding to each level of H3, please refer to: https://h3geo.org/docs/core-library/restable
-- Create a table to store foil point data, h3_lev13 represents the 13th level code

CREATE TABLE FOIL2013 (
  id text,
  lon float,
  lat float,
  h3_lev13 h3grid);
The FOIL file is stored in CSV file format. Users can programmatically extract relevant information from the CSV and store it in the database via SQL or use the FDW method for import. Here, we use the GanosBase FDW module to achieve fast data import via the FDW method.
First, we upload the target file to a designated OSS directory, for example, the file path here is:
● endpoint: oss-cn-hangzhou-internal.aliyuncs.com
● bucket: dla-ganos-hz
● path: FOIL/trip_data_1.csv
First, create the GanosBase FDW extension
CREATE EXTENSION ganos_fdw CASCADE;Next, create a csvserver to manage CSV files. The ak_id and ak_secret are the user's OSS connection AK's id and secret information, and format 'CSV' indicates that the data format is CSV.
CREATE SERVER csvserver
  FOREIGN DATA WRAPPER gan

os_fdw
  OPTIONS (
    datasource 'OSS://<ak_id>@oss-cn-hangzhou-internal.aliyuncs.com/dla-ganos-hz/FOIL/trip_data_1.csv',
    format 'CSV' );

CREATE USER MAPPING FOR CURRENT_USER SERVER csvserver OPTIONS (user '<ak_id>', password '<ak_secret>');
After successfully creating the FDW service, we can map the CSV on OSS to the database as a regular table in the form of an external table, with the detailed SQL statement below. Here, we only select the medallion, pickup_longitude, and pickup_latitude columns, and the mapped external table is named trip_data_1:
CREATE FOREIGN TABLE trip_data_1 (
  medallion varchar,
  pickup_longitude varchar,
  pickup_latitude varchar)
  SERVER csvserver
  OPTIONS ( layer 'trip_data_1' );
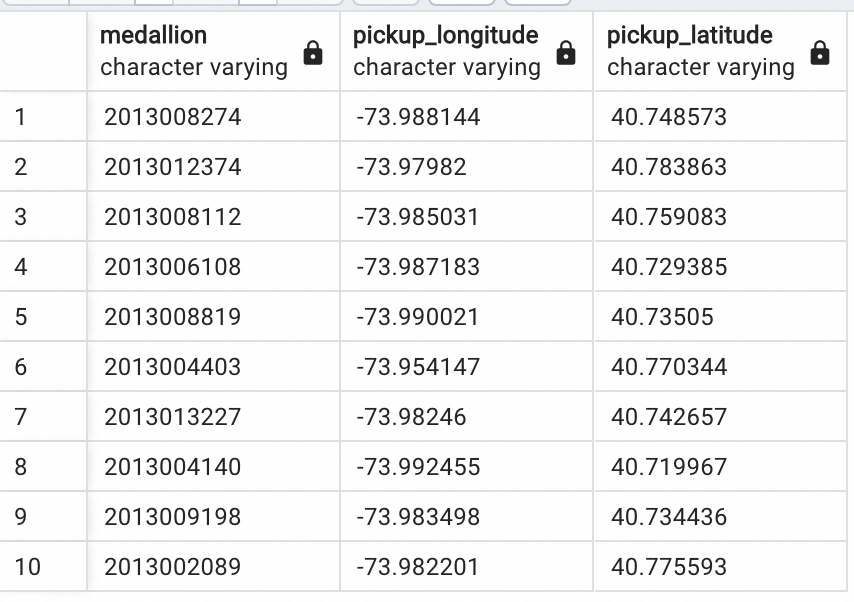
Query the external table trip_data_1:
SELECT * FROM trip_data_1;The result is as follows:
Then import the external table data into the FOIL2013 table we created earlier:
INSERT INTO FOIL2013
SELECT medallion as id ,cast (pickup_longitude as double precision) as lon, cast(pickup_latitude as double precision) as lat FROM trip_data_1;
Query FOIL2013, and you can see that the information from the CSV has been successfully imported into the FOIL2013 table. We can then encode the data based on location information such as latitude and longitude.
SELECT * FROM FOIL2013;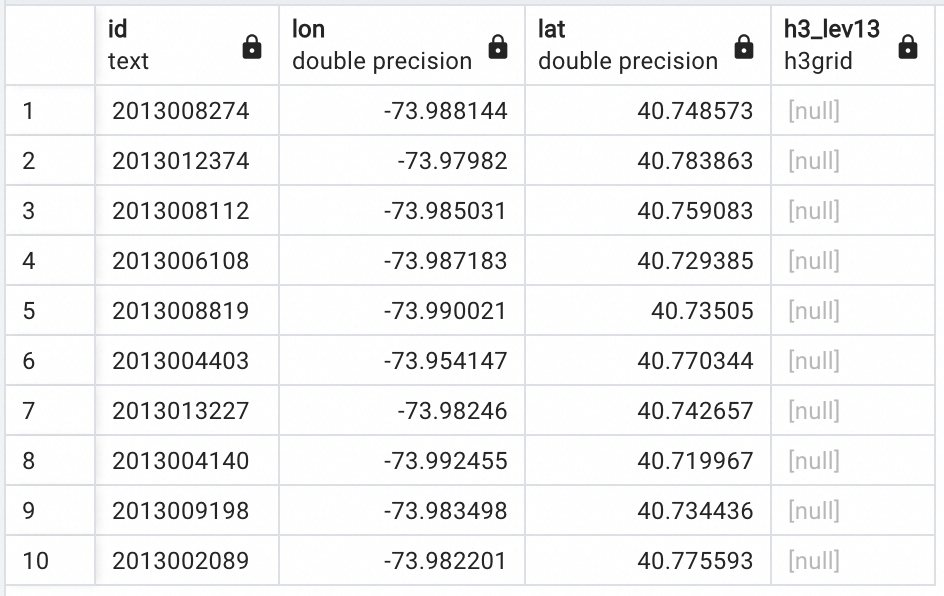
After importing data, we can encode point data. GanosBase H3 provides multiple encoding methods, such as specifying latitude and longitude, standard H3 strings, integer-type H3 encoding, binary-type H3 encoding, and converting directly from Point type to H3. For detailed content, please refer to the documents: ST_H3FromText, ST_H3FromInt, ST_AsH3Grid, ST_H3FromLatLng, etc.
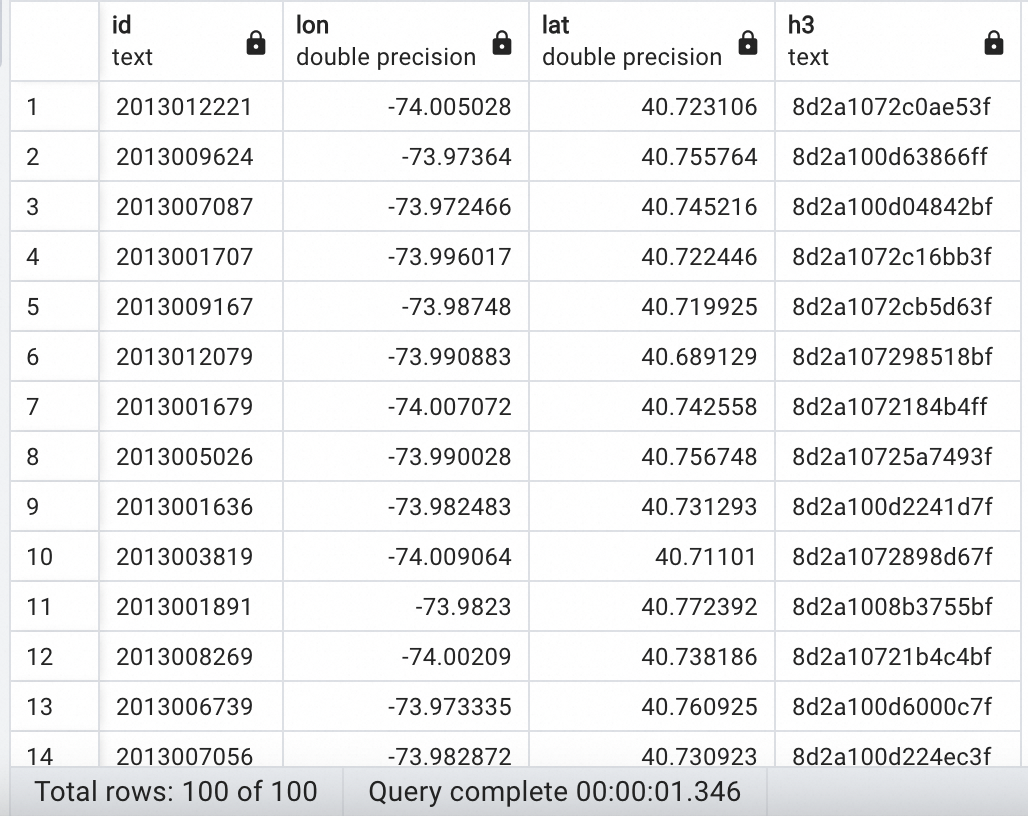
Here we use the ST_H3FromLatLng function, where users can directly obtain H3 encoding by specifying latitude, longitude, and target level. For example, the following SQL statement generates the 13th level H3 encoding from the lat and lon fields in the FOIL table and stores it in the h3_lev13 column, then queries the specific H3 encoding through the ST_AsText function.
-- Level 13
UPDATE FOIL2013 SET h3_lev13 = ST_H3FromLatLng(lat,lon,13);

-- Query
SELECT id,lon,lat,ST_AsText(h3_lev13) as h3 FROM FOIL2013 LIMIT 100;
The query results are as follows:
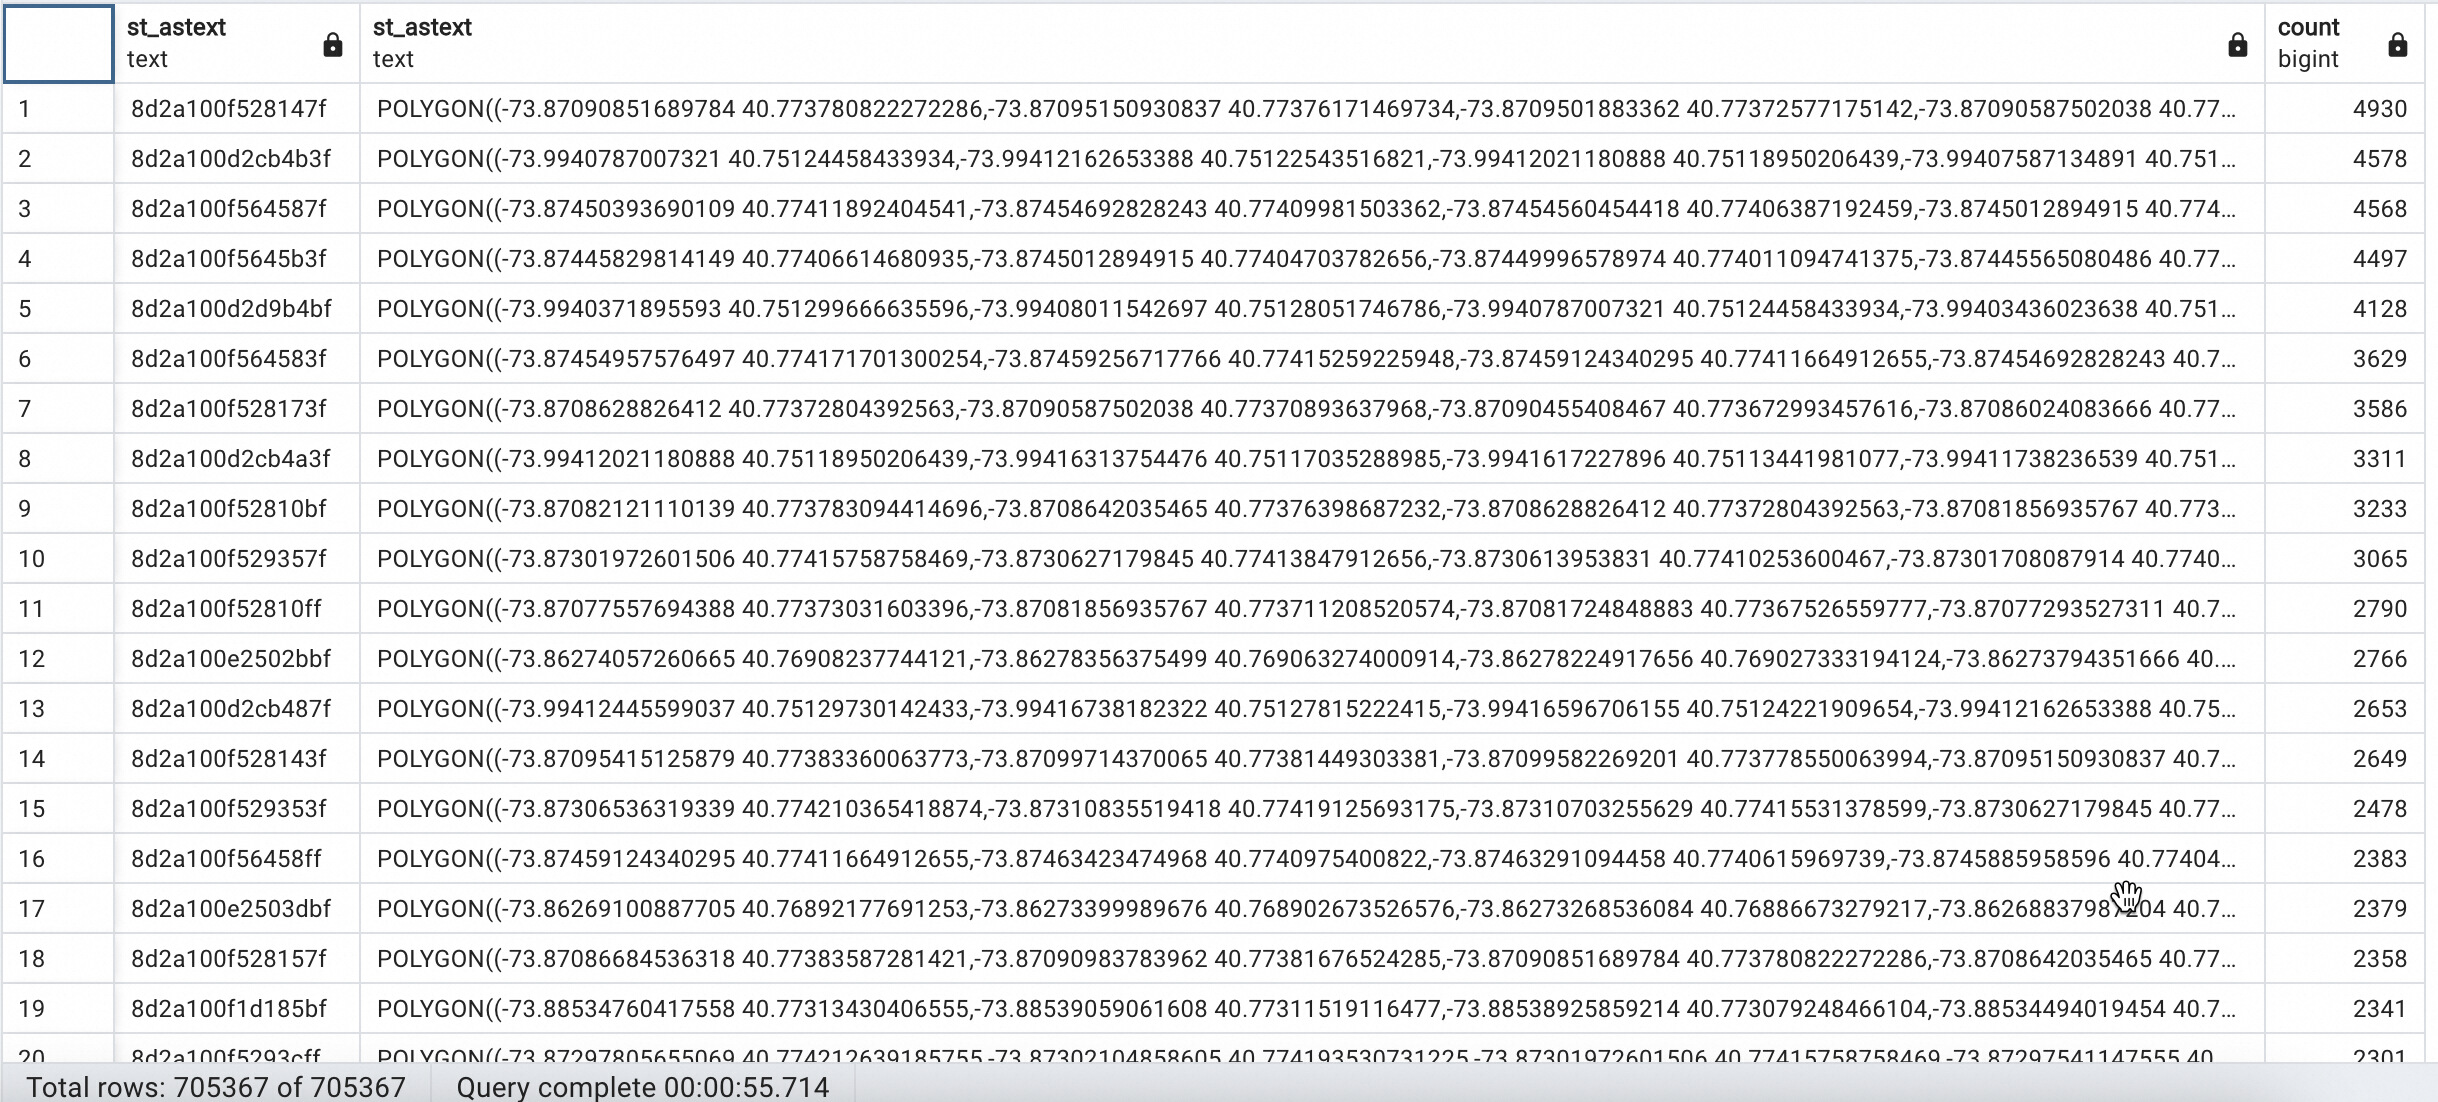
A typical use case for grids is spatial aggregation and statistical analysis of spatial data based on grid codes to obtain thematic maps such as heatmaps. For example, the following SQL statement counts the number of points (count(*)) within each grid based on the h3_lev13 column's H3 code in the FOIL23 table:
-- Aggregate by h3_lev13
CREATE TABLE h3_count_lev13 AS
SELECT ST_AsText(h3_lev13) AS h3code,count(*) FROM FOIL2013 GROUP BY h3_lev13;

-- Query the aggregation results
SELECT ST_AsText(h3_lev13), ST_AsText(geometry),count FROM h3_count_lev13 order by count desc;
The output results are:
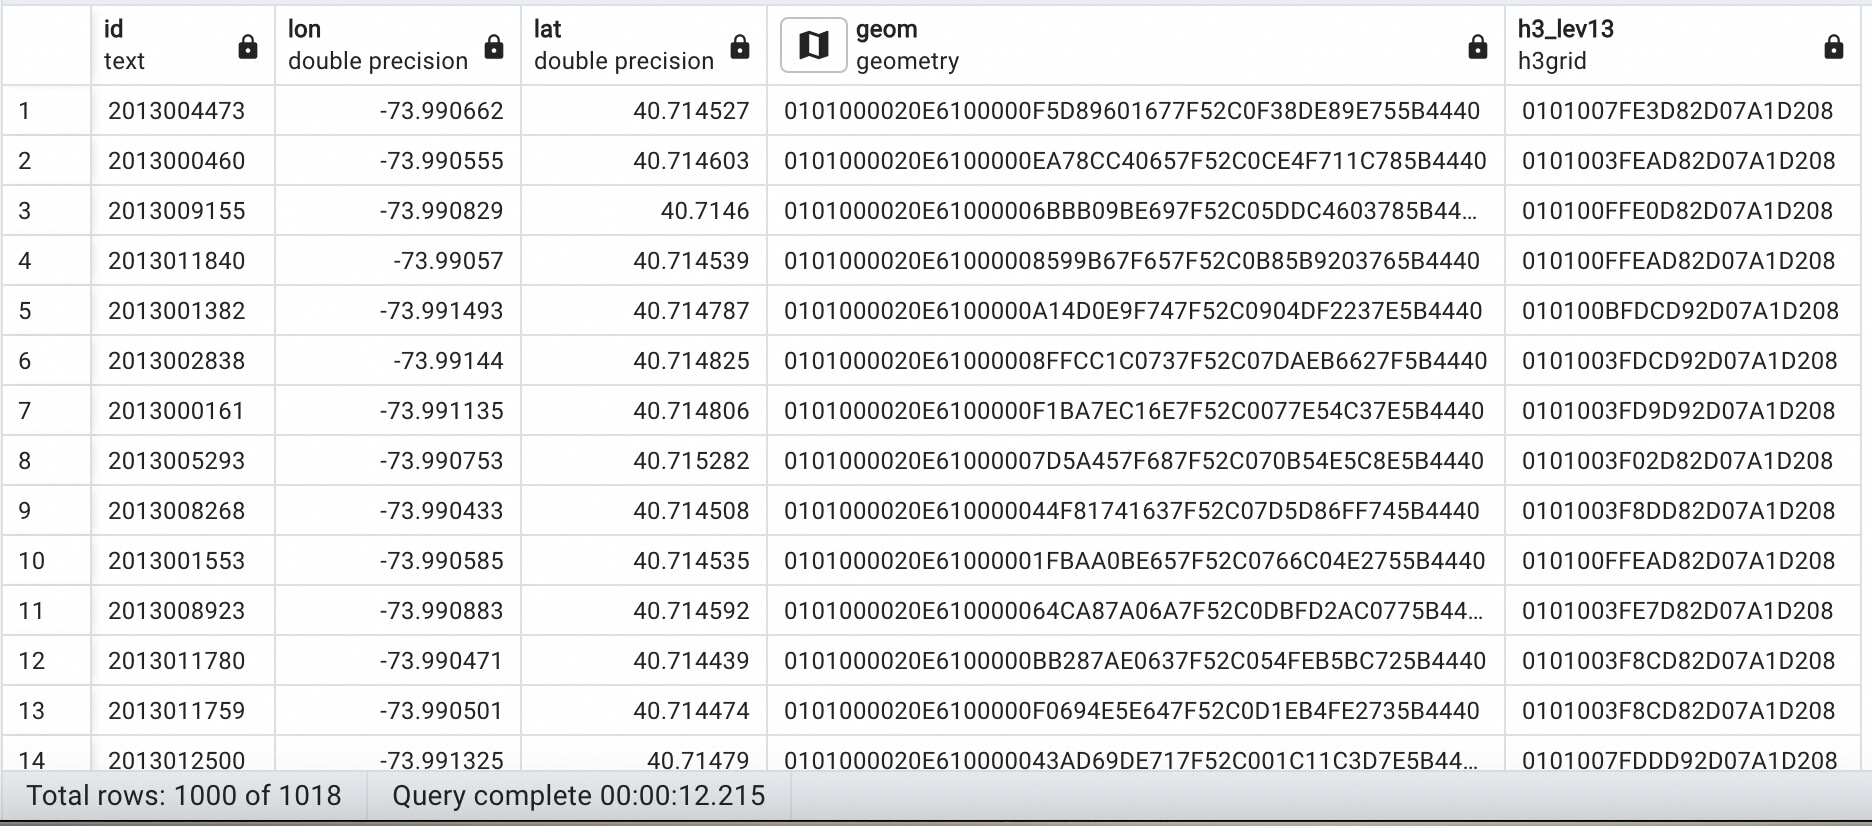
GanosBase H3 provides various operations based on H3 encoding. For example, the following query uses the ST_GridDistance method to obtain all grid points in FOIL23 where the distance between the spatial location (40.71481749, -73.99100368) and the corresponding grid is less than 10:
SELECT * FROM foil2013
WHERE
ST_GridDistance(ST_H3FromLatLng(40.71481749,-73.99100368,13),h3_lev13)<10;
The output results are as follows:
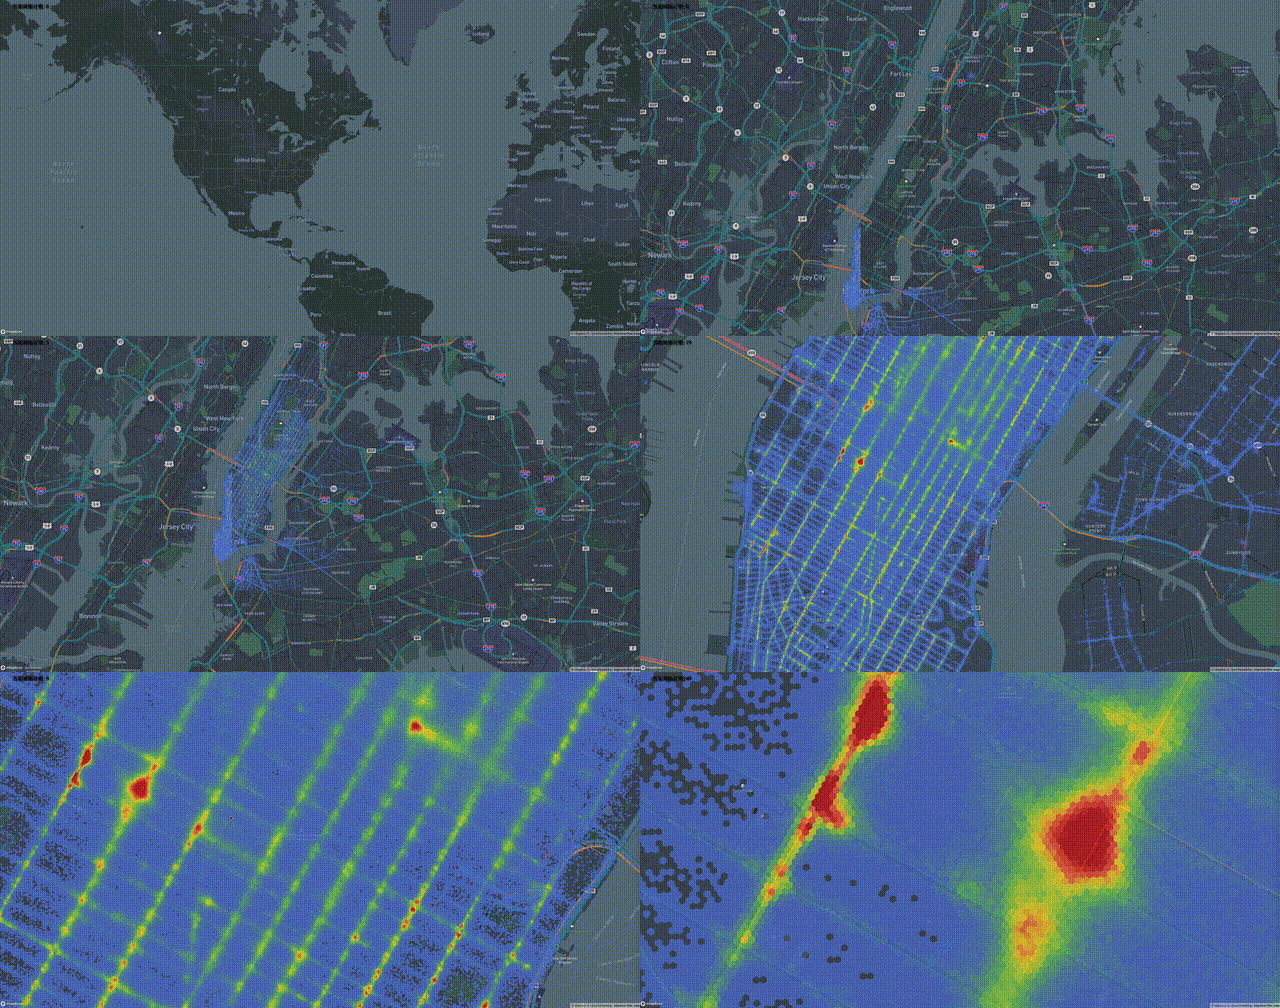
GanosBase supports visualizing H3 grids just like geometric data, meaning H3 grids can be converted into vector tiles, which are then rendered on the front end for viewing. GanosBase provides native H3 grid MVT functions and indexing, allowing users to easily query and visualize H3 grids and their associated statistics. Notably, GanosBase supports visualizing dynamically generated H3 grids. For instance, if users want to visualize level 10 H3 grids but the table does not store level 10 H3 grids, they can use the command ST_AsMVT combined with ST_AsMVTGeom(ST_H3FromLatLng(lat, lon, 10), ...) to dynamically generate visualization results for level 10 H3 grids. However, this is less efficient than pre-saving H3 grids, so the following mainly introduces how to visualize pre-saved H3 grids in a table.
The SQL command to create an H3 grid index is as follows (creating an index is not mandatory for visualization but can significantly improve visualization efficiency):
CREATE INDEX ON h3_count_lev13 USING GIST(h3_lev13);The following SQL command retrieves vector tiles for the grid identified as (14, 4826, 6157) based on H3 grids. This command is almost identical to the one used for retrieving vector tiles based on vector data.
SELECT ST_AsMVT(tile) FROM
  (SELECT ST_AsMVTGeom(h3_lev13, ST_Transform(ST_TileEnvelope(14, 4826, 6157), 4326)) AS grid, count
  FROM h3_count_lev13
  WHERE h3_lev13 && ST_Transform(ST_TileEnvelope(14, 4826, 6157), 4326)) AS tile;
The animation below shows the real-time rendering of vector tiles dynamically queried from H3 grids in the database on the front end. The grid color is dynamically determined based on the statistical value corresponding to the grid. The front-end part requires only a Python script and an HTML file. To start, simply run the Python script and open the browser and enter localhost:5100 to see the results. The Python script automatically generates the corresponding SQL query based on the user's mouse position and zoom level on the map, then displays the database's query results on the web page. The specific front-end code can be found in the appendix section.
Compared to open-source products like pg-h3, GanosBase H3 has the following technical advantages:
This article focuses on the related capabilities of GanosBase H3 geographical grid, introducing how to use the H3 geographical grid for vector data aggregation, spatial relationship judgment, and visualization based on a best practice. The geographical grid is an essential support for mobile object-related application scenarios, and it can bring enormous business value and imaginative possibilities when integrated with data types such as trajectories, vectors, and rasters. As the world's first database to support mobile objects (MOD), GanosBase's related capabilities have been effectively validated on the customer side in industries such as transportation, logistics, travel, and automotive. Compared with traditional middleware or business code implementations, GanosBase provides a spatiotemporal processing framework for large-scale mobile objects from the database system's lowest level, greatly improving computing efficiency and overall costs. In the future, GanosBase will offer more efficient native in-database analysis capabilities for mobile object-oriented scenarios, promoting the comprehensive "onlineization" of spatial information applications in related fields.
The Python script for the front-end visualization is as follows:
from quart import Quart, send_file, render_template
import asyncpg
import io
import re

# Database connection parameters
CONNECTION = {"host": "YOUR-HOST-NAME-OR-IP", "port": PORT_NO, "database": "DATABASE_NAME",
              "user": "USER_NAME", "password": "PASSWORD"}

# Target table name/field/ID
TABLE = "h3_count_lev13"
H3_COL = "h3_lev13"
H3_GEOM_COL = "geometry"
AGG_VAL_COL = "count"
COL_SRID = 4326

app = Quart(__name__, template_folder='./')


@app.before_serving
async def create_db_pool():
    app.db_pool = await asyncpg.create_pool(**CONNECTION)


@app.after_serving
async def close_db_pool():
    await app.db_pool close()


@app.route("/")
async def home():
    sql = f'''
    SELECT ST_Extent(ST_Transform(ST_Envelope({H3_GEOM_COL}), 4326))
    FROM {TABLE};
    '''
    async with app.db_pool.acquire() as connection:
        box = await connection.fetchval(sql)
        box = re.findall('BOX\((.*?) (.*?),(.*?) (.*?)\)', box)[0]
        min_x, min_y, max_x, max_y = list(map(float, box))
        bounds = [[min_x, min_y], [max_x, max_y]]
        center = [(min_x + max_x) / 2, (min_y + max_y) / 2]
        return await render_template('./index.html', center=str(center), bounds=str(bounds))


@app.route("/h3_mvt/<int:z>/<int:x>/<int:y>")
async def h3_mvt(z, x, y):
    sql = f'''
    SELECT ST_AsMVT(tile.*)
    FROM
      (SELECT ST_AsMVTGeom({H3_COL}, ST_Transform(ST_TileEnvelope($1,$2,$3),{COL_SRID}), 4096, 512, true) geometry,
       {AGG_VAL_COL} count
      FROM {TABLE}
      WHERE ({H3_COL} && ST_Transform(ST_TileEnvelope($1,$2,$3),{COL_SRID}))) tile'''
    async with app.db_pool.acquire() as connection:
        tile = await connection.fetchval(sql, z, x, y)
        return await send_file(io.BytesIO(tile), mimetype='application/vnd.mapbox-vector-tile')

if __name__ == "__main__":
    app.run(port=5100)
The contents of the index.html file are as follows:
<!DOCTYPE html>
<html>

<head>
  <meta charset="utf-8">
  <title>map viewer</title>

  <meta name="viewport" content="initial-scale=1,maximum-scale=1,user-scalable=no">
  <link href="https://api.mapbox.com/mapbox-gl-js/v2.14.1/mapbox-gl.css" rel="stylesheet">
  <script src="https://api.mapbox.com/mapbox-gl-js/v2.14.1/mapbox-gl.js"></script>

  <script src="https://cdnjs.cloudflare.com/ajax/libs/chroma-js/2.4.2/chroma.min.js"></script>

</head>

<body>
  <div id="map" style="position: absolute;left:0; top: 0; bottom: 0; width: 100%;cursor:pointer;"></div>

  <div class="counter"
    style="position: absolute;left:2%;font-size: 20px;padding: .1em .1em;text-shadow: 3px 3px 3px black;">
    <span>Current Grid Count:</span>

    <span id="count">0</span>

  </div>

  <script>
    let YOUR_TOKEN = "pk.eyJ1Ijoia3pmaWxlIiwiYSI6ImNqbHZueXdlZjB2cG4zdnFucGl1OHJsMjkifQ.kW_Utrh8ETQltRk6fnpa_A"

    mapboxgl.accessToken = YOUR_TOKEN;
    const map = new mapboxgl.Map({
      container: "map",
      style: "mapbox://styles/mapbox/navigation-night-v1",
      center: {{ center }},
      zoom: 1
    })

    map.on("load", () => {
      map.fitBounds({{ bounds }})

      map.on('mousemove', 'h3', (e) => {
        map.getCanvas().style.cursor = "default";
        if (e.features length > 0)
          document.getElementById('count').innerText = e.features[0].properties.count
      })
      map.on('mouseleave', 'h3', () => {
        map.getCanvas().style.cursor = "grab";
        document.getElementById('count').innerText = 0
      })
      map.addSource("h3_source", {
        type: "vector",
        tiles: [`${window.location.href}h3_mvt/{z}/{x}/{y}`],
        tileSize: 512
      });

      // make color map
      const MIN = 1
      const MAX = 600
      const STEP = 10
      color_map = chroma.scale(["#536edb", "#5d96a5", "#68be70", "#91d54d", "#cddf37", "#fede28", "#fda938", "#fb7447", "#f75a40", "#f24734", "#e9352a", "#da2723", "#cb181d"])
        .domain([MIN, MAX]);
      let colors = []
      for (let i = MIN; i < MAX; i += STEP)
        colors.push(color_map(i).hex(), i)
      colors.push(color_map(MAX).hex())

      map.addLayer({
        id: "

h3",
        type: "fill",
        source: "h3_source",
        "source-layer": "default",
        paint: {
          "fill-color": [
            "step", ["get", "count"],
            ...colors
          ],
          "fill-opacity": 0.8
        }
      });

    });
  </script>

</body>

</html>New Features You Should Not Miss in ApsaraDB RDS for PostgreSQL 17
In-depth Comparison between MySQL MGR and Alibaba Cloud PolarDB-X Paxos
ApsaraDB - October 8, 2024
ApsaraDB - December 10, 2024
Alibaba Cloud Community - December 13, 2024
Data Geek - February 21, 2025
Alibaba Clouder - July 26, 2019
Alibaba Clouder - March 22, 2019
 Best Practices
Follow our step-by-step best practices guides to build your own business case.
Learn More PolarDB for PostgreSQL
Alibaba Cloud PolarDB for PostgreSQL is an in-house relational database service 100% compatible with PostgreSQL and highly compatible with the Oracle syntax.
Learn More PolarDB for Xscale
Alibaba Cloud PolarDB for Xscale (PolarDB-X) is a cloud-native high-performance distributed database service independently developed by Alibaba Cloud.
Learn More PolarDB for MySQL
Alibaba Cloud PolarDB for MySQL is a cloud-native relational database service 100% compatible with MySQL.
Learn MoreMore Posts by ApsaraDB