By Tangbao
Recently, I undertook several real-time data development tasks and inevitably encountered some issues while using Flink, including backpressure caused by data skew, interval join, and watermark ineffectiveness due to windowing. By contemplating and resolving these issues, I deepened my understanding of the principles and mechanisms of Flink. Therefore, I am sharing these development experiences in the hope that they can assist those in need.
The following section describes three cases. Each case is divided into three parts: background, cause analysis, and solution.
Data skew is an issue encountered in both offline and real-time data processing. It is defined as a situation where, during parallel data processing, the data partitioned by certain keys is significantly more than other parts, leading to uneven distribution. This results in a large amount of data being concentrated on one or a few compute nodes, causing the processing speed of these nodes to be much lower than the average computation speed. Consequently, this becomes a bottleneck in the processing of the entire dataset, thereby affecting overall computation performance.
There are many causes of data skew, such as uneven key distribution, excessive null values, and count distinct during group by operations. This article will focus on the case of group by + count distinct.
For real-time exposure streams, calculate the UV and PV of creative exposures in the past 24 hours in real time. The data is updated every minute. The common method is to use a hopping window for statistics, and the code is as follows:
select    H
select
    HOP_START(
        ts
        ,interval '1' minute
        ,interval '24' hour
    ) as window_start
    ,HOP_END(
        ts
        ,interval '1' minute
        ,interval '24' hour
    ) as window_end
    ,creative_id
    ,count(distinct uid) as exp_uv  -- Calculate the exposure UV
    ,count(uid) as exp_pv   -- Calculate the exposure PV
from dwd_expos_detail
group by
    hop(
        ts
        ,interval '1' minute
        ,interval '24' hour
    )  -- Sliding window opening, window range: nearly 24 hours, sliding interval: every 1 minute
,creative_idOP_START( ts ,interval '1' minute ,interval '24' hour ) as window_start ,HOP_END( ts ,interval '1' minute ,interval '24' hour ) as window_end ,creative_id ,count(distinct uid) as exp_uv -- calculate the exposure UV ,count(uid) as exp_pv -- calculate the exposure PVfrom dwd_expos_detailgroup by hop( ts ,interval '1' minute ,interval '24' hour ) -- Sliding window opening, window range: nearly 24 hours, sliding interval: every 1 minute ,creative_idWhen running the above Flink, the window aggregation operator GlobalWindowAggregate experiences prolonged busy periods, leading to backpressure on upstream operators and causing long delays in the entire Flink job.

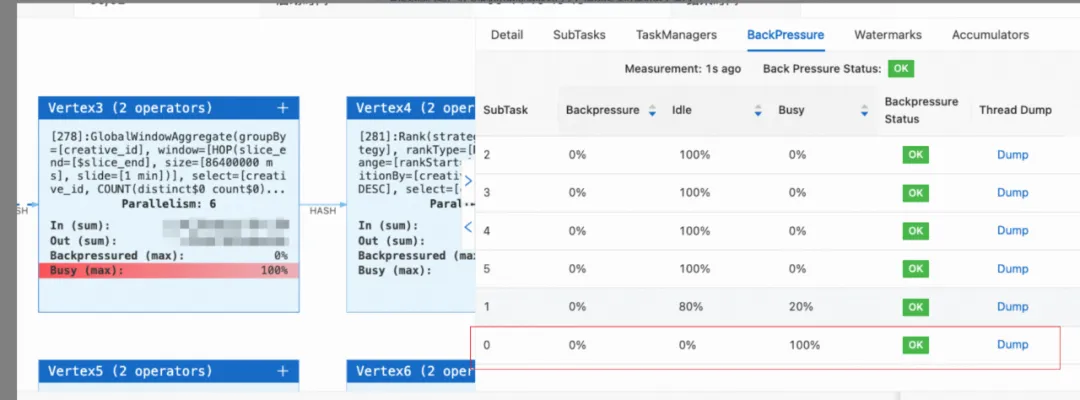
Generally, when dealing with backpressure, the first step is to identify the congested operator. In this case, busy and congested computation occurred during the use of a window aggregation to calculate the UV and PV for each creative ID.
Regarding this situation, the two most commonly considered reasons are typically as follows:
• The data volume is large, but the concurrency level is set too low (in this task, the concurrency of this operator is set to 3).
• Computing resources such as CPU and memory for a single slot is insufficient.
Click the congested operator and check the BackPressure. You can see that although the concurrency is set to 3, only subtask0 is experiencing congestion. Therefore, the above two hypotheses can be mostly ruled out. If still unsure, you can increase the concurrency to 6 and simultaneously increase the memory and CPU allocated to the slots of this operator. The results are as follows:

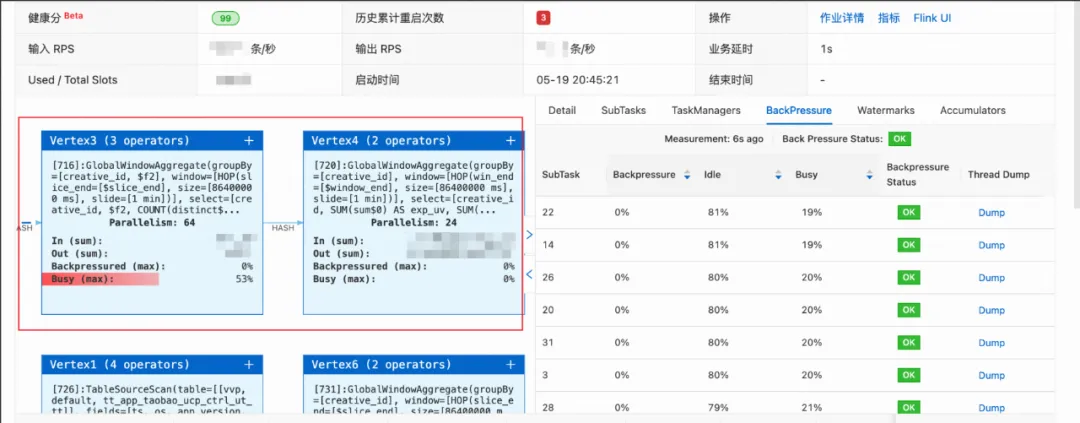
You can see that subtask0 is still in a state of computational congestion. This confirms that the issue is exactly the data skew caused by the uneven distribution of data across keys during the group by operation.
• Enable PartialFinal to resolve hot issues in count distinct
table.optimizer.distinct-agg.split.enabled: true• Limits: This parameter applies to the regular GroupAggregate operator. For the WindowAggregate operator, it is currently only applicable to the new Window TVF (table-valued function). The old Tumble/Hop/Cumulate windows are not supported.
Since our code does not use the window table-valued function, but uses a hopping window directly in the group, this method is not applicable.
Manually scatter the uneven keys and divide the aggregation process into two phases.
• Idea: Add a dispersion layer moduled by Distinct Key
• Implementation:
select
        HOP_START(
            ts
            ,interval '1' minute
            ,interval '24' hour
        ) as window_start
        ,HOP_END(
            ts
            ,interval '1' minute
            ,interval '24' hour
        ) as window_end
        ,creative_id
        ,count(distinct uid) as exp_uv
        ,count(uid) as exp_pv
    from dwd_expos_detail
    group by
        hop(
            ts
            ,interval '1' minute
            ,interval '24' hour
        )
        ,creative_id
,MOD(HASH_CODE(uid), 1024)select
window_start
,window_end
,creative_id
,sum(exp_uv) as exp_uv
,sum(exp_pv) as exp_pv
from (
select
HOP_START(
ts
,interval '1' minute
,interval '24' hour
) as window_start
,HOP_END(
ts
,interval '1' minute
,interval '24' hour
) as window_end
,creative_id
,count(distinct uid) as exp_uv
,count(uid) as exp_pv
from dwd_expos_detail
group by
hop(
ts
,interval '1' minute
,interval '24' hour
)
,creative_id
,MOD(HASH_CODE(uid), 1024)
)
group by
window_start
,window_end
,creative_id
;• Effect: In the topology, you can see that the original window aggregation operator is divided into two independent aggregation operators and that the busy levels of each subtask are now similar, with no uneven distribution.

You need to perform a dual-stream JOIN on the two live streams first, and then use a hopping window on the results after the JOIN to calculate the summary metrics for each creative.
No data is generated for a long time after the windowing.
Watermarks play a decisive role in the implementation of window functions as they determine the trigger timing of windows. Currently, window aggregation supports two types of time attributes for defining windows: Event Time and Processing Time. The most common practice is to define watermarks on the event_time field of the source table. The system will generate watermarks based on the Event Time of the data to close the windows.
The window ends only when the watermark value is greater than the window closing time, and only then will the results be output. The window generates output data only if the data that triggers the window to end flows into Flink.
• Limits: After data passes through the GroupBy, dual-stream JOIN, or OVER window nodes, the watermark attribute is lost, making it impossible to use Event Time for windowing.
Since our code first uses an interval join to process click streams and transaction streams, and then performs windowing on the generated data, this results in the loss of watermarks, preventing the window functions from being triggered.
Idea 1: Since the time field loses its watermark attribute after the dual-stream JOIN, we can consider adding a processing time field to the result after the JOIN, and then use this field for windowing.
• Disadvantage: This field does not reflect the time attribute of the data. It is only the timestamp of the data that is processed by the machine. As a result, the result of window aggregation is inaccurate and is not recommended.
Idea 2: Create a new TT stream.
• To perform windowing, watermarks are essential. However, watermarks are often lost during the aforementioned aggregation or dual-stream join processes. Therefore, consider creating a new Flink job specifically for the dual-stream join. This job will filter out the qualifying user transaction detail stream and write it to a temporary table (TT). Then, consume this TT, define watermarks on the event_time field in the TT stream, and directly use the data for hop sliding windows.
• Implementation:
insert into sink_dwd_pop_pay_detail_ri
select
    p1.uid
    ,p1.order_id
    ,p1.order_amount
    ,p1.ts
    ,p2.creative_id
from (
    select
        uid
        ,order_amount
        ,order_id
        ,ts
    from dwd_trade_detail
) p1
    join dwd_clk_uv_detail p2
        on p2.ts between p1.ts - interval '6' hour and p1.ts
        and p1.uid = p2.uid
;select
HOP_START(
ts
,INTERVAL '1' minute
,INTERVAL '24' hour
) as window_start
,HOP_END(
ts
,INTERVAL '1' minute
,INTERVAL '24' hour
) as window_end
,creative_id
,sum(order_amount) as total_gmv
,count(distinct uid) as cnt_order_uv
,round(
sum(order_amount) / count(distinct uid) / 1.0
,2
) as gmv_per_uv
from source_dwd_pop_pay_detail_ri
GROUP BY
HOP(
ts
,INTERVAL '1' minute
,INTERVAL '24' hour
)
,creative_id
;Purpose: For real-time streams, you need to label whether the material passes or not.
Labeling logic: If the material ID appears in both the lastValidPlanInfo and validPlanInfo array fields, the material passes (is_filtered=0). If the material ID appears in only lastValidPlanInfo array field, the material fails (is_filtered= 1).
Sink table type: ODPS/SLS. The sink table does not support the retraction and primary key update mechanisms.
The implementation SQL for the above logic is as follows:
SELECT
    `user_id`
    ,trace_id
    ,`timestamp`
    ,material_id
    ,min(is_filtered)) as is_filtered   -- Final group by aggregation, so each material obtains a unique label
    FROM (
 SELECT
     `user_id`
     ,trace_id
     ,`timestamp`
     ,material_id
     ,1 as is_filtered   -- All materials appearing in the lastValidPlanInfo field are tagged with a 1 as a filtered label
 FROM dwd_log_parsing
     ,lateral table(string_split(lastValidPlanInfo, ';')) as t1(material_id)
 WHERE lastValidPlanInfo IS NOT NULL
 UNION ALL
 SELECT
     `user_id`
     ,trace_id
     ,`timestamp`
     ,material_id
     ,0 as is_filtered     -- All materials appearing in the validPlanInfo field are tagged with a 0 as a filtered label
 FROM dwd_log_parsing
   ,lateral table(string_split(validPlanInfo, ';')) as t2(material_id)
      WHERE validPlanInfo IS NOT NULL
    )
    GROUP BY
        `user_id`
        ,trace_id
        ,`timestamp`
,material_idSample of original data: According to the following figure, it can be found that the two material IDs of 1905 and 1906 appear in the lastValidPlanInfo. However, only the ID of 1906 appears in the validPlanInfo field, indicating that the 1905 has been filtered out and the 1906 has passed.

The expected calculation should be:
| material_id | is_filtered |
| 1905 | 1 |
| 1906 | 0 |
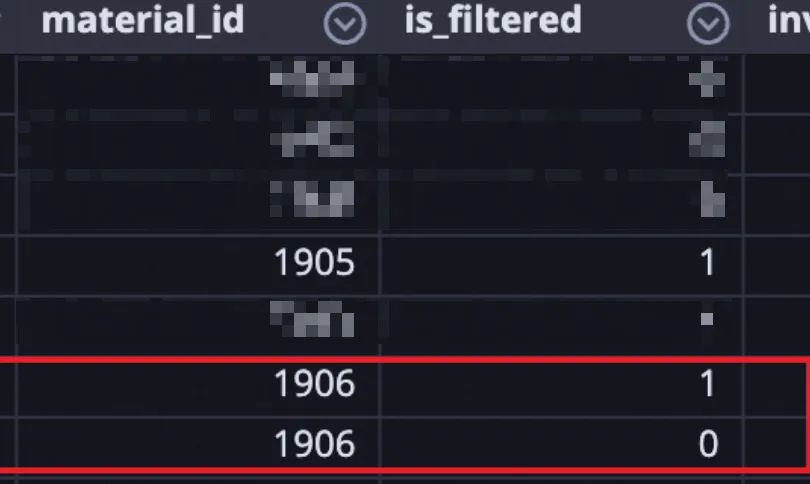
However, the final results written to ODPS are as shown in the figure below. We can see that material_id 1906 appears twice with inconsistent results. This raises the question: has the group by in Flink failed?

Since the ODPS sink table does not support retraction and upsert primary key update mechanisms, for every piece of stream data from the source table, as long as it enters the operator and produces a result, it will be directly written to ODPS.
The use of UNION ALL and LATERAL TABLE splits a stream into multiple streams. In the above code, LATERAL TABLE is first used to split the material_id numbers in the lastValidPlanInfo and validPlanInfo array fields into multiple material_id records. Then, UNION ALL and GROUP BY are used to implement the filtering and labeling functionality. These operations have already split one stream of data from the original TT stream into multiple streams.
Combining the above two points,
• For the material ID of 1906, due to the use of LATERAL TABLE, it and 1905 became two separate streams of data.
• Due to the use of UNION ALL, it was further split into one stream of data with is_filtered = 1 (the first part of the UNION ALL) and one stream of data with is_filtered = 0 (the second part of the UNION ALL).
• Since Flink can only process one stream of data at a time, if it first processes the stream of data with is_filtered = 1 for material 1906, after the group by and min(is_filtered) operations, the result with is_filtered = 1 will be written to ODPS. Then, when processing the stream data with is_filtered = 1, after the group by and min(is_filtered) operations, the state updates the minimum value of is_filtered to 0, and this result is then written to ODPS.
• Since ODPS does not support retraction and primary key updates, there will be two records for material 1906 with inconsistent results.
• Idea: When you use the LATEAL TABLE and UNION ALL, a stream of data is converted into multiple streams, which causes the problem of multiple writes. Therefore, we consider allowing these derived multiple streams of data to enter the group by operation at once for aggregation, resulting in only one output.
• Implementation: Mini-batch processing
table.exec.mini-batch.enabled: true
table.exec.mini-batch.allow-latency: 1s
• Concept: Mini-batch processing involves caching a certain amount of data before triggering processing. This reduces the access to State, thereby improving throughput and reducing the volume of data output. Mini-batch processing trades increased latency for higher throughput. If you have ultra-low latency requirements, it is not recommended to enable mini-batch processing. However, in data aggregation scenarios, we recommend that you enable mini-batch processing to improve system performance.
• Effect: The above problem is resolved. The ODPS table now only outputs one record for each material ID for each user request.
Flink SQL development is the most convenient and efficient way to meet real-time data requirements. However, there are significant differences between it and offline ODPS SQL development in terms of underlying mechanisms and principles. The fundamental difference lies in the handling of streams and batches.
Let's accumulate more experience from the problems encountered and proficiently use Flink.
[01] Window: https://www.alibabacloud.com/help/en/flink/developer-reference/overview-4
[02] High Performance Optimization: https://www.alibabacloud.com/help/en/flink/user-guide/optimize-flink-sql
Disclaimer: The views expressed herein are for reference only and don't necessarily represent the official views of Alibaba Cloud.
Exploration From Failure Drills to O&M Tool Capability Evaluation
A Distributed Computing Idea of Global Dictionary Index Based on ODPS SQL

1,370 posts | 487 followers
FollowApache Flink Community China - January 11, 2021
Apache Flink Community China - September 27, 2020
Alibaba Cloud Community - March 9, 2023
Apache Flink Community China - March 29, 2021
Apache Flink Community China - April 17, 2023
Apache Flink Community China - July 27, 2021

1,370 posts | 487 followers
Follow Realtime Compute for Apache Flink
Realtime Compute for Apache Flink offers a highly integrated platform for real-time data processing, which optimizes the computing of Apache Flink.
Learn More Real-Time Livestreaming Solutions
Stream sports and events on the Internet smoothly to worldwide audiences concurrently
Learn More Web Hosting Solution
Explore Web Hosting solutions that can power your personal website or empower your online business.
Learn More Web Hosting
Explore how our Web Hosting solutions help small and medium sized companies power their websites and online businesses.
Learn MoreMore Posts by Alibaba Cloud Community