Faced with increasingly complex business systems and imminent stability challenges, MoreFun Group, a leading digital solutions provider, achieved a breakthrough by building a full-stack observability system, improving fault detection efficiency by 80% and reducing O&M costs by 40%.
MoreFun Group is an emerging pan-cultural entertainment group in China centered on live events. It has gradually built a live entertainment ecosystem that integrates artist training, event organization, and ticket sales and promotion. The company is committed to advancing the development of China's cultural entertainment and performing arts industry through industry chain integration. MoreFun Group has served over 30 million audience members with performances in more than 230 cities across China.
As MoreFun Group's R&D system evolves toward higher availability and efficiency, ensuring stability and observability has become critical to user experience and business continuity.
● The Challenge of Meeting the 1-5-10 Stability Goal
Meeting the industry-leading "1-5-10" stability goal—detecting faults within 1 minute, locating root causes within 5 minutes, and restoring services within 10 minutes—exposed deep-seated, systemic limitations in the existing monitoring system. Monitoring blind spots prevented the timely capture of exceptions on critical paths. During failures, alert storms overwhelmed valid information, causing alert fatigue for on-duty engineers. Fault location remained highly dependent on manual experience and cross-system checks, resulting in fragmented tracing, decentralized log queries, and significantly slower response times. More critically, the alert process lacked a closed-loop management mechanism. Many issues stalled at the notification stage and were never fully addressed, which prevented the formation of a positive feedback loop for review, optimization, and prevention. Consequently, similar faults repeatedly occurred.
● The Dilemma in Selecting Technologies for Observability
In typical high-concurrency scenarios such as ticket sales, particularly during the instantaneous traffic surges from ticket releases for popular shows or events, the observability system is put to the ultimate test. Limited by physical resources and cluster size, the self-managed observability system is prone to issues such as data loss, storage latency, and query timeouts when handling millions of instantaneous QPS, leading to gaps in critical observation windows. Over-provisioning resources to handle peak traffic creates a conflict, resulting in long periods of resource idleness and high costs. A more profound problem is that the existing observability components have a diverse and fragmented technology stack. Logs, metrics, and traces are siloed, lacking a unified data model and correlation capabilities. This makes it difficult to build the end-to-end views needed to support rapid decision-making.
● Limitations of the Previous TINGYUN APM Solution
The previous Application Performance Management (APM) solution of TINGYUN provided basic monitoring, but its closed nature became a bottleneck for agile business development. The system only offered fixed-dimension reports and limited APIs, preventing business teams from consuming observability data for their own purposes. This made it impossible to perform deep analysis or generate custom insights for specific scenarios, such as analyzing user ticket-purchase funnels, identifying regional hotspots, or detecting abnormal behavior patterns. Furthermore, the commercial software's rigid licensing model was a poor fit for MoreFun Group's need for rapid iteration and elastic scaling. Resource expansion was frequently constrained by license limitations, which hampered system agility and increased cost-management pressure.
These intertwined challenges highlight that achieving stability goals requires more than just optimizing processes and mechanisms. It is urgent to build an open, elastic, and intelligent next-generation observability platform to enable a comprehensive shift: from reactive response to proactive prevention, from fragmented monitoring to end-to-end insights, and from tool silos to data-driven operations.
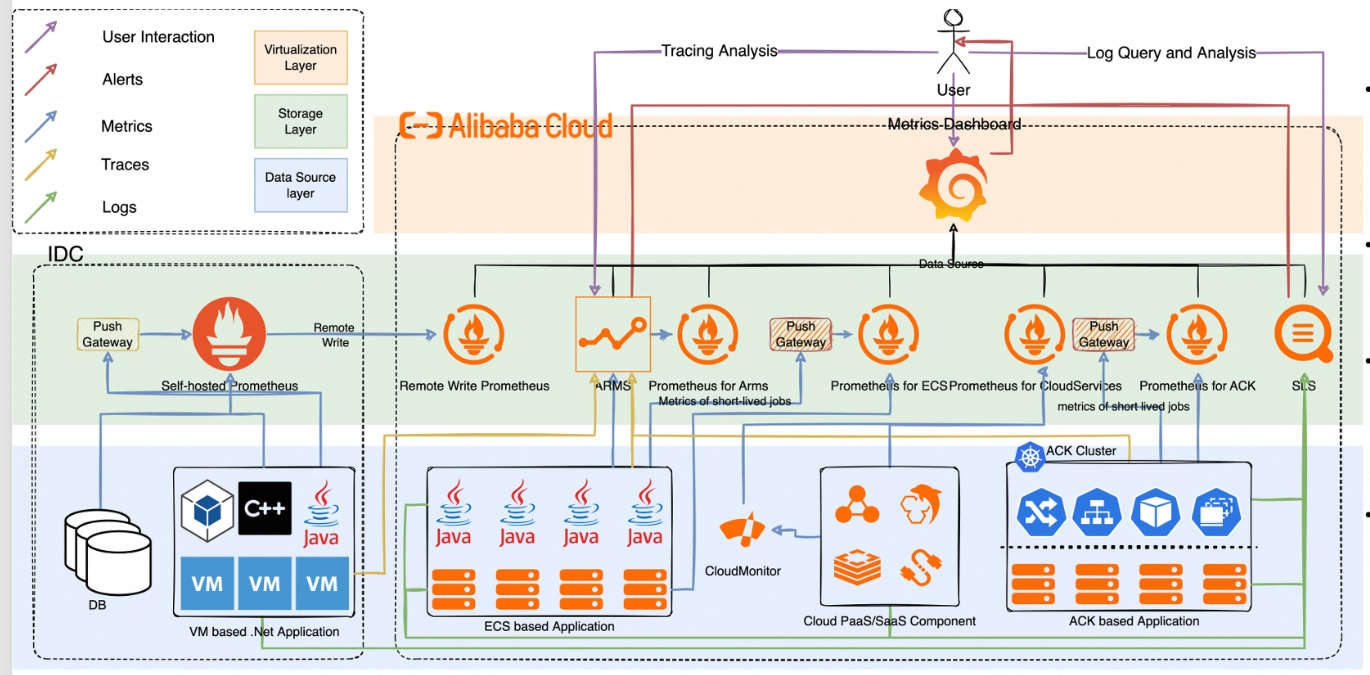
To comprehensively build out the observability capabilities for MoreFun Group's R&D system, an integrated, full-stack monitoring architecture was constructed around Alibaba Cloud's core observability services. This architecture aims to create a closed loop of end-to-end observation, from infrastructure to business applications, to truly support the achievement of the "1-5-10" stability goal. It deeply integrates the four dimensions of observability—logs, metrics, traces, and user experience—providing unified capabilities for collection, centralized analysis, intelligent alerting, and visual insights.
● Simple Log Service (SLS): enables real-time collection, querying, and analysis of business log data from ticketing platforms and systems.
● Application Real-Time Monitoring Service (ARMS): provides end-to-end tracing and performance profiling capabilities.
● Managed Service for Prometheus: facilitates metric collection, monitoring, and alerting for containerized environments and cloud resources.
● *Synthetic Monitoring: verifies service availability and performance from the user perspective.
This architecture not only unifies the technology stack and integrates complementary capabilities but also breaks down traditional monitoring silos through data correlation, creating a closed-loop chain for detection, location, and response. This panoramic observability system is becoming the core pillar supporting the stable operation and rapid recovery of MoreFun Group's systems.

In building the observability capabilities for MoreFun Group's R&D system, we established an integrated monitoring foundation with the goals of "comprehensive visibility, accurate judgment, and rapid response." This foundation encompasses end-to-end observability data, a layered metric system, and basic alerting capabilities. It not only achieves deep coverage from code to user and from application to infrastructure but also provides solid support for system stability through unified data collection and intelligent alert coordination mechanisms.
1. At the data collection layer, we established a standardized and scalable unified collection architecture.
● LoongCollector is used for centralized collection of core application logs in containerized environments, ensuring no logs are lost or delayed. It supports high availability and resumable uploads, meeting the demands of high-frequency writes in the ticketing system.
● The ARMS agent (primarily for Java) provides non-intrusive access to MoreFun Group's core applications. It comprehensively captures full-stack trace data—from frontend pages and API gateways to backend microservices and middleware such as databases, caches, and message queues. The agent completely reconstructs the service topology and performance characteristics of each request, achieving true end-to-end observability.
● All monitoring metrics from the application, infrastructure, and middleware layers are sent to Managed Service for Prometheus. Leveraging its powerful multi-dimensional data model, it supports flexible drill-down analysis by dimensions such as cluster, namespace, instance, and business tag, avoiding the "seeing the whole but not the details" blind spot.
2. Building upon this data foundation, we constructed a clearly layered and comprehensive metric system.
● At the application layer, we focus on key performance indicators such as QPS, error rate, response latency (P99/P95), JVM runtime status (GC frequency and heap memory usage), and thread pool activity to promptly identify service overloads or resource bottlenecks.
● At the infrastructure layer, we continuously monitor CPU, memory, disk I/O, network throughput, and container resource quotas versus actual usage to prevent cascading failures caused by contention for underlying resources.
● At the middleware layer, we focus on typical risk points such as slow database query trends, Redis cache hit rate fluctuations, and message accumulation in message queues to provide early warnings for potential dependency issues.
These metrics are not isolated; they are integrated and displayed on Grafana dashboards. Customized monitoring views are created for different lines of business such as transactions, channels, and content. These dashboards are displayed in real time on large screens in each team's workspace, making core business traffic changes and abnormal fluctuations instantly visible and fostering an O&M culture where "everything is visible and traceable."
3. The alerting system has evolved from a simple threshold-triggering tool into an intelligent hub with collaboration capabilities and closed-loop management logic.
● The ARMS alert management module acts as the central hub, aggregating alert events from multiple sources, including cloud service monitoring, custom metrics, slow database queries, and service health scores. All events are ingested via a unified webhook and standardized, eliminating the management chaos caused by scattered alert sources.
● Building on ARMS's native capabilities, we implemented a tiered classification policy based on business priority and impact scope. This enables precise alert routing along lines of business such as transactions, channels, and stores, ensuring notifications directly reach the responsible on-duty personnel. Support for both WeCom group notifications and individual @-mentions enhances response efficiency.
● Every alert is managed through its entire lifecycle, with auditable records for generation, acknowledgment, handling, and recovery verification. Each step is linked to service level objective (SLO) compliance for statistical analysis, helping teams assess service quality trends, drive post-event reviews, and implement preventive measures. This achieves closed-loop governance where "every alert gets a response, every issue has an attribution, and every improvement is evidence-based."
This entire system is more than a simple stack of technical components; it is a deep integration of data, processes, and accountability mechanisms. It provides robust observability support, ensuring the stable operation of MoreFun Group in a business environment characterized by high concurrency and complex dependencies.
1. As MoreFun Group's R&D system evolved toward intelligent, data-driven O&M, we gradually built a health and service quality evaluation system centered on business value.
● Focusing on the core objectives of the ticketing system, we identified transaction success rate, response time, system throughput, and system load as the key "golden signals." These metrics not only reflect the system's operational status but are also directly linked to the user's ticket-purchasing experience and business outcomes.
● Based on these core metrics, we further developed a multi-dimensional service scorecard mechanism. It includes an infrastructure health score (e.g., node stability, resource utilization), an application performance score (e.g., call latency, error rate, JVM status), and a business availability score (e.g., order creation success rate, payment link accessibility). Through weighted calculations, we generate a quantifiable and comparable service health score. This score is updated daily, enabling horizontal comparisons of stability across different services and providing an objective basis for capacity planning, release gating, and fault reviews.
● We bridged the semantic gap between technical metrics and their business impact. Underlying anomalies, such as increased database latency or a surge in gateway error rates, are translated into intuitive business terms such as "an estimated XX orders affected per minute" or "service capacity in the current region has dropped by 30%." These insights are displayed in real time on visual dashboards, making technical issues truly understandable and perceptible to business stakeholders.
2. Root cause analysis has become a core capability for rapid fault response.
When core metrics fluctuate or an alert is triggered, the system automatically marks the abnormal service node in red, allowing O&M and R&D engineers to immediately pinpoint the problem domain. By clicking the abnormal node, they can seamlessly drill down to the full-stack trace view. This allows them to view the specific call path of the failed or slow request and accurately identify the cause, whether it is a slow internal service, a slow database query, or a third-party API timeout. Critically, traces are deeply integrated with the logging system. Associated log context—including complete error messages, exception stacks, and request/response parameters—is directly embedded within the trace. This drastically shortens the manual process of "checking the trace, then searching logs, then matching timestamps." Additionally, the system automatically correlates recent change events, such as code releases, configuration pushes, or elastic scaling operations, to help determine if the issue is a side effect of a recent change, significantly improving the mean time to recovery (MTTR).
3. The deep integration of root cause analysis capabilities with the all-in-one development platform has driven a complete upgrade from reactive firefighting to proactive insight, and from a technical perspective to a business impact perspective.
To embed these powerful observability capabilities into daily R&D, we drove the deep integration of the observability system with the all-in-one development platform. Developers can now view real-time alerts, health scores, traces, and logs for their services directly within their familiar development portal, without needing to switch between multiple Alibaba Cloud consoles. This makes the "observability-in-development" philosophy a reality. This integration not only eliminates the operational burden of switching between products but also improves the overall consistency of the toolchain through a unified experience. To address the complexity and steep learning curve of the native product interfaces, we designed simplified entry points based on high-frequency use cases, lowering the onboarding barrier for new team members. Today, this integrated approach has become key to improving R&D efficiency. On one hand, issues on the O&M side can quickly reach the responsible parties. On the other hand, developers can proactively identify potential risks during local debugging and canary release stages. This creates a bidirectional "develop-release-monitor-feedback-optimize" closed loop, enabling a truly collaborative evolution of development and operations.
This observability system, which integrates a business perspective, intelligent analysis, and process integration, is continuously strengthening MoreFun Group's ability to deliver stable services in a high-concurrency, rapid-iteration environment. Technical assurance is no longer a background function but a reliable pillar supporting business growth.
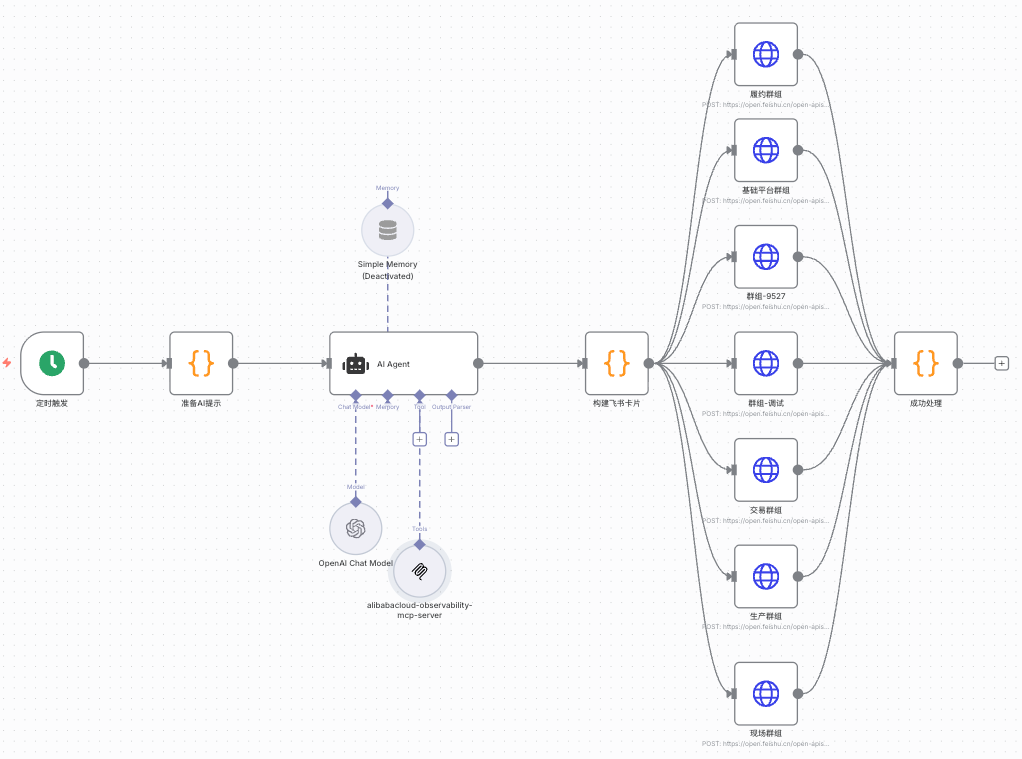
Building on the maturing observability system, MoreFun Group's R&D team is now advancing into the deeper waters of intelligent O&M. By combining the capabilities of large models with full-stack observability data, the team is developing an intelligent O&M workflow powered by AI and observability. This initiative aims to evolve fault handling from manual intervention to automated, closed-loop resolution. The workflow, centered on "anomaly detection → root cause analysis → visual reporting," is integrated into the entire daily O&M and insight process. It significantly improves issue detection efficiency, accelerates decision-making, reduces reliance on expert experience, and frees up human resources to focus on higher-value system optimization tasks.
● Relying on Model Context Protocol (MCP), the system automatically aggregates and semantically understands massive daily alert events. Instead of simply listing triggered alerts, it leverages large language models (LLMs) to correlate and cluster alerts across services and layers, identifying common issues that have a real business impact. It also generates daily reports that display issue distributions, predict potential root causes, and provide actionable optimization suggestions. This preliminary analysis, performed by the machine, greatly reduces information overload for on-duty personnel and ensures key issues are surfaced first.
● To automate this process, we designed an agent workflow based on prompt engineering, which dynamically generates high-quality inference instructions by combining business context and historical data. This agent automatically extracts alert context, structures it into an input the model can understand, and prompts the large model to generate a standardized insight summary. This content is not only used to generate a visual daily report but also provides data for weekly stability reviews, helping the team identify long-standing technical debt or architectural shortcomings.
● The final AI-generated daily report based on MCP presents core conclusions in a concise and intuitive format. This not only helps technical leaders grasp the overall health trend of the system but also provides front-line developers with precise starting points for investigating issues. More importantly, the report is not the end of the process; it is the starting point that triggers subsequent automated actions, enabling a closed loop from "issue detection" to "resolution initiation."

The implementation of this intelligent workflow marks the evolution of MoreFun Group's O&M system from "observable" to a new stage of being "predictive and decision-making." AI is no longer an isolated capability plug-in but a collaborator deeply integrated into daily O&M. It continuously improves the system's self-healing capabilities and the team's response efficiency, building a more agile and resilient technological moat for business that requires high concurrency and rapid iteration.
|
End-to-End Visualization Capability ● Built visual monitoring dashboards covering all core business chains. ● Achieved end-to-end observability from the client side to the backend infrastructure. ● Increased monitoring coverage of key business chains from 65% to 99.5%. |
Qualitative Improvement in Fault Response Efficiency ● Reduced average fault detection time from 8 minutes to under 1 minute. ● Reduced root cause location time from 15 minutes to 8 minutes. ● Reduced business recovery time from hours to minutes. |
|
Enhanced Resource Utilization ● Reduced computing resource costs by 40% during non-business hours through a tidal scheduling mechanism. ● Reduced storage costs for high-frequency data by 70% via an intelligent data tiering strategy. |
Comprehensive Improvement in O&M Efficiency ● Reduced alert volume by 85%, increasing the ratio of valid alerts to 90%. ● Achieved 60% automated fault handling, significantly reducing manual intervention. |
● Establish a monitoring data quality assessment system to ensure data accuracy and timeliness.
● Build monitoring metric specifications for business scenarios to enhance the business value of the data.
● Enhance AIOps capabilities to achieve automatic alert convergence and fault self-healing.
● Develop an intelligent root cause analysis engine to provide solution recommendations.
"By building a next-generation observability system, we have not only achieved a leap in stability but, more importantly, established a data-driven mechanism for O&M decision-making. This observability system has become the digital cornerstone for our product and business development, further enhancing the quality and efficiency of our digital initiatives."
Why Does Alibaba Cloud Want to Open Source the Data Collection Development Kit
Building a Unified Entity Search Engine by Using UModel for Observability Scenarios

677 posts | 56 followers
FollowAlibaba Cloud Native Community - August 7, 2025
Alibaba Cloud Native Community - December 6, 2022
Alibaba Container Service - January 15, 2026
Alibaba Cloud Native Community - August 13, 2025
Alibaba Cloud Native Community - November 22, 2022
Alibaba Cloud Native Community - November 27, 2025

677 posts | 56 followers
Follow Managed Service for Grafana
Managed Service for Grafana displays a large amount of data in real time to provide an overview of business and O&M monitoring.
Learn More Bastionhost
A unified, efficient, and secure platform that provides cloud-based O&M, access control, and operation audit.
Learn More Application Real-Time Monitoring Service
Build business monitoring capabilities with real time response based on frontend monitoring, application monitoring, and custom business monitoring capabilities
Learn More Managed Service for Prometheus
Multi-source metrics are aggregated to monitor the status of your business and services in real time.
Learn MoreMore Posts by Alibaba Cloud Native Community