For mobile apps, stability is the cornerstone of user experience. Any exceptions can cause user frustration and lead to negative reviews, ultimately resulting in uninstallation of the app. Therefore, it is critical for developers to quickly identify, locate, and fix these issues. However, when an online app crashes, we often receive no more than an unhelpful "App stopped working" message. Root cause identification becomes particularly challenging when it comes to native crashes and obfuscated code, where stack traces can be as obscure as "gobbledygook". This article breaks down the underlying principles of Android crash capture and tackles its core technical challenges. It also provides a unified framework designed to illustrate the "blind spots" in addressing crashes of online apps, exploring a closed loop from crash capture to accurate cause identification.
To catch crashes, we first need to understand the underlying mechanisms that trigger the two main types of crashes in the Android system.
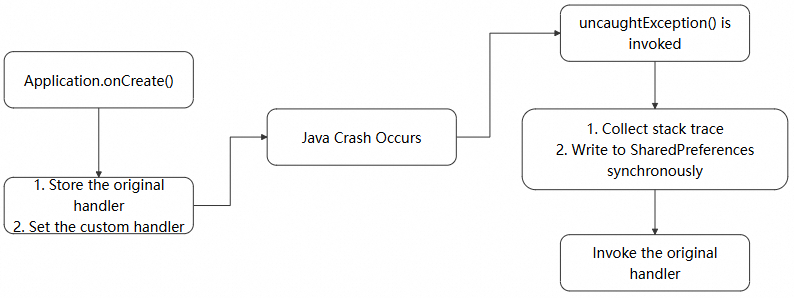
Both Java and Kotlin code run on Android Runtime (ART). When an exception (e.g., NullPointerException) is thrown in the code but is not caught by any try-catch block, the exception propagates all the way up the call stack. If the exception reaches the top of the thread and still remains unhandled, ART terminates the thread. Before termination, ART invokes a callback interface that can be set by the developer—Thread.UncaughtExceptionHandler.
This is where we catch Java crashes. By calling Thread.setDefaultUncaughtExceptionHandler(), we can register a global handler. When an uncaught exception occurs in any thread, our handler takes over, giving us a crucial opportunity to record the key information about the crash scene before the process is completely killed.
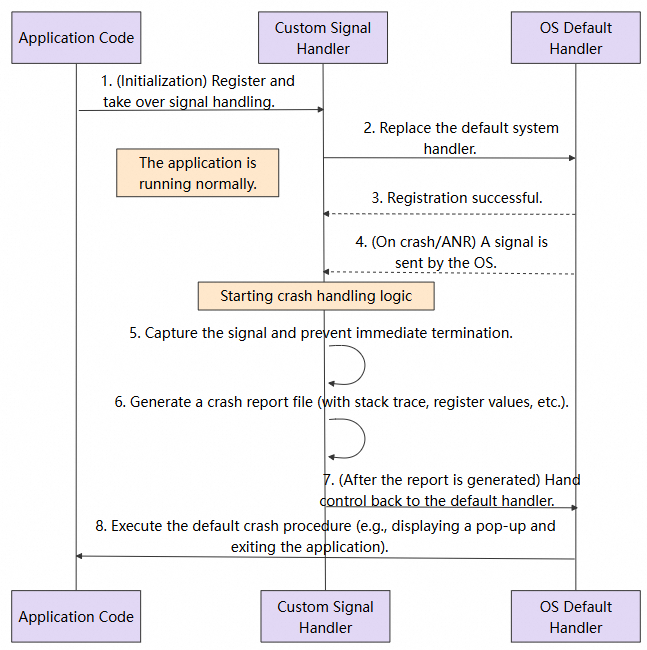
Native crashes occur at the C/C++ code layer, which is not managed by the ART virtual machine, so they cannot be handled through UncaughtExceptionHandler. Essentially, a native crash occurs because the CPU executes an illegal instruction, which is then detected by the operating system kernel. In response, the kernel sends a Linux signal (Signal) to the affected process to notify it of the event, which is a mechanism for asynchronous communication between the kernel and the process.
● SIGSEGV (Segmentation Fault): This is the most common cause of native crashes, where a program tries to access a memory area that it does not have access to. Examples include dereferencing a null pointer, accessing freed memory (Use-After-Free), array index out of bounds, and attempting to write to a read-only memory segment.
● SIGILL (Illegal Instruction): This signal is triggered when the CPU's instruction pointer points to an invalid address or one containing corrupted data, making the CPU unable to recognize the instruction to be executed. For example, a function pointer error causes a jump to a non-code area, or a stack corruption causes a return address error.
● SIGABRT (Abort): abnormal program termination. This mostly likely happens when the program itself "decides" to, usually triggered by calling the abort() function. In C/C++, many assertion libraries (assert) call abort() when an assertion fails, indicating that the program has entered a state that should never exist.
● SIGFPE (Floating-Point Exception): a floating point exception, such as integer division by zero and floating-point overflow/underflow.
Capturing these signals and restoring the context is an intricate and methodical process:
sigaction): This is the first step in the capture process. We use the sigaction() system call to register a custom callback function for the signal of interest (e.g., SIGSEGV). Compared with the old signal() function, sigaction offers more capabilities. Particularly, when the SA_SIGINFO flag is specified, the callback function can receive a siginfo_t structure containing detailed context, such as the specific memory address (si_addr) that caused the crash and other key information.async-signal-safe environment: Signal-handler functions run in a highly specific and demanding environment. In such an environment, we cannot assume that global data structures are intact; nor can we call most standard library functions (e.g., malloc, free, printf, strcpy), because they are not "asynchronous-signal safe". Calling them can easily lead to secondary crashes or deadlocks. Therefore, we are limited to calling only a few functions that are explicitly marked as "safe" (e.g., write, open, read).libunwind are widely used for this purpose. However, in a native crash scenario, the stack itself may have been corrupted, which means the success rate of real-time unwinding is not 100%.
Based on the crash capture principles described above, many excellent open source and commercial solutions have been developed. They are essentially engineered packages of these principles.
● Google Breakpad/Crashpad: They are the "gold standard" for native crash capture. They offer a complete toolchain for the full process from signal capture, Minidump generation, to background parsing. They serve as the technical cornerstone of many commercial solutions, but the cost of integration and backend setup is high.
● Firebase Crashlytics & Sentry: These commercial platforms (SaaS) provide an all-in-one "SDK + backend" service. They encapsulate the underlying capture mechanisms and provide a powerful backend for report aggregation, symbolication, and statistical analysis, greatly reducing the required skill threshold for developers.
● xCrash: This is a powerful open source library. It not only supports native and Java crashes, but also offers deep optimization of stack unwinding in various complex scenarios, delivering excellent information collection capabilities.
| Solution | Type | In-house R&D Cost | Scope of Crash Capture | Integration Method | Use Cases |
|---|---|---|---|---|---|
| Google Breakpad/Crashpad | Open source | Medium | • Native ✅ | Lightweight, no third-party services required | Suitable for teams with long-term maintenance capabilities |
| Firebase Crashlytics | SaaS | Low | • Native, Java ✅ | Firebase platform required | Suitable for quick integration into small and medium-sized projects |
| Sentry | SaaS | Low | • Native, Java ✅ | SaaS or private deployment | Recommended for teams with established backend infrastructure |
| xCrash | Open source | Medium | • Native, Java ✅ | Own backend required | Recommended for teams that prioritize controllability |
After comparative analysis, this article adopts Google Breakpad as the core technology for native crash capture. Breakpad uses the industry-standard Minidump format, which is a technically mature option widely adopted by globally leading products such as Chrome and Firefox. In terms of versatility, Breakpad performs well across core scenarios such as native crash capture, multi-architecture support, and cross-platform compatibility. Its supporting symbolication toolchains (such as dump_syms and minidump_stackwalk) are also well developed. Although Breakpad focuses on the native level, Java crashes can be handled using the UncaughtExceptionHandler method described above. Overall, it can cover all types of crashes.
The following three core technical challenges must be overcome to implement a reliable crash capture solution.
When a crash occurs, the entire process is already in a highly unstable, near-death state. Performing complex operations (e.g., network requests) at this moment carries high risks. We must ensure that the information logging process is both fast and adequately reliable. In this case, "synchronous writing and deferred reporting" is the optimal strategy. That is, the moment the crash is caught, the information is written synchronously to a local file in the fastest way; later, when the app launches normally, the file is read and the crash data is reported to the server.
Compared to Java crashes, native crash scene is more susceptible to corruption. Illegal memory operations may have contaminated the stack, causing traditional stack unwinding methods to fail. Therefore, simply recording a few register values is far from sufficient. What we need is a complete "live snapshot" that includes threads, registers, stack memory, loaded modules, etc. This is where the Minidump, a concept proposed by Breakpad, comes into play.
For security and size optimization, online code is usually obfuscated (ProGuard/R8). This converts class and method names in crash stack traces into meaningless ones like a, b, c, rendering them unreadable. For native code, binary files without symbolic information are released, and their stack traces appear as meaningless memory addresses. Therefore, symbolication is an essential step. We must generate and preserve the corresponding symbol mapping files (e.g., mapping.txt for Java code and so files for native code) during compilation. These files are then used to translate the "gibberish" back into readable and meaningful stack information on the server side.
To address all these challenges, we designed a unified exception capture solution that follows the lifecycle of "capture-persistence-reporting-symbolication". Whether it is a Java or native crash, the core task on the client side is to reliably save the crash scene information locally. Symbolication and analysis are performed on the server side.

We use Thread.setDefaultUncaughtExceptionHandler to catch Java/Kotlin exceptions. It is a callback interface, where the compiled bytecode is executed by ART, for both Java and Kotlin. When an uncaught exception is thrown, ART triggers the current thread's exception dispatch mechanism, ultimately invoking the registered uncaughtException method. Thread.setDefaultUncaughtExceptionHandler thus enables global exception capture for Java/Kotlin.
To capture Java crashes, we first set up a global uncaught exception handler. A handle is created by implementing the uncaughtException method of Thread.setDefaultUncaughtExceptionHandlertag, which can be set as the default handler for all threads. This gives us one last chance to save the situation before the app completely crashes—by logging the root cause of the crash. Note that we need to keep the original handler: originalHandler.
When a crash occurs, the handler gathers exception and key stack information, which is synchronously persisted in SharedPreferences. Since the process is about to terminate, the current step must be completed synchronously. Therefore, we also use synchronous commit (editor.commit()) to persist write cache. The asynchronous apply() method may not guarantee successful persistence. Key exception information includes:
● Timestamp: the exact time the crash occurred.
● Exception Type: NullPointerException or IndexOutOfBoundsException.
● Exception Message: the descriptive information contained in the exception object.
● Stack Trace: This is the most important part. It reveals the specific class and line of code in which the crash occurred.
● Thread Name: indicates whether the crash occurred in the main thread or a background thread.
The core policy is "report on next launch." It prevents attempts to upload crash data under unstable network conditions during an app crash, greatly improving the success rate. We call this check in the start() method. This method can be executed in a background thread to avoid blocking the app's main thread.

@Override
public void uncaughtException(Thread thread, Throwable throwable) {
    try {
        // Core challenge 1: Collect crash information.
        CrashData crashData = collectCrashData(thread, throwable);
        // Core challenge 2: Ensure that the data is synchronized and reliably preserved before process termination.
        saveCrashData(crashData);
    } finally {
        // Core challenge 3: Return control back to ensure execution of default system behaviors (such as pop-ups).
        if (originalHandler != null) {
            originalHandler.uncaughtException(thread, throwable);
        }
    }
}
private void saveCrashData(CrashData data) {
    // Use the synchronous commit() method in SharedPreferences.
    prefs.edit().putString("last_crash", data.toJson()).commit();
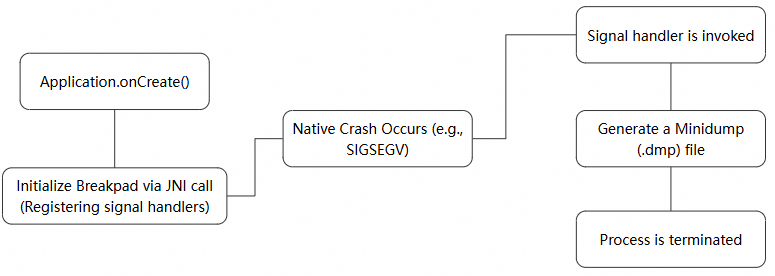
}For native crashes, we developed an integrated solution based on Breakpad. A native library is loaded at app launch, which specifies a signal handler for common crash signals.
.dmp (minidump) file to the dedicated directory..dmp files. If found, it calls a native method to parse the minidump file and extract stack information and other relevant information. The parsed data is then uploaded to our backend, and the dump file is deleted.
public void start() {
    // Core challenge 1: Initialize the signal handler of the native layer as early as possible.
    NativeBridge.initialize(crashDir.getAbsolutePath());
    // Core challenge 2: At the next launch, run asynchronous check and process the results of the last crash.
    new Thread(this::processExistingDumps).start();
}
private void processExistingDumps() {
    // Traverse the .dmp files in the specified directory.
    File[] dumpFiles = crashDir.listFiles();
    for (File dumpFile : dumpFiles) {
        // Upload the original .dmp file without parsing.
        reportToServer(dumpFile);
        dumpFile.delete();
    }
}
// JNI bridging serves as the only means of communication between the Java and C++ layers.
static class NativeBridge {
    // Load the so library that implements signal capture and minidump writing.
    static { System.loadLibrary("crash-handler"); }
    // JNI method to tell the C++ layer to start working.
    public static native void initialize(String dumpPath);
}
We can obtain a lot of exception information from the dump file. When using the dump file, pay attention to the following key information:
1. Exception Information
Exception Stream:
2. Thread List & States
3. Module List: all dynamic-link libraries (.so files on Android) and executables loaded by the process during the crash.
4. System Information
// Crash information.
Caused by: SIGSEGV /SEGV_ACCERR
// System information.
Kernel version: '0.0.0 Linux 6.6.66-android15-8-g807ce3b4f02f-ab12996908-4k #1 SMP PREEMPT Fri Jan 31 21:59:26 UTC 2025 aarch64' ABI: 'arm64'// Stack sample:#00 pc 0x3538 libtest-native.soCode obfuscation (e.g., using ProGuard/R8) is common in many online apps today to ensure security and reduce app size. This process renders the crash stack traces almost unreadable.
When an online app crashes, the captured stack traces are obfuscated and may look like this—almost useless to us:
java.lang.NullPointerException: Attempt to invoke virtual method 'void a.b.d.a.a(a.b.e.a)' on a null object reference
       at a.b.c.a.a(Unknown Source:8)
       at a.b.c.b.onClick(Unknown Source:2)
       at android.view.View.performClick(View.java:7448)
Now, let's break down how obfuscated stack traces are decoded:
When you enable code obfuscation in an Android project (usually by setting minifyEnabled to true in release builds) and package it, R8 generates a mapping.txt file under the build/outputs/mapping/release/ directory while processing the code, which can be used as a "dictionary".
The symbolication tool reads the aforesaid file and translates the obfuscated stack traces into the original file and method names line by line.
1. Read stack traces line by line: The tool reads each line of the obfuscated stack traces, such as at a.b.c.a.a(Unknown Source:8).
2. Decode key information: It extracts the key part from this line:
3. Search mapping.txt:
4. Restore the line number: R8 may inline methods or remove code during optimization, causing line numbers to change. The mapping.txt also contains mapping information for line numbers. The Retrace tool uses this information to accurately restore the obfuscated line numbers (e.g., 8) to the original source file line numbers.
5. Replacement and output: The tool replaces the obfuscated lines with symbolicated, readable lines.
Here is a line from the native stack traces we captured, which contains the following information:
#00 pc 0x3538 libtest-native.soHowever, with these stack traces, we are still unable to identify the specific file and method where the crash occurred. So we need to symbolicate the C++ stack traces to get readable crash information.
Following a similar approach to Java stack trace symbolication, symbolication of native stack traces is also a "lookup and translation" process. However, the "dictionary" used for translation in this case is not mapping.txt, but an unstripped library file instead, which contains DWARF debug information and matches exactly the online version: the libtest-native.so file; the "translation tool" is a command line utility such as addr2line provided by NDK. Run a command similar to the following:
 # Use the addr2line tool in the NDK
 # -C: Demangle C++ function names (for example, convert _Z... back to MyClass::MyMethod)
 # -f: Displays the function names
 # -e: Specify a library file containing symbols
addr2line -C -f -e /path/to/unstripped/libtest-native.so 0x3538
How addr2line works
After addr2line completes symbolication, it outputs the readable information we want, allowing us to pinpoint the specific file and method where the crash occurred:
CrashCore::makeArrayIndexOutOfBoundsException()
/xxx/xxx/xxx/android-demo/app/src/main/cpp/CrashCore.cpp:51In this article, we break down the fundamental principles underlying Android crash capture and introduce a capture scheme designed to tackle the three core technical challenges (i.e., when to capture, how to preserve the crash scene, and how to decode obfuscated stack traces). Whether it is the UncaughtExceptionHandler method for Java crashes or the signal handling and Minidump techniques for native crashes, the goal is the same: to reliably preserve the most valuable crash details before the process completely terminates. Alibaba Cloud's RUM SDK offers a non-intrusive solution to collect performance, stability, and user behavior data on Android. For integration details, see the official document. If you have any questions, you can join the RUM support DingTalk group (group ID: 67370002064) for consultation.
Nacos A2A Registry: AgentScope Enables Cross-Language and Cross-Framework Interoperability

675 posts | 56 followers
FollowAlibaba Cloud Native Community - March 11, 2026
Alibaba Cloud Native Community - November 21, 2025
Alibaba Cloud Native Community - December 24, 2025
Alibaba Cloud Native Community - December 10, 2025
Alibaba Cloud Native Community - November 11, 2025
Alibaba Cloud Native Community - March 4, 2026

675 posts | 56 followers
Follow Web Hosting Solution
Explore Web Hosting solutions that can power your personal website or empower your online business.
Learn More Web Hosting
Explore how our Web Hosting solutions help small and medium sized companies power their websites and online businesses.
Learn More Application Real-Time Monitoring Service
Build business monitoring capabilities with real time response based on frontend monitoring, application monitoring, and custom business monitoring capabilities
Learn More IDaaS
IDaaS
Make identity management a painless experience and eliminate Identity Silos
Learn MoreMore Posts by Alibaba Cloud Native Community