By Chenyu
This article introduces PolarDB-X proprietary protocol 2.0, also known as XRPC, covering its background, overall design, technical implementation details, and performance test results.
As a technical means to solve the complex communication requirements between compute nodes and data nodes in PolarDB-X, the PolarDB-X proprietary protocol was released as an important feature of the initial PolarDB-X 2.0 on Alibaba public cloud. In the PolarDB-X Lite, it also served as the only communication link with the backend data node and plays a vital role in the main link of database requests. However, with the development of PolarDB-X and the emergence of new demands, such as compatibility issues with data nodes 5.7 & 8.0, the network framework design of PolarDB-X proprietary protocol based on the MySQL X plugin began to show limitations. Therefore, it was imperative to reconstruct the code of the PolarDB-X proprietary protocol server on data nodes, which thus resulted in the development of XRPC.
PolarDB-X proprietary protocol aimed to address the problem of an exploding number of connections between compute nodes and data nodes. By decoupling connections from sessions, it optimizes the traditional MySQL session mechanism into an RPC-like mechanism, allowing multiple sessions to be transmitted over a single communication channel by using session IDs. Due to the urgent need for publishing at that time, the relatively challenging development of the data node side used the relatively mature MySQL X plugin for expansion and transformation. Based on the network processing and scheduling framework of MySQL X plugin, the development of the PolarDB-X proprietary protocol server end was completed. The following figure shows the architecture:
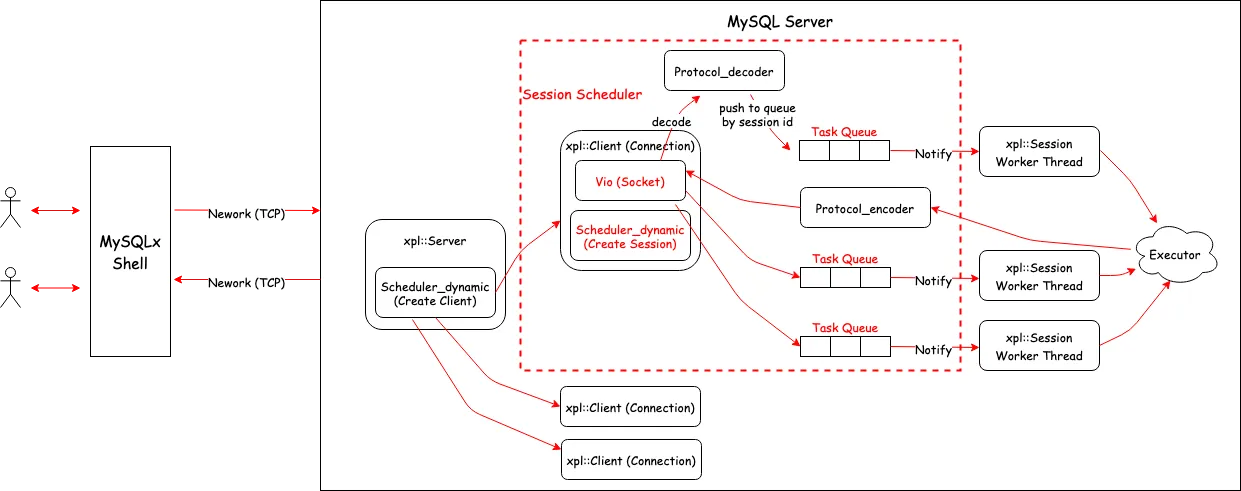
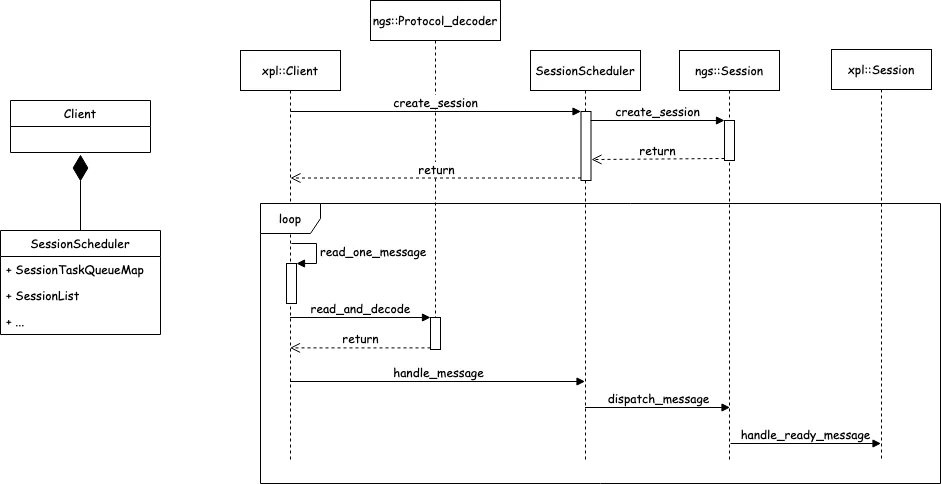
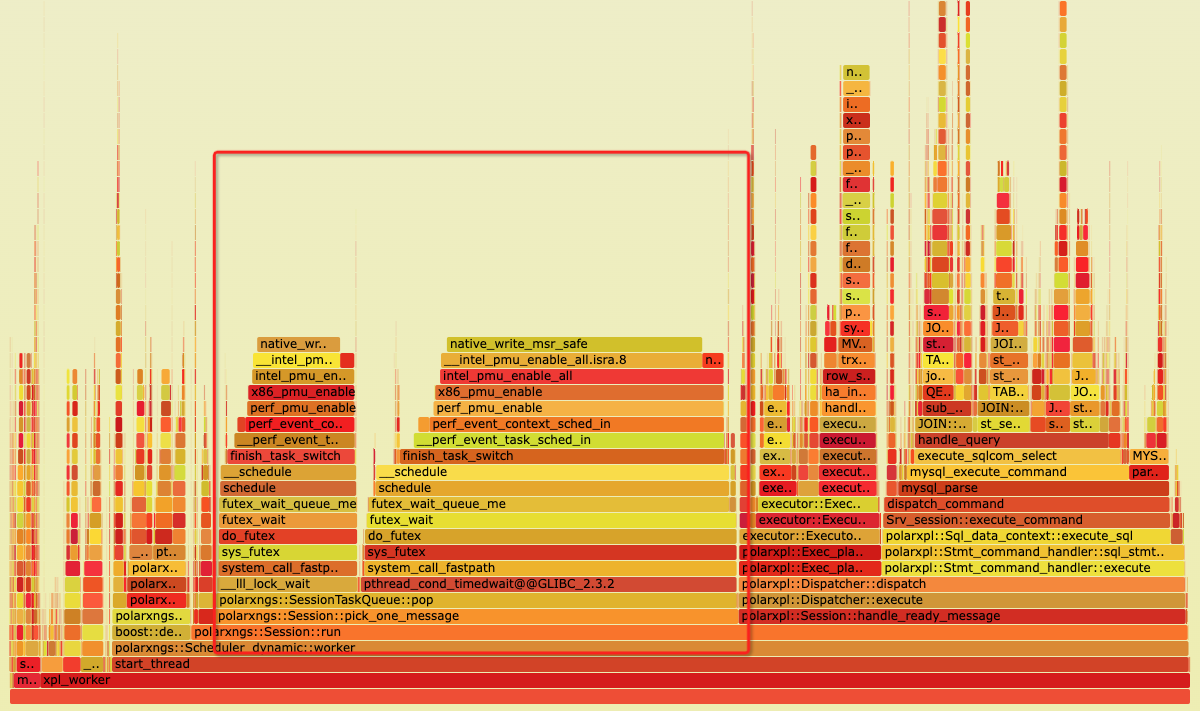
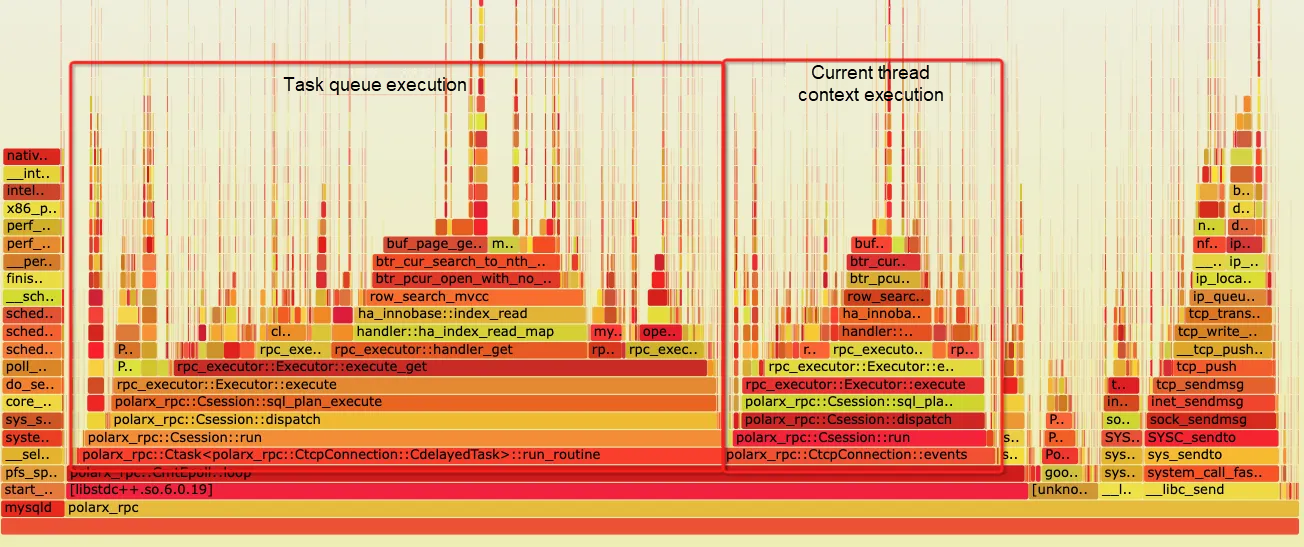
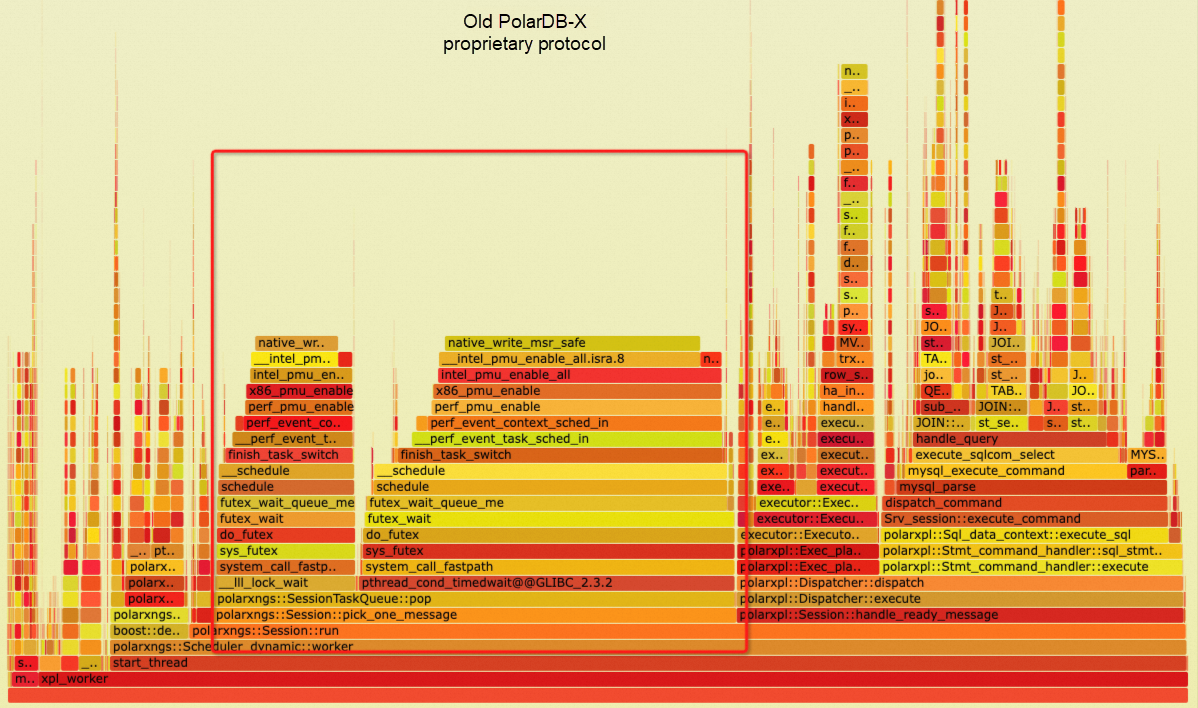
This network execution architecture helped resolve the backend connection explosion problem faced by PolarDB-X. Moreover, through the extension of protobuf messages, many advanced interaction features between compute nodes and data nodes were achieved, which contributed to the transformation of PolarDB-X from a traditional middleware model to a fully distributed database. However, this framework also has certain historical limitations. Since the MySQL X plugin is designed with the concept of one thread per connection, each processing session is bound to an execution thread, while request message reception is processed by an additional thread and distributed to the corresponding session worker thread. This processing mode causes some performance loss, particularly in high-concurrency and small-request TP scenarios where the transmission and scheduling of a large amount of thread messages can place considerable stress on the system. As shown in the figure below, task queue pop consumes a lot of CPU time:
Additionally, the socket handling model in MySQL is relatively simple. It primarily uses a non-block socket + ppoll for wait and control, and each thread only waits for a single socket. This design leads to significant performance degradation and resource consumption in ultra-large-scale clusters, so a multiplexing I/O model is urgently needed to handle this ultra-large-scale connection and request processing.
To solve the problems above, we decided to completely redesign the network processing framework and introduce a thread pool model, enabling full decoupling of connections, sessions, and execution threads in one stop. First, we investigated some existing high-performance network and asynchronous execution frameworks.
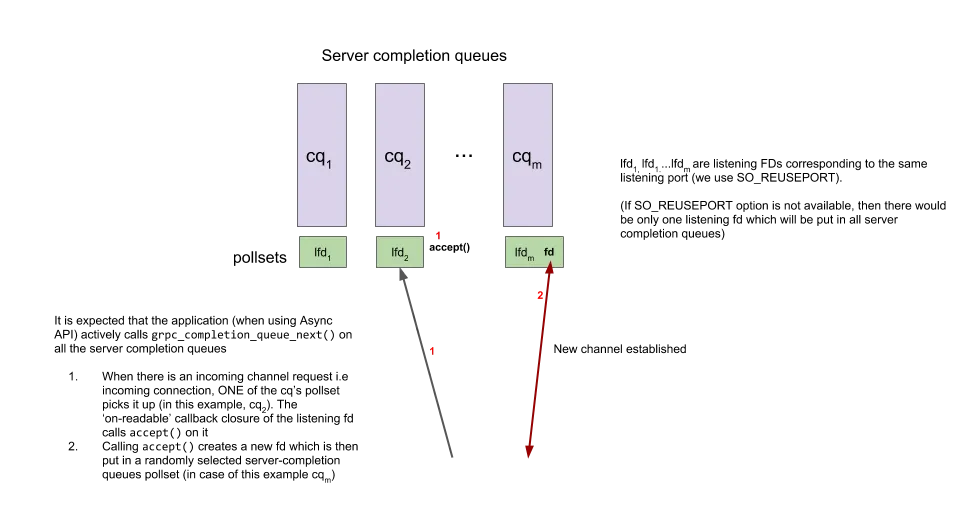
grpc-client-server-polling-engine-usage
gRPC is a standard model with multiple epoll complete queues. For listen sockets, if SO_REUSEPORT is supported, multiple sockets are enabled and bound to each epoll respectively. If not, a single socket is enabled and bound to all epolls. gRPC does not create internal threads. Instead, user threads wait for one (in fact, it is indirect listening, as described in the subsequent epoll model section). After accepting a new connection, the socket fd is randomly assigned to a complete queue.
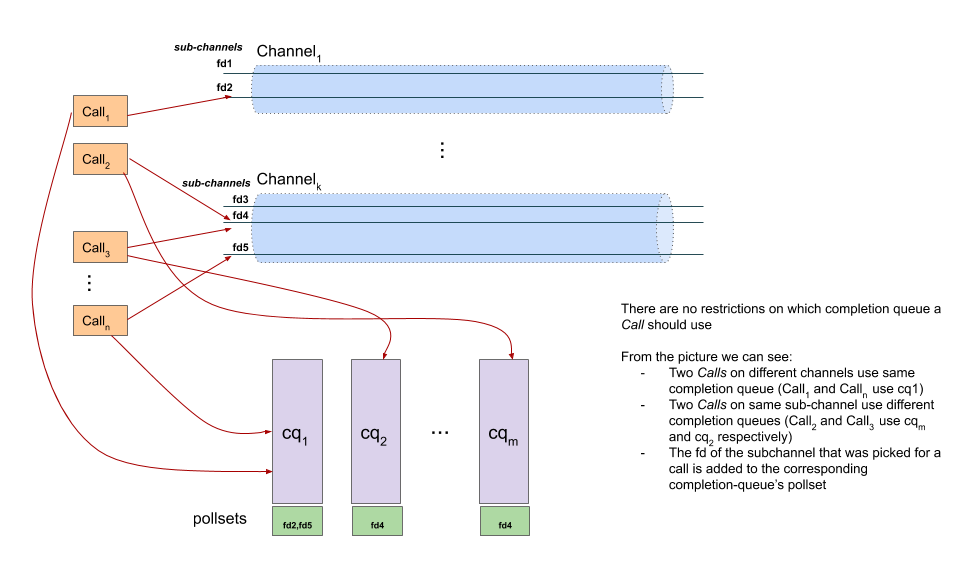
A client selects a socket in a channel as the TCP of the request and then binds it to a complete queue for processing.
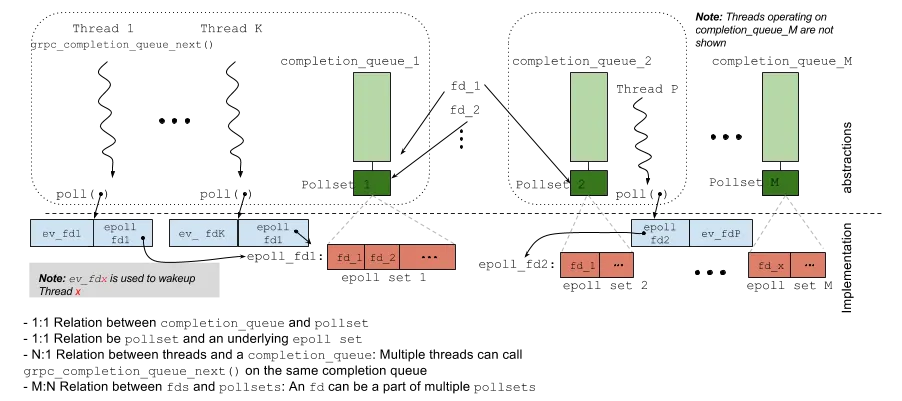
In gRPC's epoll model, each complete queue correspondingly implements an epoll fd set. The same fd may be registered in different epoll sets (complete queues). User threads call specific functions to poll and wait for the epoll. In the implementation, a poll is used to listen to one of its own fd (ev_fd as shown in the figure above) and the epoll fd (epoll fd1 as shown in the figure above). Since multiple threads are listening to the epoll fd, it's uncertain which thread will complete the event processing registered in the epoll. When the actual task is completed, the thread that waits for the corresponding event is woken up through ev_fd (in the client mode, the thread waiting for request processing is woken up and notified that the awaited event has been processed when another thread completes the task).
Such a design of gRPC has a bug known as the thundering herds. Standard epoll_wait() will only wake up one thread if an event is triggered during multi-thread waiting. In the gRPC model, since the thread is waiting on [ev_fd,epoll_fd] and is listening with poll, once any fd event in epoll is woken up, all threads poll on this complete queue will be woken up. In addition, fd may be bound to multiple complete queues, making a greater impact. This primarily occurs in server mode where the listen fd is bound to every complete queue and will be triggered when accepting. Additionally, when multiple threads process the same complete queue, thundering herds can be caused if an fd becomes readable.
To address this issue, gRPC introduces a new epoll set called polling island. This ensures that each awaited fd waits only on a single polling island, thus avoiding the thundering herd problem when an fd exists on multiple complete queues (we'll skip the details of the aggregation algorithm for polling island, but essentially, it creates a large epoll set where complete queues with the same fd wait on the same polling island). Furthermore, to avoid the thundering herd caused by poll on [ev_fd,epoll_fd], the approach is improved by changing to psi_wait on epoll, similar to how signals wake up the corresponding waiting threads.
Since gRPC needs to consider waking up specific waiting event threads and the possibility of multiple threads poll on the same complete queue, it uses a two-layered poll model (the improved psi_wait becomes a single-layer model). In the server model, since the service threads are equal and there's no need to wait for specific client responses, it can be simplified into a multi-threaded epoll_wait form, which is more efficient. Under the client model, we can learn the psi_wait model (under low concurrency, the probability of the specified waiting thread being woken up to process events is high, so reducing one layer of notification can lower additional costs).
The event framework of nodejs, similar to libevent and libev, uses a single-threaded epoll model where all non-blocking tasks are handled by callback functions, and blocking tasks are registered in epoll. For network server services, typically, the written data is processed and returned in this single thread, or it can be distributed to a task queue, but the actual writing of data still depends on the single thread of the processing event.
A common method to use multiple threads is to run multiple instances, similar to the gRPC approach, using SO_REUSEPORT to enable multiple listen sockets, each monitored by a separate epoll instance. Each epoll instance is processed by a single thread, or a single epoll can be listened to specifically, and accepted sockets are distributed to other epolls for processing.
Since each epoll has only one thread, the data structure is not thread-safe, so direct information interactions with the event queue require additional synchronization measures. If there is a hot connection (a connection with a particularly large number of requests and a particularly heavy computation), the corresponding processing thread of the event queue will slow down the response to other messages on the same epoll. Threads on other queues cannot share tasks.
Percona implements the Thread_pool_connection_handler to replace the native MySQL network processing model.
Specifically, it uses multiple thread pool instances, each with its own scheduling. Each thread pool has an epoll, and when the connection handler receives a request, the connection is registered in the epoll. The epoll is edge triggered in one shot mode, and registers the connection only when it's established or in an idle state. The first time the thread pool works, it selects one thread as the listener which is responsible for epoll_wait. When a request arrives, if the high-priority queue is empty, the listener thread will participate in request processing and then give up the listener role.
In summary, it's a fairly standard model with multiple instances and a single thread to perform epoll_wait and then distribute the request to a task queue. There's a special optimization for whether the listener thread involves data reading and processing (when the high-priority queue is empty, it participates in request processing to reduce RT caused by scheduling under low concurrency). If the queue is not empty, the task queue is pressed only for epoll events and does not actually reeceive, improving network response efficiency.
This thread pool model is designed with many factors considered and also optimized for various scenarios. However, under high concurrency and poor network conditions, the listener thread doesn't actually process incoming packets before delegating tasks to workers. Workers must then receive a complete request on the corresponding socket. In most cases, no issue occurs, but it can lead to long I/O wait times if the request is large or the network condition is poor. Additionally, the thread pool's waiting expansion mechanism can cause the pool to expand quickly.
A single-threaded epoll_wait + distribution is a standard model. As noted in the code comments, a listener thread that only distributes tasks but doesn't participate in processing is suboptimal because it adds an extra layer of data and needs to wake up the worker. Since gRPC adopts a multi-threaded epoll_wait approach, this pure server scenario is more suitable for stateless server threads, just ensuring at least one thread is waiting on epoll_wait and avoiding signal to wake up specific threads because the server inherently doesn't have such threads.
Based on our research findings, we designed a new multi-threaded event-driven network execution framework based on epoll for PolarDB-X proprietary protocol, internally named XRPC. The overall architecture is as follows:
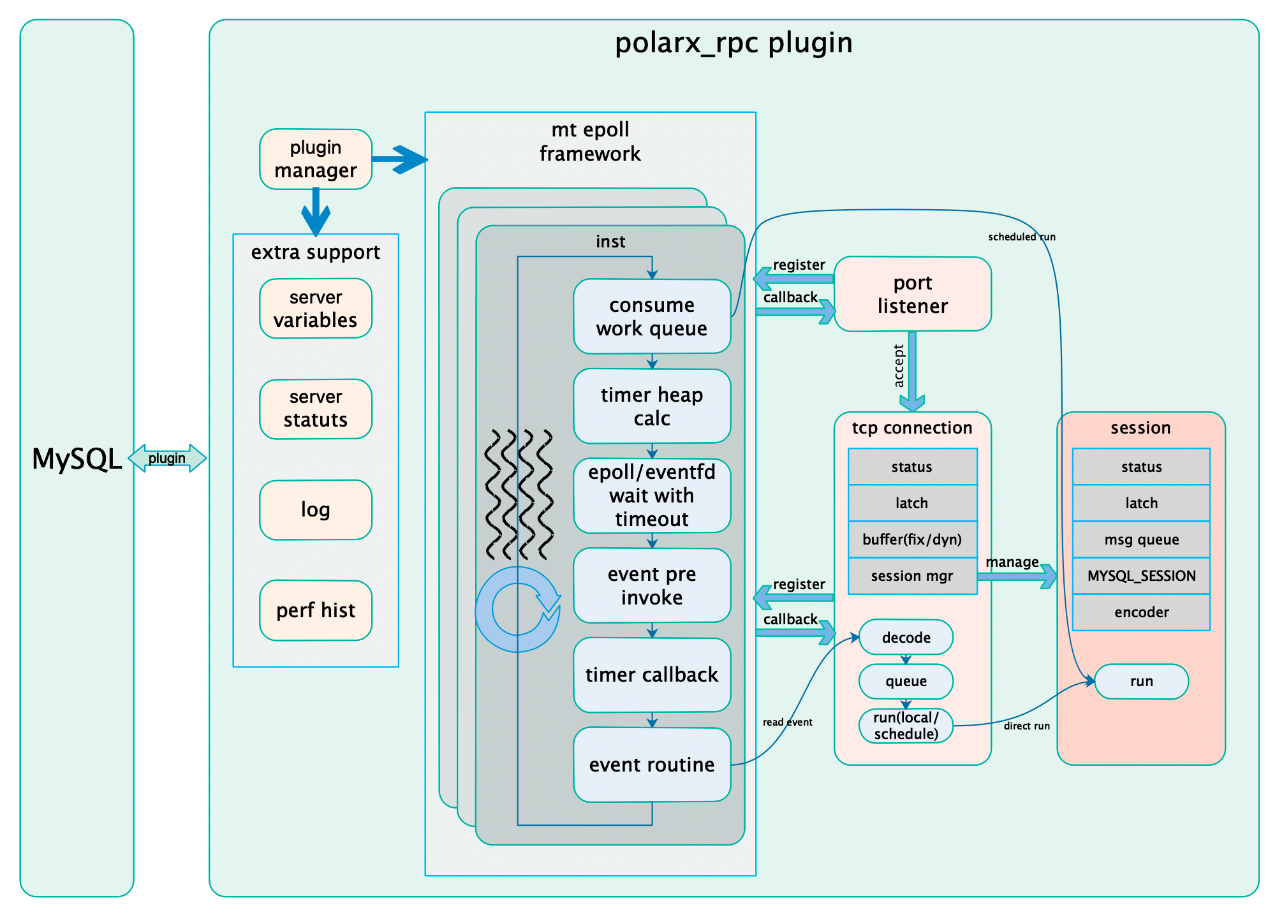
It has the following features:
It provides a dynamic thread pool design.
The epoll loop processing logic is similar to most event-driven asynchronous frameworks, consisting of a large loop. As a multi-threaded model, it aims to improve the performance of waiting and waking up in epoll (avoiding lock calls in epoll_wait across multiple threads) while ensuring the general availability of local task execution in a multi-threaded event-driven model. By default, it uses four threads as the base epoll threads, waiting on epoll and handling network events. Additional worker threads can wait on an eventfd, which is used to wake up threads when new tasks are added to the task queue. The eventfd is also registered on epoll as one of the wakeup conditions.
Unlike typical asynchronous event frameworks, the thread pool also handles database request execution, so a traditional task queue model cannot be used. This is because there are dependencies between database requests (such as lock waits between transactions), requiring the ability to dynamically increase threads to break wait conditions when there are more waits than the number of threads in the pool. At the same time, these threads can gracefully exit to complete the contraction of the thread pool.
For the multi-threaded event-driven framework, the following features are designed to improve performance:
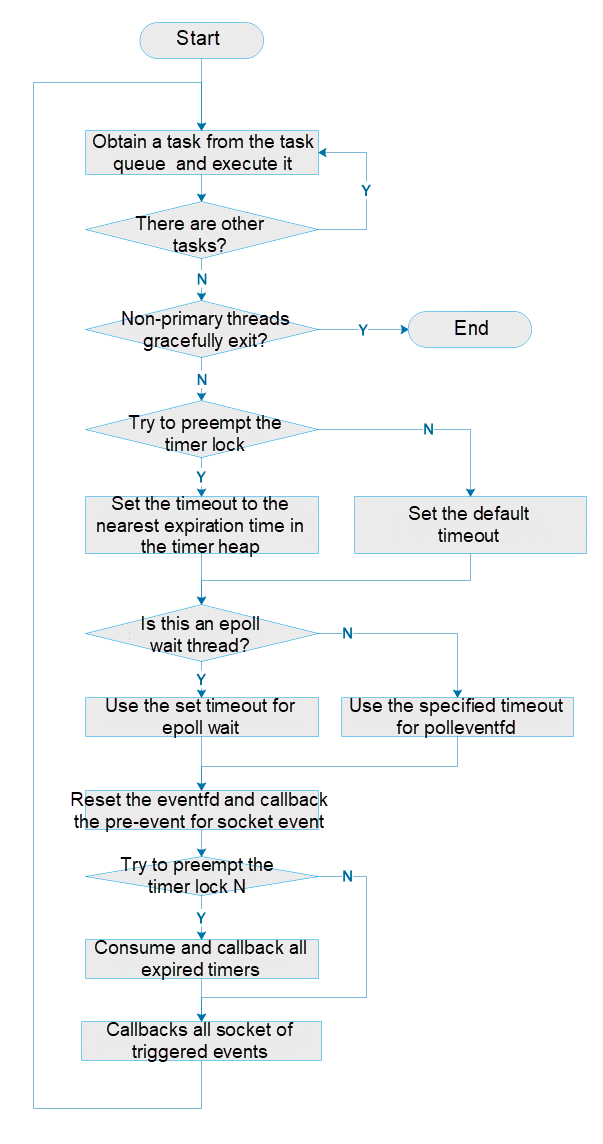
Core binding, as a common optimization technique for CPU-intensive tasks, is also included in XRPC with an automatic adaptive core binding strategy:
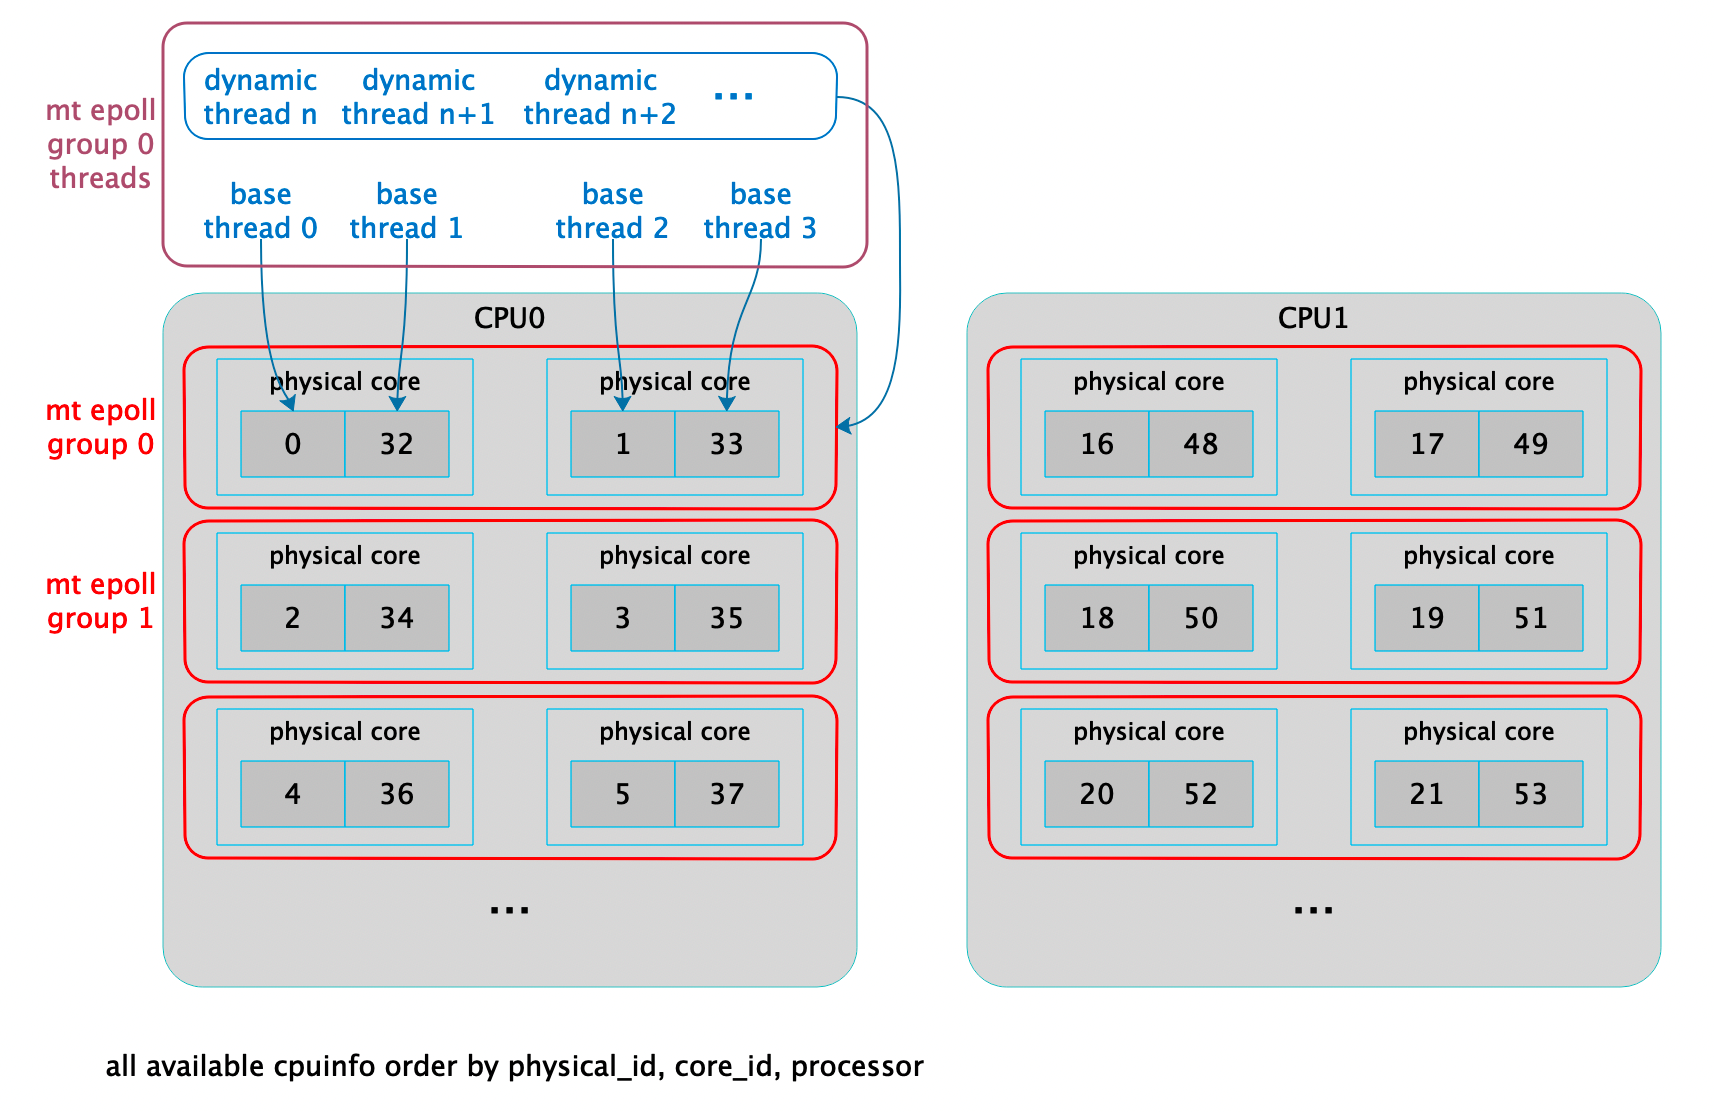
The lifecycle control of destructible objects in a multi-threaded event-driven framework can be challenging. Currently, most resources are managed in the unit of TCP connection, that is, the TCP context serves as the basic unit for lifecycle management. Due to the multi-threaded epoll model, after removing an fd, other threads that have been swapped out may still see the TCP context, potentially causing dangling ptr issues. To protect the TCP context, some measures are needed. Considering the complexity of EBR (epoch based reclamation) code, a ref cnt + delayed reclamation approach is used to protect TCP context. The delay is managed by a timer (with a timeout set to twice the maximum epoll timeout). After an epoll is triggered, the ref will be added through pre_event first to prevent the context from being prematurely released due to extended request processing times.
To avoid the thundering herd problem, the edge trigger mode is used in epoll for socket triggers, so only one thread is woken up to handle the packet upon reception. However, due to the nature of TCP packet processing and the multi-threaded epoll framework, multiple packets may be required to form a complete request. These multiple edge triggers may wake up different threads for processing, requiring a mechanism to ensure that only one thread handles multiple network packets for the same request under the same TCP connection. We use a spin lock try_lock to ensure that only one thread receives the packets and a recheck flag + retry to enable the first packet-receiving thread to continue receiving packets, preventing packet loss during processing. The full process is illustrated in the pseudocode below. The lock-free and wait-free design ensures that no thread resource is wasted in a lock-wait state (it can immediately handle other socket messages on the epoll).
/// Pseudocode
do {
  if (UNLIKELY(!read_lock_.try_lock())) {
    recheck_.store(true, std::memory_order_release);
    std::atomic_thread_fence(std::memory_order_seq_cst);
    if (LIKELY(!read_lock_.try_lock()))
      break; /// do any possible notify task
  }

  do {
    /// clear flag before read
    recheck_.store(false, std::memory_order_relaxed);

    RECV_ROUTINE;

    if (RECV_SUCCESS) {
      recheck_.store(true, std::memory_order_relaxed);

      DEAL_PACKET_ROUTINE;
    }

  } while (recheck_.load(std::memory_order_acquire));

  read_lock_.unlock();
  std::atomic_thread_fence(std::memory_order_seq_cst);
} while (UNLIKELY(recheck_.load(std::memory_order_acquire)));As mentioned earlier, the designed multi-threaded event-driven framework needs to perform execution scheduling optimally under different task loads. Therefore, a series of targeted processing strategies and optimizations are required for database requests, which mainly include the following points:
/// dealing notify or direct run outside the read lock.
if (!notify_set.empty()) {
  /// last one in event queue and this last one in notify set,
  /// can run directly
  auto cnt = notify_set.size();
  for (const auto &sid : notify_set) {
    if (0 == --cnt && index + 1 == total) {
      /// last one in set and run directly
      DBG_LOG(("tcp_conn run session %lu directly", sid));
      auto s = sessions_.get_session(sid);
      if (s)
        s->run();
    } else {
      /// schedule in work task
      DBG_LOG(("tcp_conn schedule task session %lu", sid));
      epoll_.push_work((new CdelayedTask(sid, this))->gen_task());
    }
  }
}
Considering that packets are generally not very large in normal scenarios, a blocking model is adopted (most query result sets TCP sndbuf can fit, and for large result sets, there are external flow control and buffering mechanisms in place to ensure minimal impact even if blocking occurs). At the same time, an external mutext is used to avoid cross-session mixing packets and ensure data correctness after session decoupling. At the same time, each session has a built-in encoder with its own buffer pool. When it is full or needs to be flushed, it uses a TCP lock to send, ensuring encoder performance while minimizing the time of locking the TCP channel. The following code shows how to handle various errors of send.
inline int wait_send() {
  auto timeout = net_write_timeout;
  if (UNLIKELY(timeout > MAX_NET_WRITE_TIMEOUT))
    timeout = MAX_NET_WRITE_TIMEOUT;
  ::pollfd pfd{fd_, POLLOUT | POLLERR, 0};
  return ::poll(&pfd, 1, static_cast<int>(timeout));
}

/// blocking send
bool send(const void *data, size_t length) final {
  if (UNLIKELY(fd_ < 0))
    return false;
  auto ptr = reinterpret_cast<const uint8_t *>(data);
  auto retry = 0;
  while (length > 0) {
    auto iret = ::send(fd_, ptr, length, 0);
    if (UNLIKELY(iret <= 0)) {
      auto err = errno;
      if (LIKELY(EAGAIN == err || EWOULDBLOCK == err)) {
        /// need wait
        auto wait = wait_send();
        if (UNLIKELY(wait <= 0)) {
          if (wait < 0)
            tcp_warn(errno, "send poll error");
          else
            tcp_warn(0, "send net write timeout");
          fin();
          return false;
        }
        /// wait done and retry
      } else if (EINTR == err) {
        if (++retry >= 10) {
          tcp_warn(EINTR, "send error with EINTR after retry 10");
          fin();
          return false;
        }
        /// simply retry
      } else {
        /// fatal error
        tcp_err(err, "send error");
        fin();
        return false;
      }
    } else {
      retry = 0; /// clear retry
      ptr += iret;
      length -= iret;
    }
  }
  return true;
}In MySQL, an external session object MYSQL_SESSION, is provided, and in XRPC, the session is a wrapper for MYSQL_SESSION. In addition, XRPC has made the following optimizations to adapt to its communication with compute nodes:
The result set encoder is refactored with the inspiration from the latest design concepts in the MySQL X plugin. The following optimizations are also made during the refactoring:
template <> struct Fixint_length<8> {
  template <uint64_t value> static void encode(uint8_t *&out) { // NOLINT
#if defined(__BYTE_ORDER__) && (__BYTE_ORDER__ == __ORDER_BIG_ENDIAN__)
    *reinterpret_cast<uint64_t *>(out) = __builtin_bswap64(value);
    out += 8;
#else
    *reinterpret_cast<uint64_t *>(out) = value;
    out += 8;
#endif
  }

  static void encode_value(uint8_t *&out, const uint64_t value) { // NOLINT
#if defined(__BYTE_ORDER__) && (__BYTE_ORDER__ == __ORDER_BIG_ENDIAN__)
    *reinterpret_cast<uint64_t *>(out) = __builtin_bswap64(value);
    out += 8;
#else
    *reinterpret_cast<uint64_t *>(out) = value;
    out += 8;
#endif
  }
};
}Two important features of PolarDB-X proprietary protocol are execution plan transmission and columnar data transmission.
XRPC has ported it and optimized some coding to improve its compatibility and fix some long-standing bugs.
To achieve optimal performance across different platforms, specifications, and loads, XRPC provides numerous adjustable parameters:
| Variable | Value | Default | Description |
|---|---|---|---|
| polarx_rpc_enable_perf_hist | [ON/OFF] | OFF | Whether to enable XRPC performance statistics histograms (used for performance tuning) |
| polarx_rpc_enable_tasker | [ON/OFF] | ON | Whether to allow thread pool expansion |
| polarx_rpc_enable_thread_pool_log | [ON/OFF] | ON | Whether to enable thread pool log |
| polarx_rpc_epoll_events_per_thread | [1-16] | 4 | Number of epoll events processed by each epoll thread |
| polarx_rpc_epoll_extra_groups | [0-32] | 0 | Additional number of epoll thread pool groups (generally not configured) |
| polarx_rpc_epoll_group_ctx_refresh_time | [1000-60000] | 10000 | Shared session refresh time for each epoll thread pool group, which is used to release timeout sessions (unit: ms with the default value 10) |
| polarx_rpc_epoll_group_dynamic_threads | [0-16] | 0 | Expected number of non-basic (dynamically extended) threads in each epoll thread pool group (generally set to 0) |
| polarx_rpc_epoll_group_dynamic_threads_shrink_time | [1000-600000] | 10000 | Latency of non-basic (dynamically extended) threads to contract in the epoll thread pool group, which is used to determine the duration of extended threads with high-concurrency loads (unit: ms with the default value 10) |
| polarx_rpc_epoll_group_tasker_extend_step | [1-50] | 2 | Step size for extending the thread pool based on queued tasks when concurrency increases (how many threads are added for each expansion) |
| polarx_rpc_epoll_group_tasker_multiply | [1-50] | 3 | Threshold factor for extending the thread pool based on queued tasks when concurrency increases, that is, the pool will be extended when queued tasks > this factor * number of working threads |
| polarx_rpc_epoll_group_thread_deadlock_check_interval | [1-10000] | 500 | Deadlock detection time to check if deadlocks occur due to internal transactions or other external waiting dependencies (unit: ms with the default value 500) |
| polarx_rpc_epoll_group_thread_scale_thresh | [0-100] | 2 | Thread pool expansion mechanism based on thread wait reason analysis, which is used to specify the minimum number of threads that must be waiting before expansion (the actual maximum number: the basic thread number -1, the minimum number: 0, and the default value: 2) |
| polarx_rpc_epoll_groups | [0-128] | 0 | Default number of epoll groups, which is automatically calculated based on the core number and the basic thread number per group (default value: 0). Consider whether the epoll has a large lock or disperses the groups. |
| polarx_rpc_epoll_threads_per_group | [1-128] | 4 | Number of threads in each epoll group. A smaller number reduces lock conflicts but may hinder the automatic scheduling capabilities of the thread pool. (default value: 4) |
| polarx_rpc_epoll_timeout | [1-60000] | 10000 | Timeout period for each call to epoll (unit: ms with the default value 10) |
| polarx_rpc_epoll_work_queue_capacity | [128-4096] | 256 | Depth of the task queue for each epoll group |
| polarx_rpc_force_all_cores | [ON/OFF] | OFF | Whether to break the execution core limitation and bind to all CPU cores (default: not allowed) |
| polarx_rpc_galaxy_protocol | [ON/OFF] | OFF | Whether to enable the galaxy protocol (default: disabled) |
| polarx_rpc_galaxy_version | [0-127] | 0 | Galaxy protocol version |
| polarx_rpc_max_allowed_packet | [4096-1073741824] | 67108864 | Maximum packet limit for XRPC (default value: 64 MB) |
| polarx_rpc_max_cached_output_buffer_pages | [1-256] | 10 | Default output buffer size for each session (unit: page with each of 4 KB, default: 10 pages) |
| polarx_rpc_max_epoll_wait_total_threads | [0-128] | 0 | Maximum number of threads allowed to wait for epoll, which is automatically calculated (default value: 0), that is, the number of epoll groups * the number of basic threads per epoll |
| polarx_rpc_max_queued_messages | [16-4096] | 128 | Maximum depth of queued pipeline requests allowed per session |
| polarx_rpc_mcs_spin_cnt | [1-10000] | 2000 | Spin times for the MCS spinlock used internally (default value: 2000, and a larger number than 2000 will lead to the yield) |
| polarx_rpc_min_auto_epoll_groups | [1-128] | 5.7 16 8.0 32 | Automatically calculated minimum number of epoll groups |
| polarx_rpc_multi_affinity_in_group | [ON/OFF] | OFF (ON by default if deployed on Alibaba Cloud) | Whether to allow threads within an epoll group to bind to multiple core. Enabling this can alleviate the skewed long-tail in TPC-H with multiple large tasks. |
| polarx_rpc_net_write_timeout | [1-7200000] | 10000 | Network write timeout (unit: ms with the default value of 10) |
| polarx_rpc_request_cache_instances | [1-128] | 16 | Number of groups for the SQL/Xplan cache, which is used to reduce lock conflicts (default value: 16) |
| polarx_rpc_request_cache_max_length | [128-1073741824] | 1048576 | Maximum request size allowed to be cached (unit: byte, and SQL requests smaller than 1 MB are cached bu default) |
| polarx_rpc_request_cache_number | [128-16384] | 1024 | Number of cached slots for the SQL/Xplan cache, with separate spaces for SQL and Xplan (default: 1024 slots for each) |
| polarx_rpc_session_poll_rwlock_spin_cnt | [1-10000] | 1 | Spin times for the RW spinlock (default value: 1, and a larger number than 1 will lead to the yield) |
| polarx_rpc_shared_session_lifetime | [1000-3600000] | 60000 | Maximum lifetime of a shared session per epoll group |
| polarx_rpc_tcp_fixed_dealing_buf | [4096-65536] | 4096 | Parsing buffer size for each TCP connection (unit: byte with the default value of 4 K) |
| polarx_rpc_tcp_keep_alive | [1-7200] | 30 | TCP keep alive parameter (unit: second with the default value of 30) |
| polarx_rpc_tcp_listen_queue | [128-4096] | 128 | Depth of the TCP accept queue with the default value of 128 |
| polarx_rpc_tcp_recv_buf | [0-2097152] | 0 | TCP recv buffer with the default value of 0, which uses the system's default value |
| polarx_rpc_tcp_send_buf | [0-2097152] | 0 | TCP send buffer with the default value of 0, which uses the system's default value |
| rpc_port | [0-65536] | 33660 | XRPC port number |
| rpc_use_legacy_port | [ON/OFF] | ON | Whether to use the polarx_port value as the port number in compatibility mode |
To ensure that the running states at runtime can be observed, XRPC provides some global variables for monitoring internal thread numbers and session numbers:
| Global state variables | Description | Example |
|---|---|---|
| polarx_rpc_inited | Whether XRPC is started successfully | ON |
| polarx_rpc_plan_evict | Number of eliminations in xplan cache LRU | 123 |
| polarx_rpc_plan_hit | Number of hits in xplan cache LRU | 4234244 |
| polarx_rpc_plan_miss | Number of misses in xplan cache LRU | 42424 |
| polarx_rpc_sql_evict | Number of eliminations in SQL cache LRU | 123 |
| polarx_rpc_sql_hit | Number of hits in SQL cache LRU | 4234244 |
| polarx_rpc_sql_miss | Number of misses in SQL cache LRU | 42424 |
| polarx_rpc_tcp_closing | Number of TCP being closed | 0 |
| polarx_rpc_tcp_connections | Number of current TCP | 32 |
| polarx_rpc_threads | Number of total threads in XRPC | 64 |
| polarx_rpc_total_sessions | Number of total sessions in XRPC (including shared sessions) | 38 |
| polarx_rpc_worker_sessions | Number of working sessions in XRPC (backend sessions for CN) | 32 |
Due to the complexity of internal scheduling, XRPC provides a high-precision internal clock to measure duration histograms of each stage, which helps identify performance issues and fine-tune.
mysql> show variables like '%perf_hist%';
+-----------------------------+-------+
| Variable_name               | Value |
+-----------------------------+-------+
| polarx_rpc_enable_perf_hist | OFF   |
+-----------------------------+-------+
1 row in set (0.00 sec)

mysql> set global polarx_rpc_enable_perf_hist = 'ON';
Query OK, 0 rows affected (0.01 sec)

mysql> show variables like '%perf_hist%';
+-----------------------------+-------+
| Variable_name               | Value |
+-----------------------------+-------+
| polarx_rpc_enable_perf_hist | ON    |
+-----------------------------+-------+
1 row in set (0.00 sec)

mysql> call xrpc.perf_hist('all')\G
The preceding command enables runtime histograms for network, scheduling, and execution phases, primarily including:
Sample data is shown as follows by using an exponential segmented histogram, which facilitates the analysis of response distributions and long-tail scenarios.

By specifying different statistics items when calling the cache, individual histograms can be displayed, and all five histograms can also be displayed by all. The command call xrpc.perf_hist('reset'); resets the histograms, making it easier to observe duration distributions of the steady state after the stress test stabilizes.
During the development process, XRPC also draws on the implementation of different high-performance data structures to provide optimal performance experience in the network and scheduling:
For the thread scheduling optimization, we evaluate and confirm it by flame graphs.
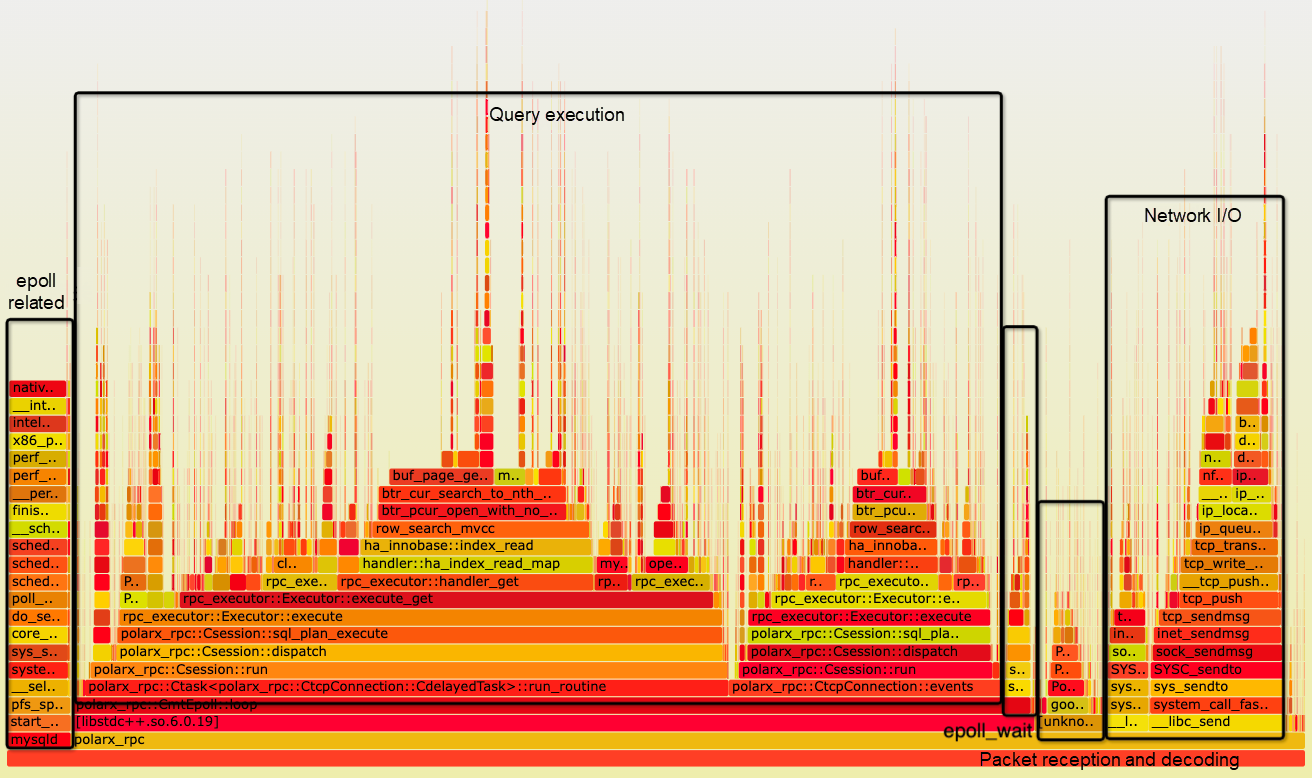
From the flame graph for the XRPC point query stress test above, we can see that request execution CPU usage has increased to 71.79%, indicating good utilization of CPU resources. Compared with the flame graph for the old proprietary protocol at the beginning of the article, there is a significant improvement in CPU utilization.
The following figure shows the flame graph for MySQL SQL protocol point query stress test under MySQL Connector/JDBC, with an effective CPU utilization rate of 64.94%, which is lower than the utilization under XRPC.
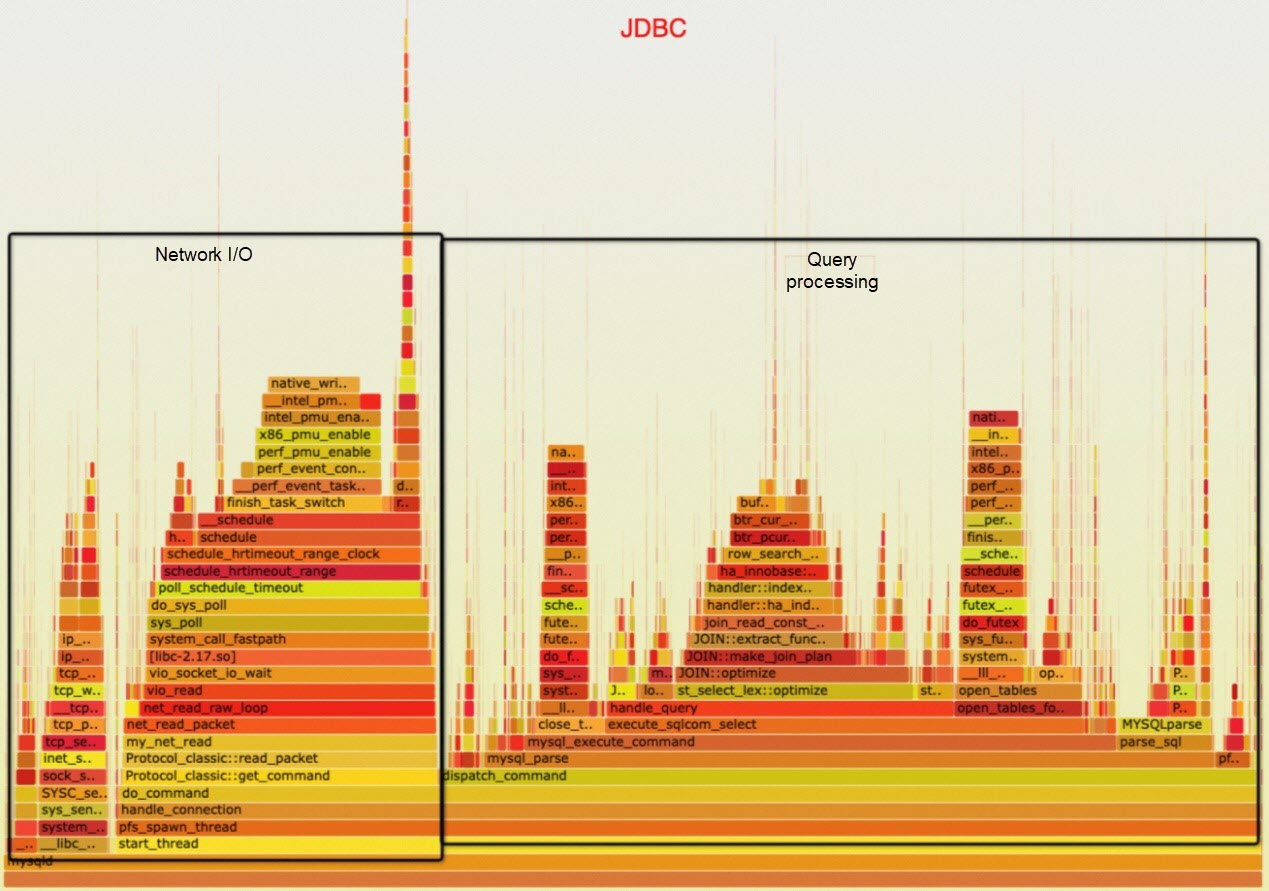
The most direct way to evaluate the packet sending and receiving capability of a network framework is to write an echo server for a stress test. Here, we compare the network execution framework of XRPC with the commonly used libeasy within Alibaba Group. The libeasy code is located in the libeasy_bench directory. The results are as follows: the test environment is a 64 core physical machine, and XRPC slightly outperforms libeasy in 64 thread synchronous mode.
| Concurrency | XRPC | libeasy async 16 listen 64 worker | libeasy async 64 listen 64 worker | libeasy sync 64 threads |
| 2 | 55414.457 | 37486.25 | 37564.242 | 52956.703 |
| 4 | 107255.27 | 73971.2 | 74943.016 | 106999.3 |
| 8 | 203521.3 | 145596.88 | 146340.73 | 208922.2 |
| 16 | 392131.56 | 274835.03 | 276866.94 | 390191.97 |
| 32 | 703287.0 | 480919.72 | 481255.5 | 715153.44 |
| 64 | 1175622.9 | 799120.2 | 757774.44 | 1221337.8 |
| 128 | 1837832.9 | 1047939.56 | 1157251.1 | 1844174.2 |
| 256 | 2649329.2 | 1345222.0 | 1550693.4 | 2556187.2 |
| 512 | 3291273.0 | 1397924.2 | 1342323.6 | 3182367.2 |
| 1024 | 612264.8 | 1360113.9 | 1440107.8 | 3415289.2 |
Compare the performance of the new and old proprietary protocols and JDBC for select 1. The new architecture has higher performance and can run stably under high concurrency.
| Concurrency | JDBC | Old architecture | New architecture |
| 2 | 29719.084 | 26994.299 | 29986.0 |
| 4 | 63485.3 | 59082.09 | 66999.305 |
| 8 | 126720.66 | 115059.984 | 126951.61 |
| 16 | 242323.53 | 217389.78 | 232871.14 |
| 32 | 448065.38 | 366213.53 | 423825.47 |
| 64 | 753734.6 | 588699.25 | 733777.9 |
| 128 | 733777.9 | 821294.5 | 1150645.6 |
| 256 | 1182257.2 | 966579.4 | 1473572.4 |
| 512 | 1473572.4 | 843260.1 | 1555356.1 |
| 1024 | 1147890.2 | 825537.44 | 1514292.5 |
| 2048 | - | - | 1455882.8 |
| 4096 | - | - | 1200290.2 |
| Concurrency | JDBC | Old architecture | New architecture |
| 2 | 36907.62 | 33711.63 | 36453.35 |
| 4 | 80340.96 | 67205.28 | 79440.055 |
| 8 | 159827.02 | 137136.58 | 156556.69 |
| 16 | 299065.2 | 264378.7 | 298600.28 |
| 32 | 582958.06 | 506158.16 | 538147.75 |
| 64 | 987595.2 | 854529.56 | 917313.56 |
| 128 | 1383830.9 | 1195628.9 | 1348939.5 |
| 256 | 1622596.8 | 1554815.1 | 1685460.8 |
| 512 | 1799647.1 | 1470166.8 | 1941278.5 |
| 1024 | 1815061.2 | 916179.2 | 2084961.6 |
| 2048 | 1673776.8 | - | 2008663.9 |
| 4096 | - | - | 1820561.0 |
| Concurrency | 64c JDBC | 64c xrpc+xplan | 64c xrpc+sql | 104c JDBC | 104c xrpc+xplan | 104c xrpc+sql |
| 2 | 16578.027 | 23809.62 | 17772.223 | 25471.36 | 32103.791 | 25454.455 |
| 4 | 36202.38 | 47754.45 | 37122.574 | 54391.56 | 62056.797 | 54073.594 |
| 8 | 71760.65 | 97431.516 | 73274.34 | 106510.695 | 127509.5 | 106510.695 |
| 16 | 137715.45 | 176151.16 | 137329.8 | 195314.94 | 245143.45 | 196580.03 |
| 32 | 254749.1 | 311442.44 | 239416.25 | 367031.2 | 415063.97 | 356066.56 |
| 64 | 413138.38 | 526345.1 | 407636.72 | 640735.9 | 721447.75 | 604598.06 |
| 128 | 502932.12 | 720127.94 | 570637.7 | 919598.2 | 1052270.2 | 939035.44 |
| 256 | 539180.5 | 843516.9 | 628808.2 | 1084268.9 | 1281496.0 | 1163551.5 |
| 512 | 534332.7 | 854824.5 | 610362.25 | 1100764.5 | 1340563.2 | 1220010.0 |
| 1204 | 510401.28 | 843499.75 | 623204.1 | 1040283.5 | 1320433.1 | 1187091.4 |
| 2048 | - | 835596.94 | 597368.94 | - | 1241896.4 | 1102568.6 |
| 4096 | - | 771388.9 | 527704.0 | - | 1131214.1 | 987188.8 |
The following figures show the performance comparison between the old and new proprietary protocols after purchasing a 4*8c64g instance from the Alibaba Cloud official website and configuring it according to the official test documentation.
Performance Comparison in Sysbench DRDS Mode

Performance Comparison in Sysbench Non-partitioned Table Scatter Mode

Performance Comparison in TPC-C DRDS Mode

Performance Comparison in TPC-C Auto Mode

For the performance of different instance types, see the performance data of version 5.4.17 in the following performance test documents:
The PolarDB-X proprietary protocol 2.0, also known as XRPC, completely restructures the proprietary protocol network, scheduling, and execution framework on the data node. It achieves the decoupling of connections, sessions, and threads and fully eliminates the dependency on the MySQL X plugin, becoming a completely independent plugin. It also implements a unified codebase compatible with MySQL 5.7 and 8.0, which significantly enhances the maintainability and autonomy of the code. Additionally, it optimizes and improves limitations in the original design, boosts the general performance for OLTP-type requests, and provides more possibilities for adding new features in the future.
Try out database products for free:
ApsaraDB - June 19, 2024
ApsaraDB - January 3, 2024
ApsaraDB - March 17, 2025
ApsaraDB - July 30, 2024
ApsaraDB - June 12, 2024
ApsaraDB - June 5, 2024
 PolarDB for PostgreSQL
Alibaba Cloud PolarDB for PostgreSQL is an in-house relational database service 100% compatible with PostgreSQL and highly compatible with the Oracle syntax.
Learn More PolarDB for Xscale
Alibaba Cloud PolarDB for Xscale (PolarDB-X) is a cloud-native high-performance distributed database service independently developed by Alibaba Cloud.
Learn More PolarDB for MySQL
Alibaba Cloud PolarDB for MySQL is a cloud-native relational database service 100% compatible with MySQL.
Learn More Resource Management
Organize and manage your resources in a hierarchical manner by using resource directories, folders, accounts, and resource groups.
Learn MoreMore Posts by ApsaraDB