Use TPC-C benchmark tests to measure the Online Transaction Processing (OLTP) performance of a PolarDB-X instance running MySQL 5.7 or MySQL 8.0. Follow this procedure to reproduce the benchmark and evaluate your instance configuration.
These tests are based on the TPC-C benchmark but do not satisfy all benchmark requirements. Results cannot be compared with officially published TPC-C benchmark results.
Background
TPC-C is an OLTP benchmark developed by the Transaction Processing Performance Council (TPC). It simulates a wholesale supplier environment with 10 tables and five transaction types: NewOrder, Payment, OrderStatus, Delivery, and StockLevel. Performance is measured in tpmC (transactions per minute C), which counts NewOrder transactions per minute and represents the maximum qualified throughput (MQTh) of the system.
Test environment
PolarDB-X instance specifications
| Instance specs | Number of nodes |
|---|---|
| 4C32G | 2 |
| 4C32G | 4 |
| 8C64G | 2 |
| 8C64G | 4 |
Stress test machine
| Attribute | Value |
|---|---|
| Instance type | ecs.g6.8xlarge |
| Specs | 32 vCPUs, 128 GB memory |
Test data volume
Based on 1,000 warehouses:
| Table | Rows |
|---|---|
| bmsql_order_line | 300 million |
| bmsql_stock | 100 million |
| bmsql_customer | 30 million |
| bmsql_history | 30 million |
| bmsql_oorder | 30 million |
Test results
Review these results to select a configuration before running your own test. All tpmC values are from 5-minute runs with 1,000 warehouses.
MySQL 5.7
Version: polardb-2.4.0_5.4.19-20240610_xcluster5.4.19-20240527. For more information, see Release notes.
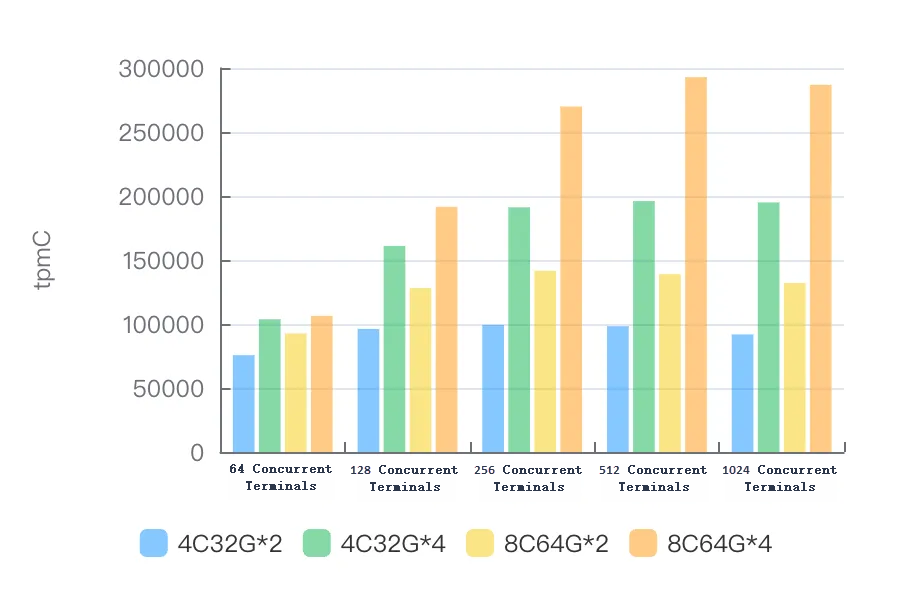
| Instance specs | 64 terminals | 128 terminals | 256 terminals | 512 terminals | 1024 terminals |
|---|---|---|---|---|---|
| 4C32G\*2 | 75,655.51 | 96,178.92 | 99,315.74 | 98,272.41 | 91,849.33 |
| 4C32G\*4 | 103,698.48 | 160,964.59 | 191,213.08 | 196,013.09 | 194,955.20 |
| 8C64G\*2 | 92,608.23 | 128,178.78 | 141,578.84 | 138,943.08 | 132,062.62 |
| 8C64G\*4 | 106,394.60 | 191,550.55 | 269,927.62 | 292,926.91 | 286,841.81 |
MySQL 8.0
Version: polardb-2.4.0_5.4.19-20240610_xcluster8.4.19-20240523. For more information, see Release notes.
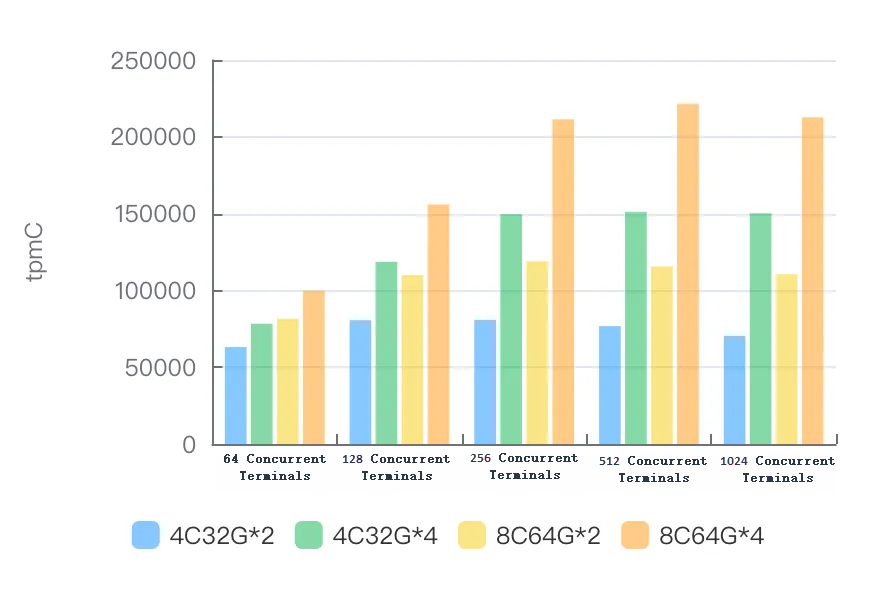
| Instance specs | 64 terminals | 128 terminals | 256 terminals | 512 terminals | 1024 terminals |
|---|---|---|---|---|---|
| 4C32G\*2 | 63,102.89 | 80,591.88 | 80,843.53 | 76,747.57 | 70,397.38 |
| 4C32G\*4 | 78,316.27 | 118,637.24 | 149,567.59 | 151,138.05 | 150,177.41 |
| 8C64G\*2 | 81,533.11 | 109,978.06 | 118,902.41 | 115,632.36 | 110,539.75 |
| 8C64G\*4 | 99,772.56 | 155,959.31 | 211,403.16 | 221,496.06 | 212,633.02 |
Prerequisites
Before you begin, ensure that you have:
An Alibaba Cloud account with permissions to create ECS and PolarDB-X instances
Access to the Alibaba Cloud console
Run the TPC-C test
Step 1: Create an ECS instance
Create an Elastic Compute Service (ECS) instance with 32 vCPUs and 128 GB of memory to run BenchmarkSQL and generate load. This specification prevents the stress test machine from becoming a bottleneck when testing high-specification PolarDB-X instances.
Deploy the ECS instance in a virtual private cloud (VPC). Record the VPC name and ID — all resources in subsequent steps must be in the same VPC.
Step 2: Create a PolarDB-X instance
Create a PolarDB-X instance. Select MySQL 5.7 or MySQL 8.0 as the database engine based on your requirements. For instructions, see Create a PolarDB-X instance.
Deploy the PolarDB-X instance in the same VPC as the ECS instance.
Create the test database:
CREATE DATABASE tpcc_1000 MODE = 'auto';
Step 3: Tune instance parameters
Modify the following parameters on the PolarDB-X compute nodes to optimize stress test performance.
Set these parameters using the console. For instructions, see Parameter settings.
Parameter Value Description ENABLE_COROUTINEtrueEnables coroutine scheduling on compute nodes. XPROTO_MAX_DN_CONCURRENT4000Sets the maximum number of concurrent connections to data nodes. XPROTO_MAX_DN_WAIT_CONNECTION4000Sets the maximum number of queued connection requests to data nodes. Connect to the PolarDB-X instance with a command-line client and run the following SQL statements in the same session to disable logging and CPU profiling:
SET GLOBAL RECORD_SQL=false;
SET GLOBAL MPP_METRIC_LEVEL=0;
SET GLOBAL ENABLE_CPU_PROFILE=false;
SET GLOBAL ENABLE_TRANS_LOG=false;
Step 4: Prepare the test data
Download and extract BenchmarkSQL
Download benchmarksql.tar.gz and extract it on the ECS instance:
tar xzvf benchmarksql.tar.gzBenchmarkSQL does not support the MySQL protocol by default. This example uses open source BenchmarkSQL 5.0, compiled with MySQL protocol support. It requires JDK 8 or later and is compatible with MySQL 5.7 and MySQL 8.0.
Configure the connection
On the ECS instance, navigate to the benchmarksql/run directory and open props.mysql:
cd benchmarksql/run
vi props.mysql
Replace the placeholder values with your PolarDB-X connection details:
db=mysql
driver=com.mysql.jdbc.Driver
conn=jdbc:mysql://{HOST}:{PORT}/tpcc?readOnlyPropagatesToServer=false&rewriteBatchedStatements=true&failOverReadOnly=false&connectTimeout=3000&socketTimeout=90000&allowMultiQueries=true&clobberStreamingResults=true&characterEncoding=utf8&netTimeoutForStreamingResults=0&autoReconnect=true
user={USER}
password={PASSWORD}

warehouses=1000
loadWorkers=100

terminals=128
//To run specified transactions per terminal- runMins must equal zero
runTxnsPerTerminal=0
//To run for specified minutes- runTxnsPerTerminal must equal zero
runMins=5
//Number of total transactions per minute
limitTxnsPerMin=0

//Set to true to run in 4.x compatible mode. Set to false to use the
//entire configured database evenly.
terminalWarehouseFixed=true

//The following five values must add up to 100
//The default percentages of 45, 43, 4, 4 & 4 match the TPC-C spec
newOrderWeight=45
paymentWeight=43
orderStatusWeight=4
deliveryWeight=4
stockLevelWeight=4

// Directory name to create for collecting detailed result data.
// Comment this out to suppress.
resultDirectory=my_result_%tY-%tm-%td_%tH%tM%tS

// osCollectorScript=./misc/os_collector_linux.py
// osCollectorInterval=1
// osCollectorSSHAddr=user@dbhost
// osCollectorDevices=net_eth0 blk_sda
Key parameters:
| Parameter | Description |
|---|---|
conn | JDBC connection string. Replace {HOST} and {PORT} with the endpoint of your PolarDB-X instance. |
user | Username for logging on to the PolarDB-X instance. |
password | Password for the username. |
warehouses | Number of warehouses in the test dataset. |
loadWorkers | Number of concurrent workers used to load data. |
terminals | Number of concurrent terminals (simulated users) during the test. |
runMins | Test duration, in minutes. |
limitTxnsPerMin | Maximum transactions per minute. Set to 0 to run at full speed with no rate limit. |
terminalWarehouseFixed | When set to true, each terminal is pinned to a fixed warehouse (BenchmarkSQL 4.x compatibility mode). When set to false, terminals access all warehouses evenly. |
Load the data
Run the following commands on the ECS instance to create the schema and import data:
cd benchmarksql/run/sql.common
cp tableCreates.sql.auto tableCreates.sql
cd ..
nohup ./runDatabaseBuild.sh props.mysql &
The import uses 100 concurrent load workers to load over 500 million rows, which takes several hours. Running the import with nohup keeps it running in the background if the SSH session disconnects.Verify data integrity
After the import completes, connect to the PolarDB-X instance and run the following SQL statements. If all result sets are empty, the data loaded successfully.
SELECT a.* FROM (SELECT w_id, w_ytd FROM bmsql_warehouse) a LEFT JOIN (SELECT d_w_id, SUM(d_ytd) AS d_ytd_sum FROM bmsql_district GROUP BY d_w_id) b ON a.w_id = b.d_w_id AND a.w_ytd = b.d_ytd_sum WHERE b.d_w_id IS NULL;

SELECT a.* FROM (SELECT d_w_id, d_id, D_NEXT_O_ID - 1 AS d_n_o_id FROM bmsql_district) a LEFT JOIN (SELECT o_w_id, o_d_id, MAX(o_id) AS o_id_max FROM bmsql_oorder GROUP BY  o_w_id, o_d_id) b ON a.d_w_id = b.o_w_id AND a.d_id = b.o_d_id AND a.d_n_o_id = b.o_id_max WHERE b.o_w_id IS NULL;

SELECT a.* FROM (Select d_w_id, d_id, D_NEXT_O_ID - 1 AS d_n_o_id FROM bmsql_district) a LEFT JOIN (SELECT no_w_id, no_d_id, MAX(no_o_id) AS no_id_max FROM bmsql_new_order GROUP BY no_w_id, no_d_id) b ON a.d_w_id = b.no_w_id AND a.d_id = b.no_d_id AND a.d_n_o_id = b.no_id_max WHERE b.no_id_max IS NULL;

SELECT * FROM (SELECT (COUNT(no_o_id)-(MAX(no_o_id)-MIN(no_o_id)+1)) AS diff FROM bmsql_new_order GROUP BY no_w_id, no_d_id) a WHERE diff != 0;

SELECT a.* FROM (SELECT o_w_id, o_d_id, SUM(o_ol_cnt) AS o_ol_cnt_cnt FROM bmsql_oorder  GROUP BY o_w_id, o_d_id) a LEFT JOIN (SELECT ol_w_id, ol_d_id, COUNT(ol_o_id) AS ol_o_id_cnt FROM bmsql_order_line GROUP BY ol_w_id, ol_d_id) b ON a.o_w_id = b.ol_w_id AND a.o_d_id = b.ol_d_id AND a.o_ol_cnt_cnt = b.ol_o_id_cnt WHERE b.ol_w_id IS NULL;

SELECT a.* FROM (SELECT d_w_id, SUM(d_ytd) AS d_ytd_sum FROM bmsql_district GROUP BY d_w_id) a LEFT JOIN (Select w_id, w_ytd FROM bmsql_warehouse) b ON a.d_w_id = b.w_id AND a.d_ytd_sum = b.w_ytd WHERE b.w_id IS NULL;
Step 5: Run the benchmark
cd benchmarksql/run
./runBenchmark.sh props.mysql
During the test, BenchmarkSQL prints rolling progress every 5 seconds:
[2024/07/16 16:32:20.369] Average tpmC: 286806.15 Current tpmC: 290244.00 Memory Usage: 510MB / 3584MB
[2024/07/16 16:32:25.369] Average tpmC: 286821.77 Current tpmC: 287712.00 Memory Usage: 209MB / 3584MB
[2024/07/16 16:32:30.369] Average tpmC: 286855.77 Current tpmC: 288828.00 Memory Usage: 984MB / 3584MB
Average tpmC is the running average since the test started. Current tpmC is the rate measured in the last 5-second interval.
After the test completes, the final summary is printed:
16:32:35,487 [Thread-714] INFO jTPCC : Term-00, Measured tpmC (NewOrders) = 286841.81
16:32:35,487 [Thread-714] INFO jTPCC : Term-00, Measured tpmTOTAL = 637027.51
16:32:35,487 [Thread-714] INFO jTPCC : Term-00, Session Start     = 2024-07-16 16:27:35
16:32:35,487 [Thread-714] INFO jTPCC : Term-00, Session End       = 2024-07-16 16:32:35
16:32:35,487 [Thread-714] INFO jTPCC : Term-00, Transaction Count = 3186400
The headline result is Measured tpmC (NewOrders) — this is the tpmC value to report. Measured tpmTOTAL counts all five transaction types combined and is not the primary benchmark metric.
Related topics
Release notes — check which version was used for the benchmark results above
Parameter settings — adjust compute node parameters for your workload