This article introduces how to configure Logtail using Simple Log Service to collect logs from an ACK cluster in both DaemonSet and Sidecar modes.
Logtail is a log collection agent provided by Simple Log Service. It works with multiple data sources, including Alibaba Cloud Elastic Compute Service (ECS) instances, servers in data centers, and servers belonging to third-party cloud service providers.
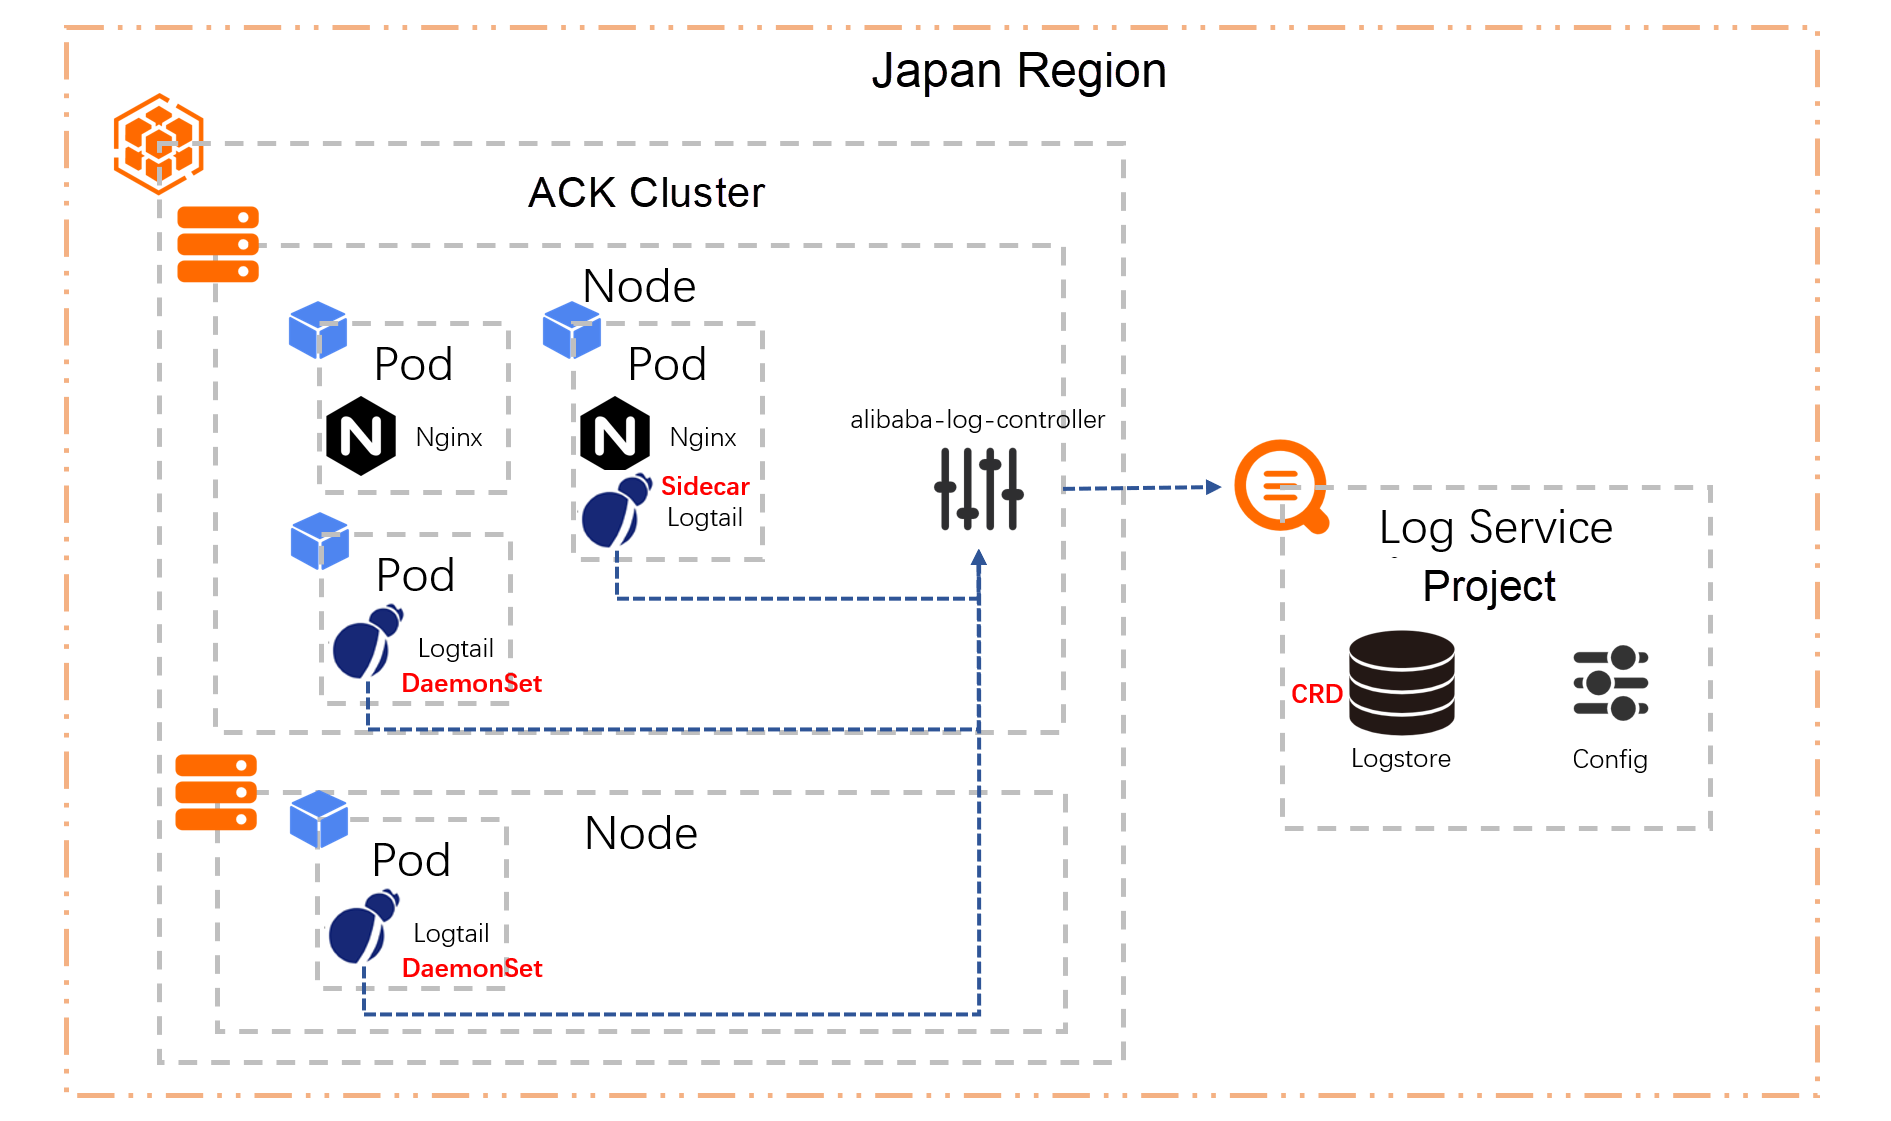
Logtail supports two types of solutions to collect logs from Kubernetes clusters: DaemonSet mode and Sidecar mode.
Log collection in DaemonSet mode is characterized by simple O&M, low resource usage, and flexible collection of container stdout files, stderr files, and text files. However, since Logtail collects logs from all containers on the node in this mode, the environment has performance bottlenecks and a less granular business log separation.
In Sidecar mode, a Sidecar container is created for each container to collect logs. This improves multi-tenant isolation and performance.
In general, the DaemonSet mode is recommended for system logs, general applications, and standard output. The Sidecar mode is suitable for core applications due to its higher collection stability.
The following section will show you how to collect logs from an Alibaba Cloud ACK Standard cluster in both of these two modes. All resources are created in the Japan (Tokyo) region.
Create a Simple Log Service project and an ACK cluster in the Japan (Tokyo) region and create simulated log data in the test image provided by Alibaba Cloud.
Then, configure Logtail in both DaemonSet and Sidecar modes to check the expected logs of the destination Logstore.
A Simple Log Service project is a resource management unit used to manage different resources in isolation.
A Logstore in Simple Log Service is used to collect, store, and query logs. Each Logstore has at least one specific Logtail configuration to define the log collection method.
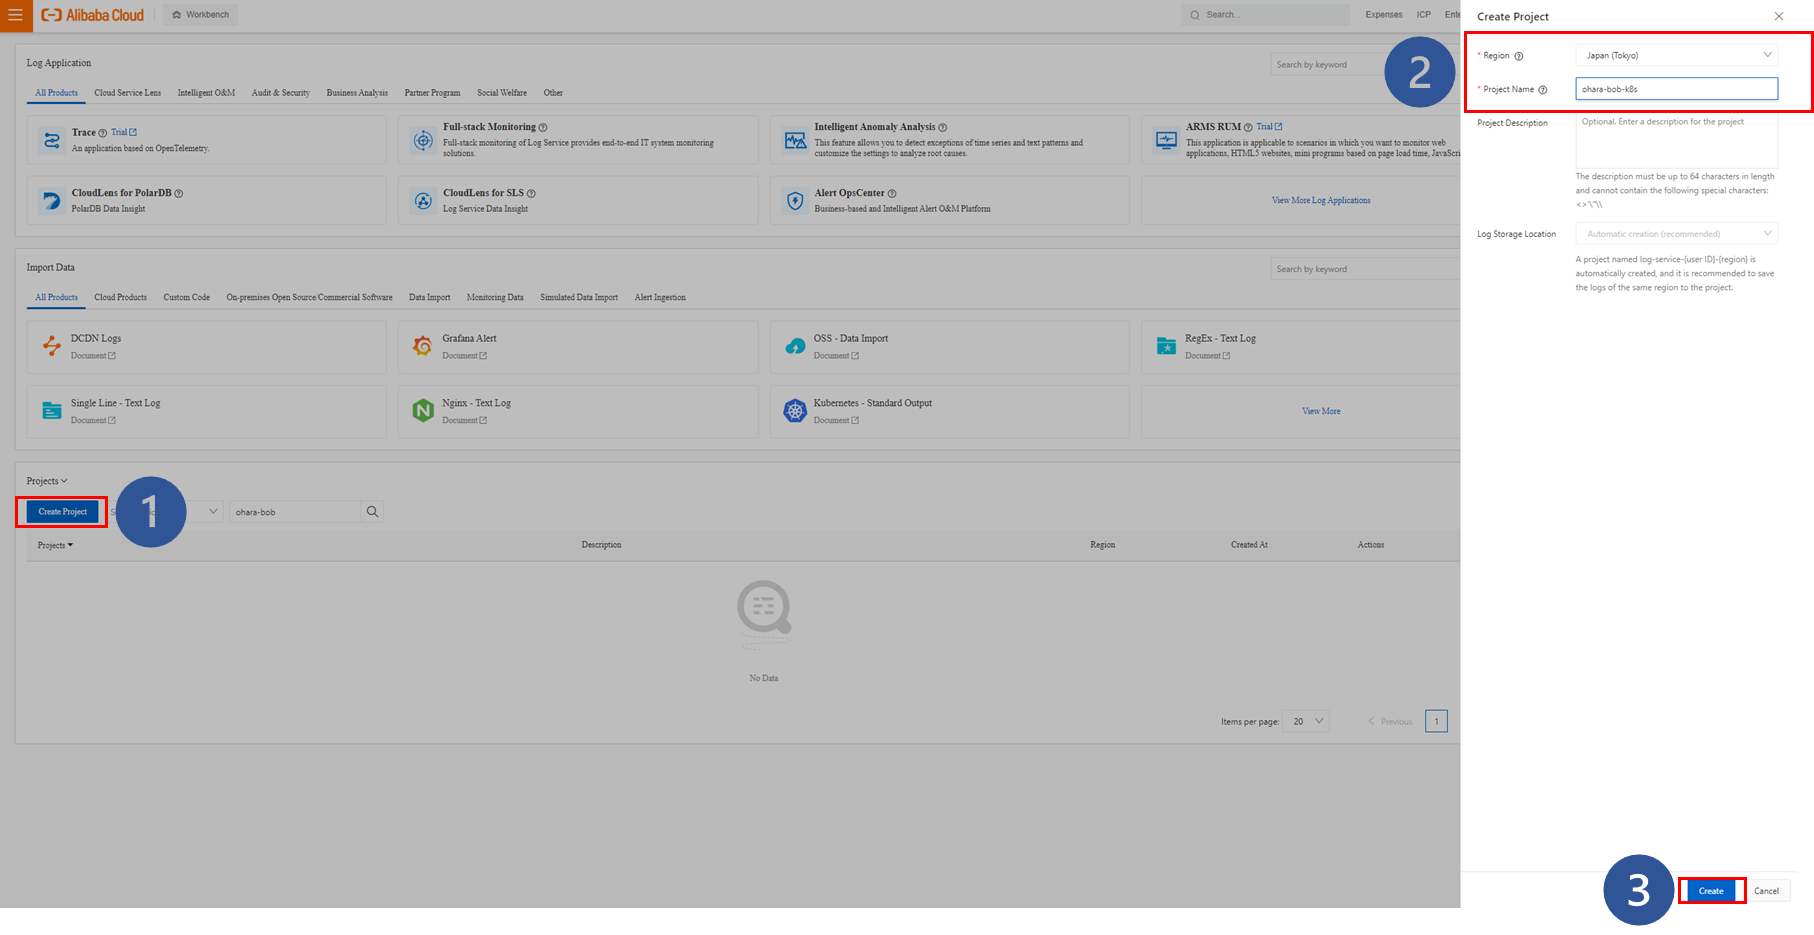
We create a new project in the Japan (Tokyo) region. If you want to create the destination project when creating an ACK cluster, you can ignore this section. In this section, our own Simple Log Service project will be used.
A new project is created right away, and a notification window will appear to guide you through the Logstore configuration process.
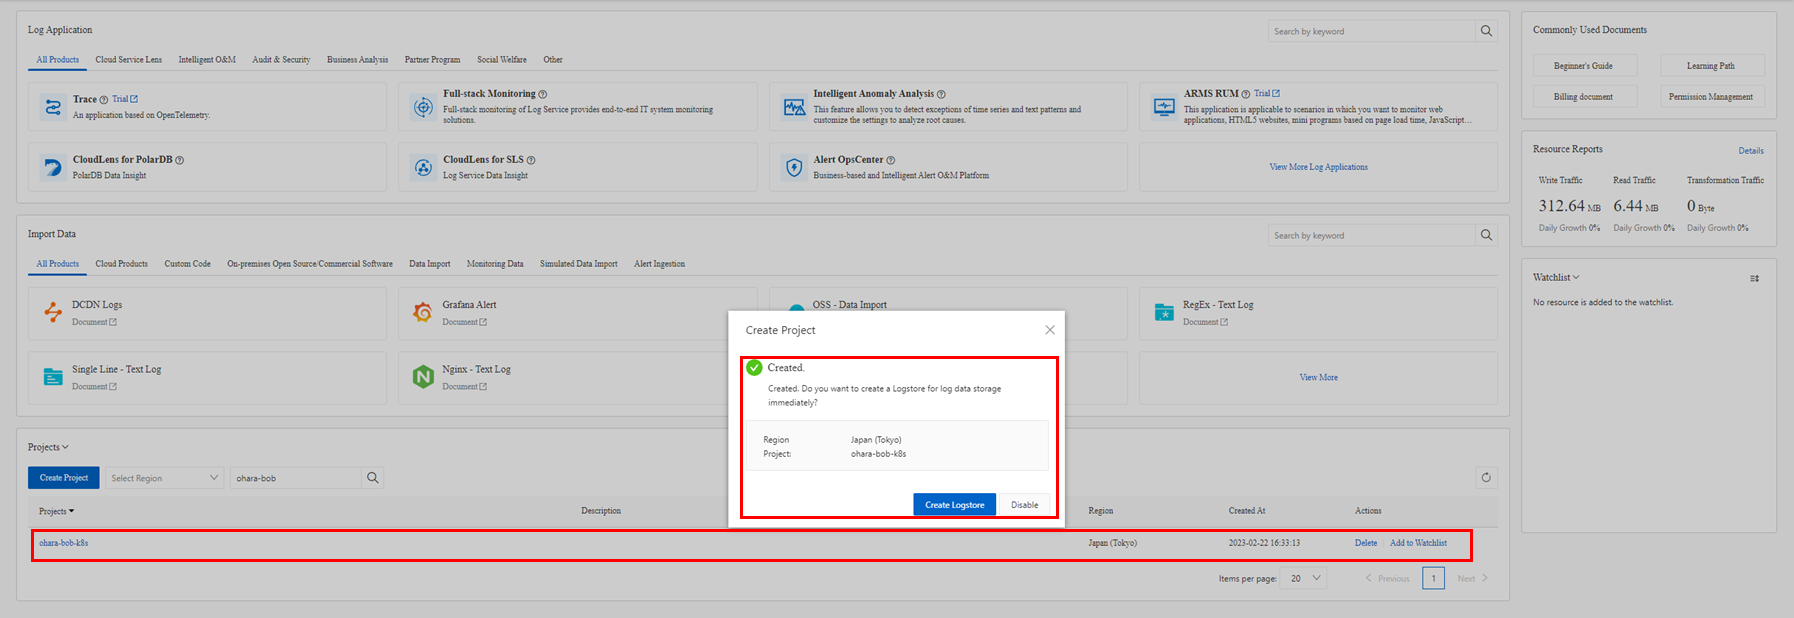
If you are using the Simple Log Service features, it is easier to configure Logtail from the wizard. Since Custom Resource Definition (CRD) is used in the ACK cluster this time, click Disable to prevent the wizard from launching.
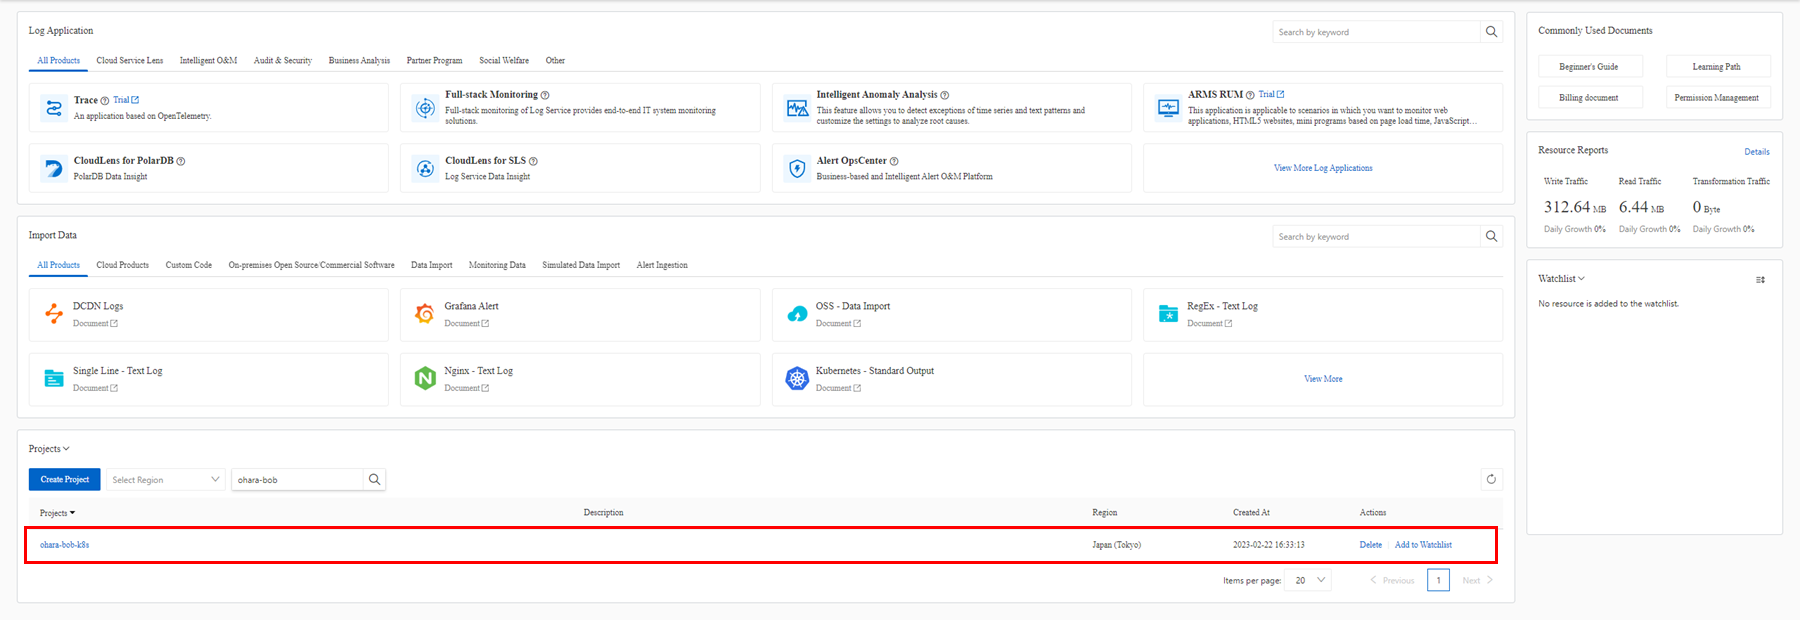

The Simple Log Service project that is needed is now ready.
Create an ACK cluster in the same region. ACK Standard clusters are for individual developers, while ACK Professional clusters are for enterprises.
Select a Standard cluster for testing.

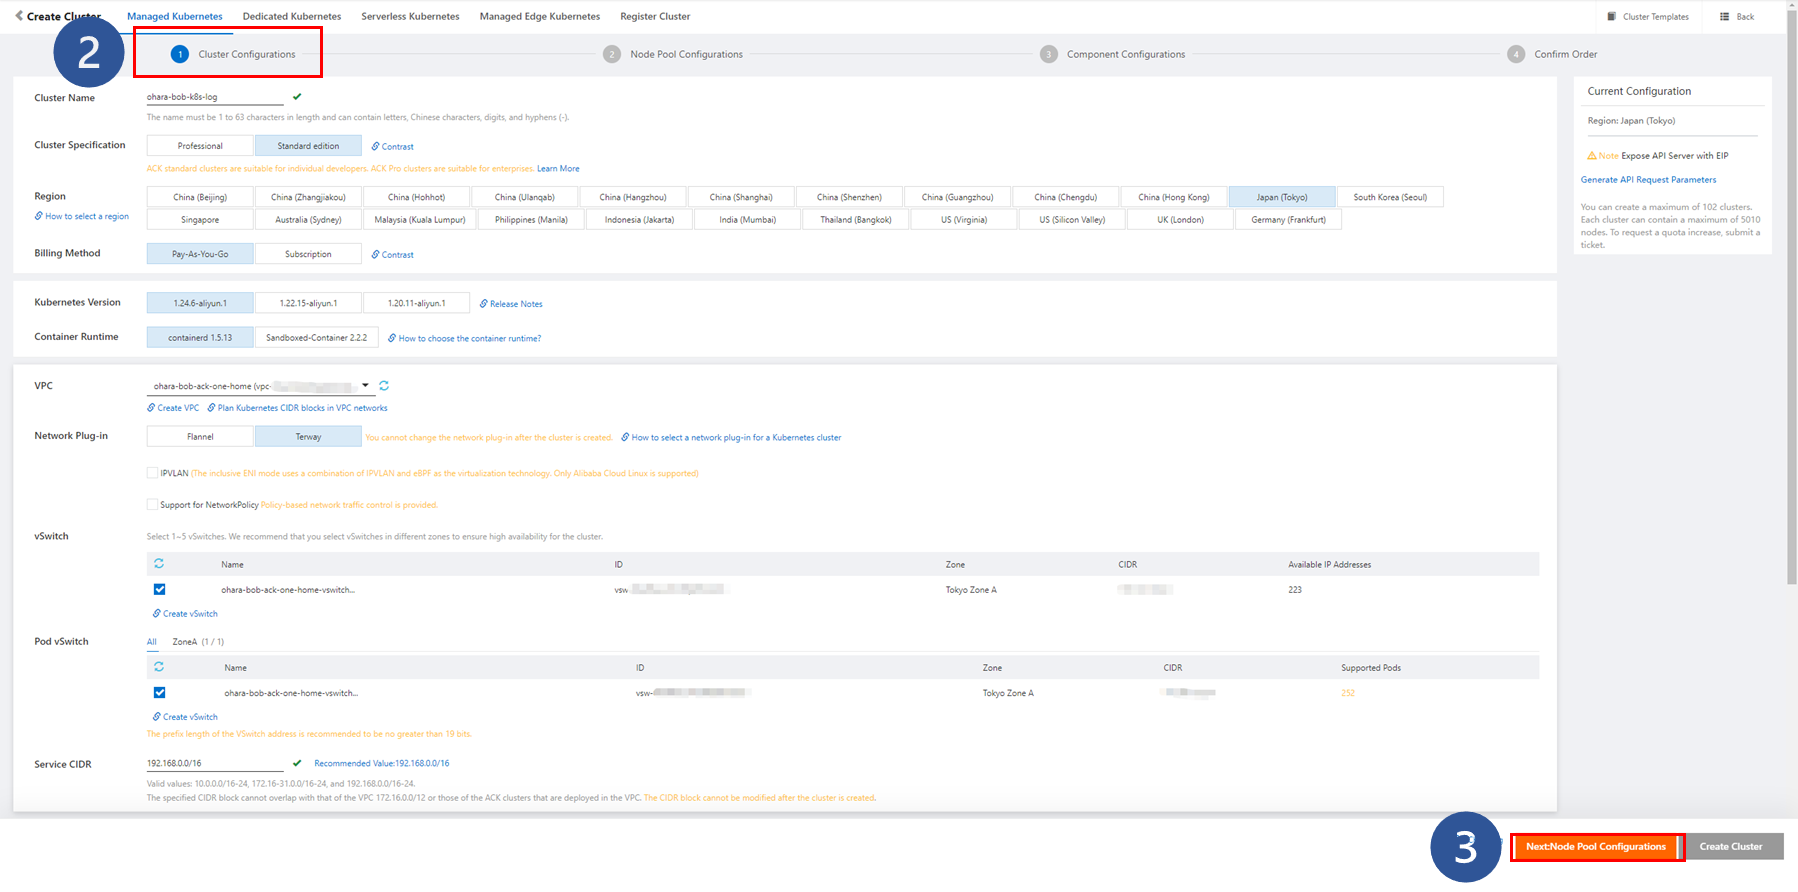
1. Click Create Kubernetes Cluster and start the creation process.
2. Complete the cluster configuration as needed and make sure that Region is configured the same as that for the Simple Log Service project.
3. Click Next: Node Pool Configurations to continue to the next step.
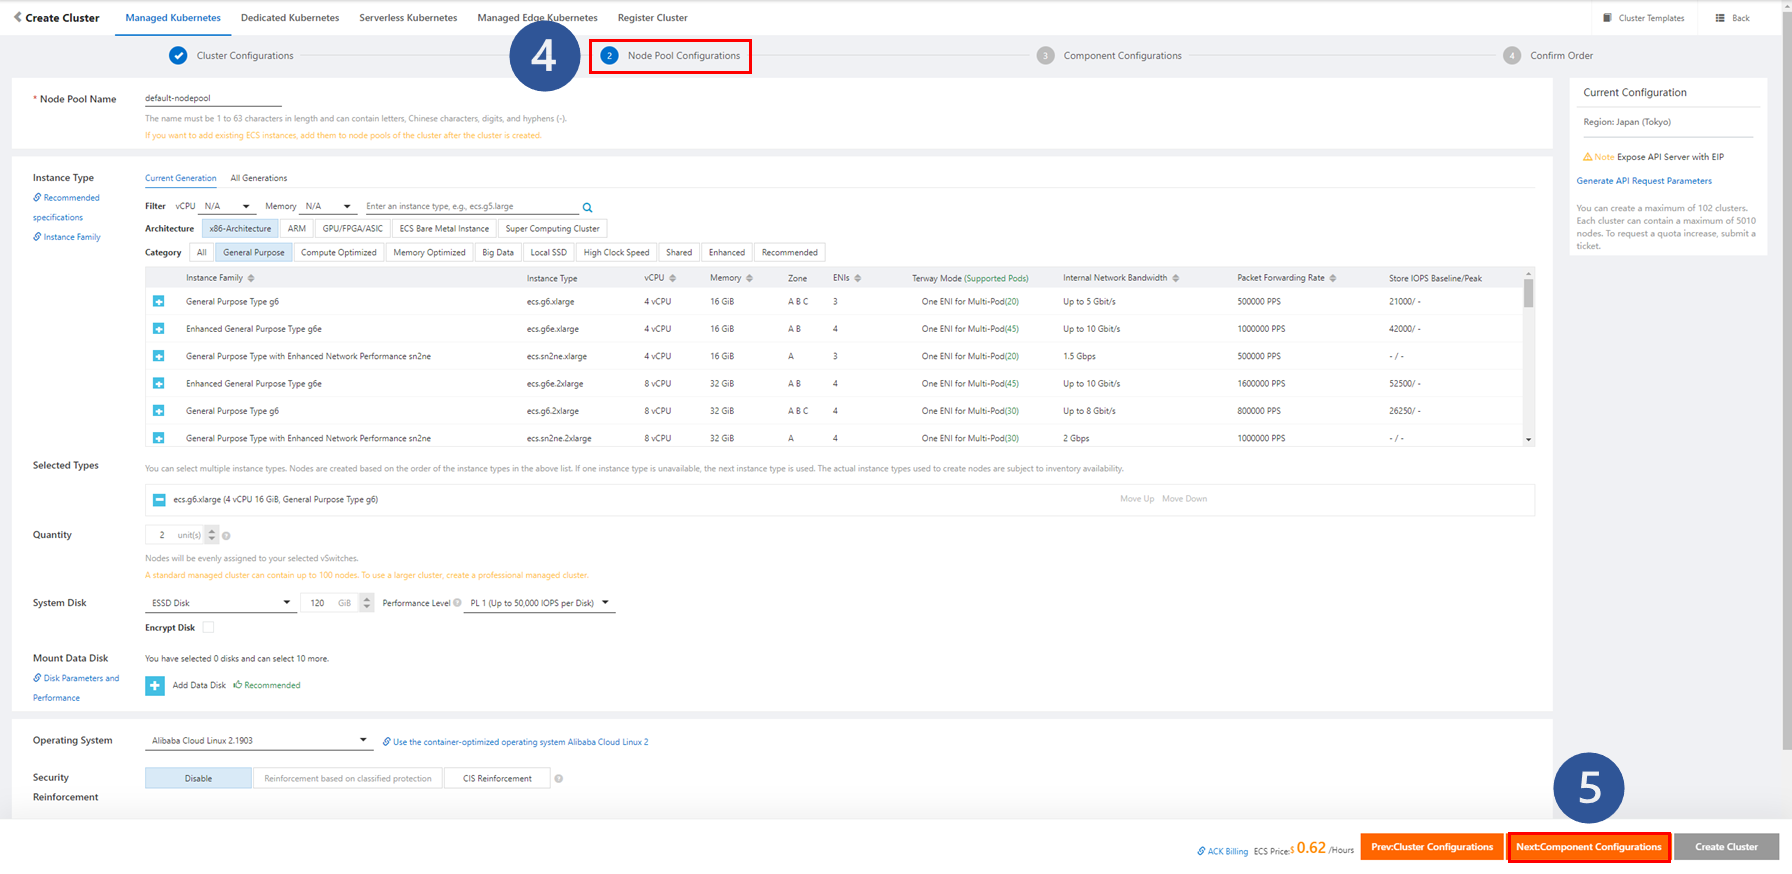
4. Complete Node Pool Configurations as you like. Since this is a test cluster, set the number of nodes to two.
5. Click Next: Component Configurations to continue to the next step.
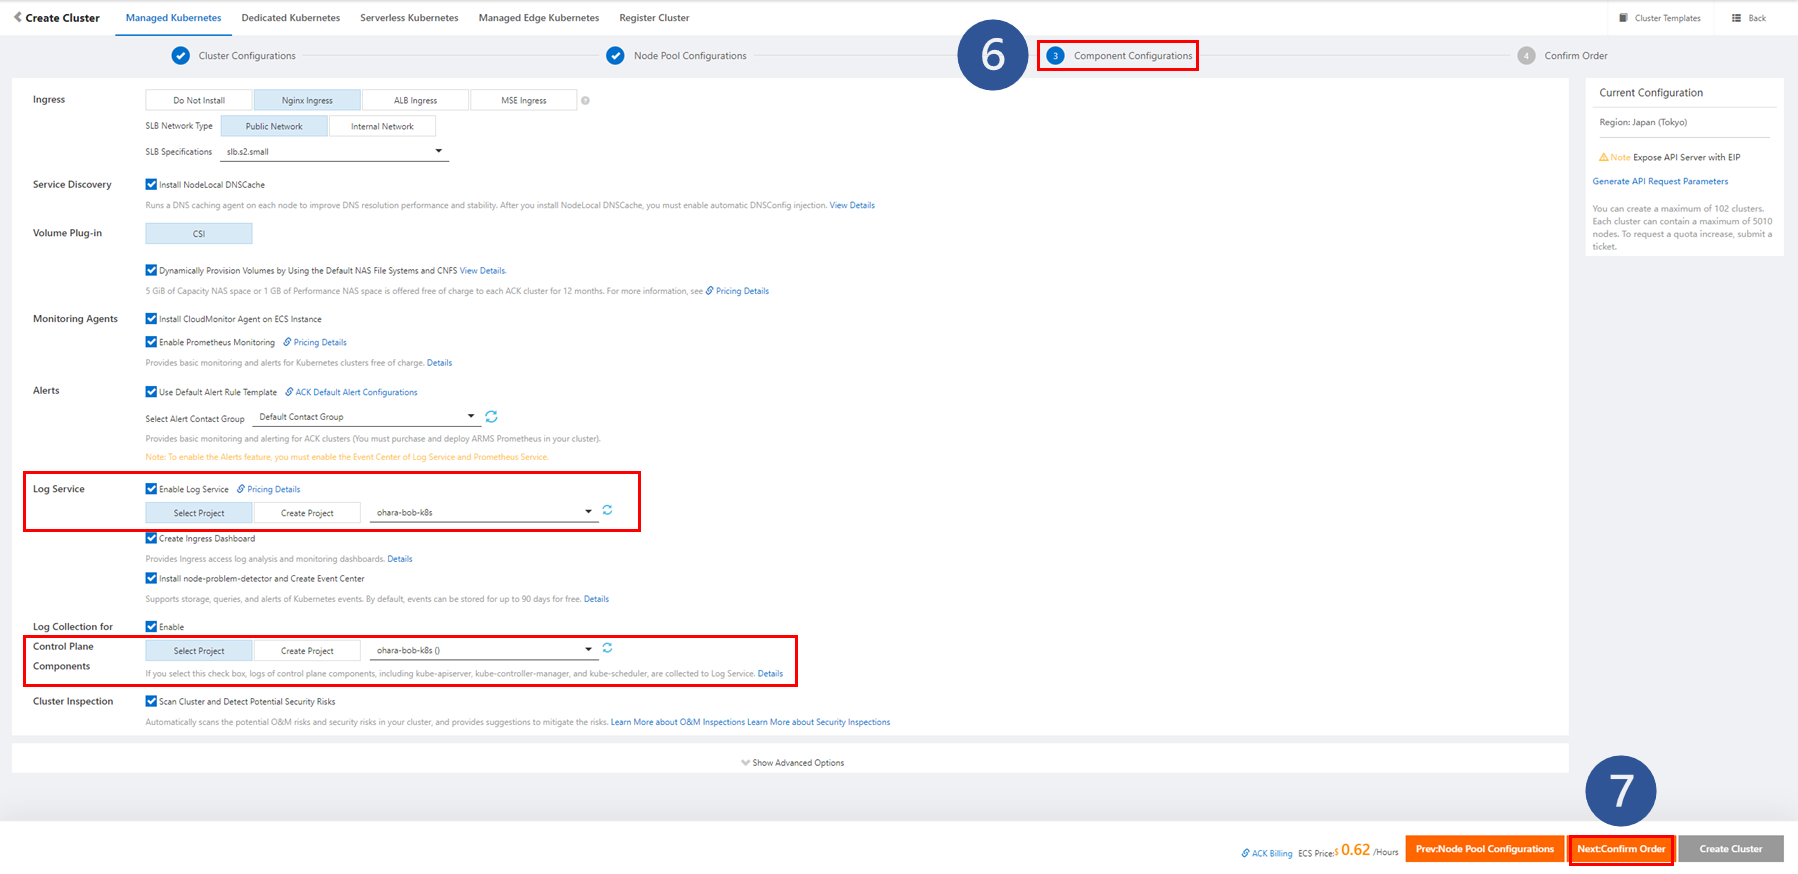
6. Configure the components.
7. Click Next: Confirm Order to continue to the next step.
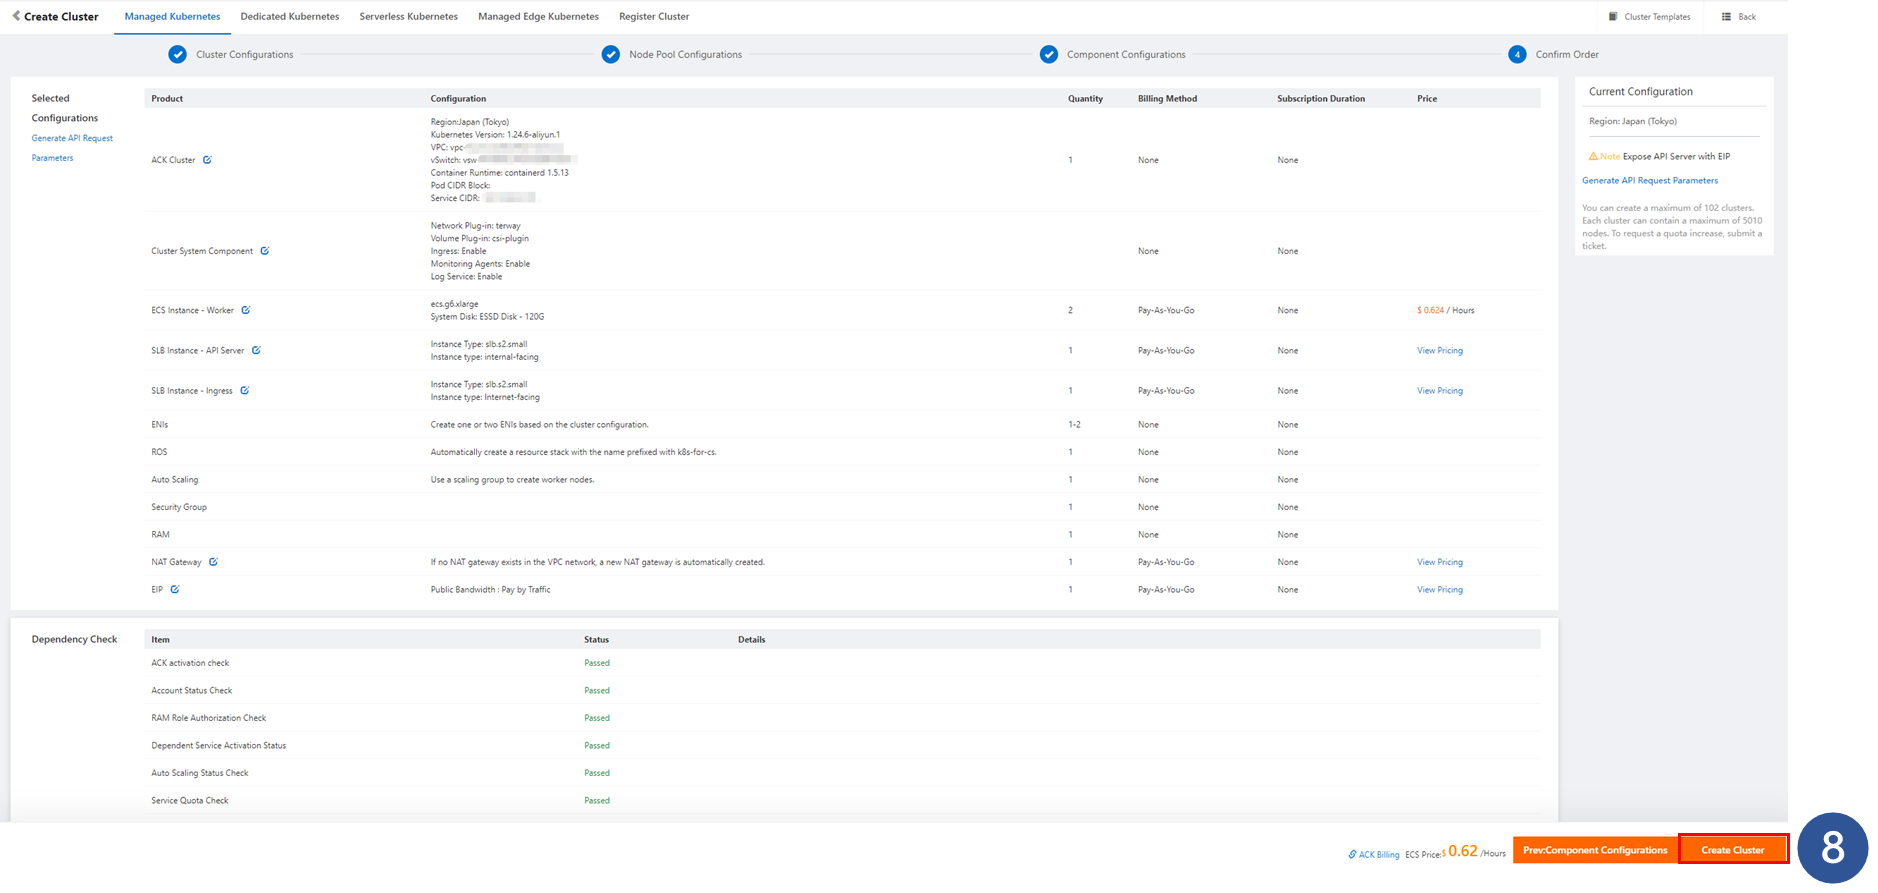
8. After reviewing the configuration information and the service duration, click Create Cluster to perform the operation.
A log of the creation process appears. It takes 8-10 minutes for the cluster to be ready.


Since Log Service and Log Collection for Control Plane Components were enabled at the time of creation, the Logstore related to the destination Simple Log Service project is configured.
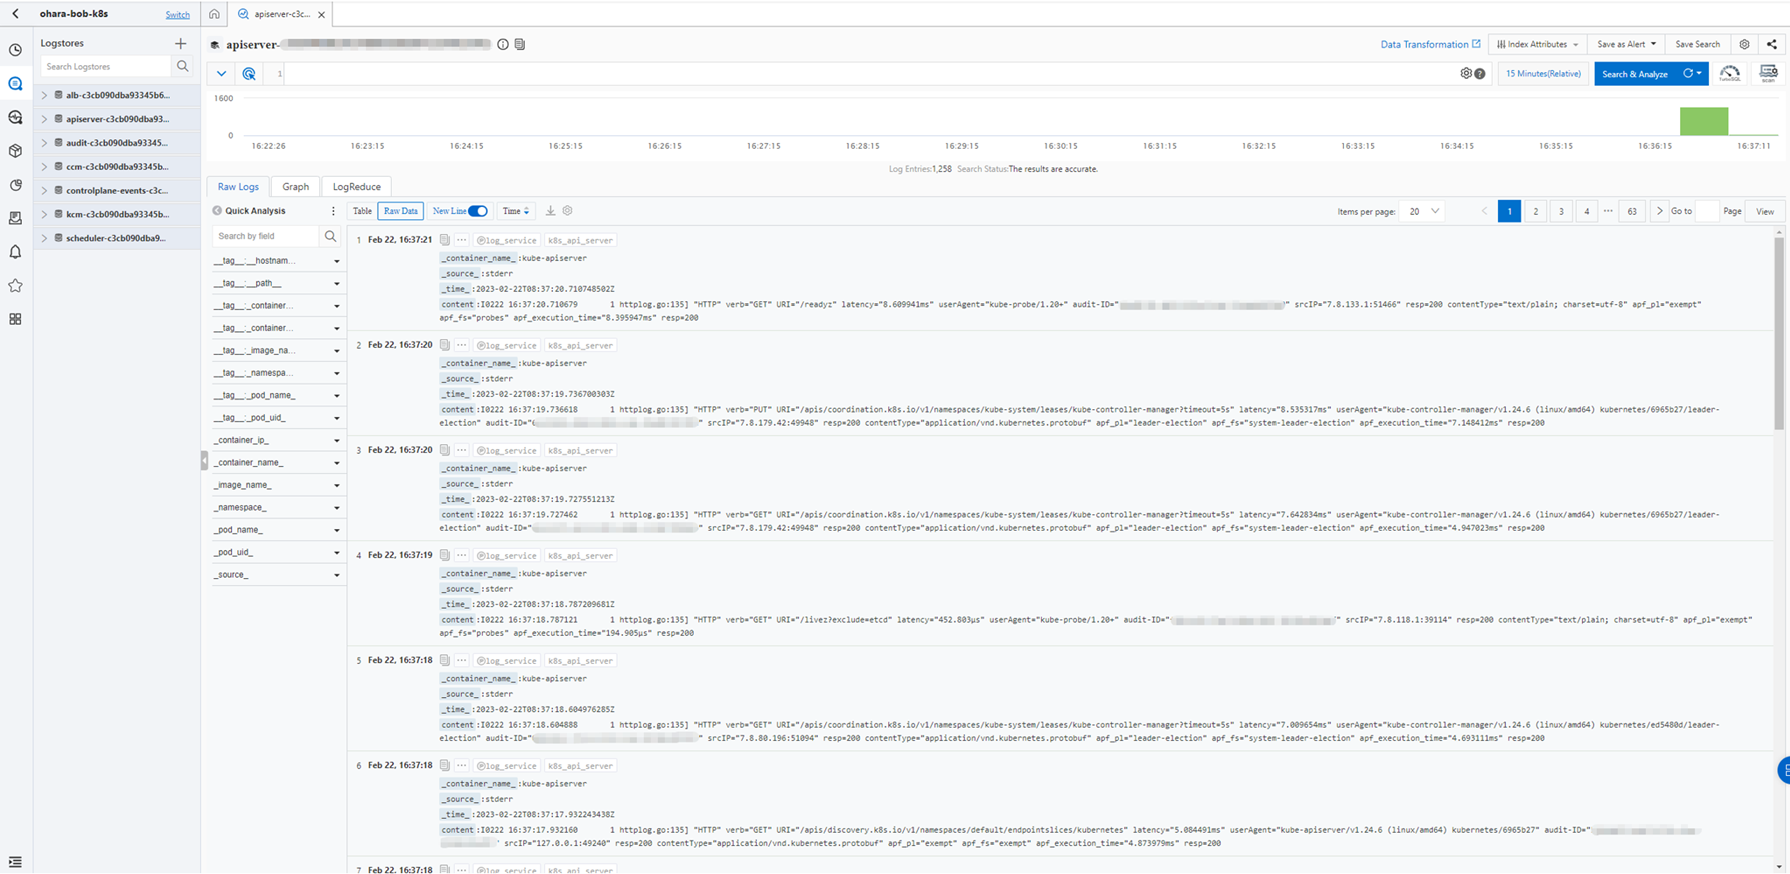
After the cluster is initialized, you can view the project page and related logs.

The following is a sample log for creating an apiserver Logstore. You can also view other Logstores, and any relevant logs will be displayed as well.
The related settings are displayed on the Cluster Resources tab of the Cluster Information page.

To achieve this, the logtail-ds component must be installed in the ACK cluster. Detailed information can be found on the Operations > Add-ons page.
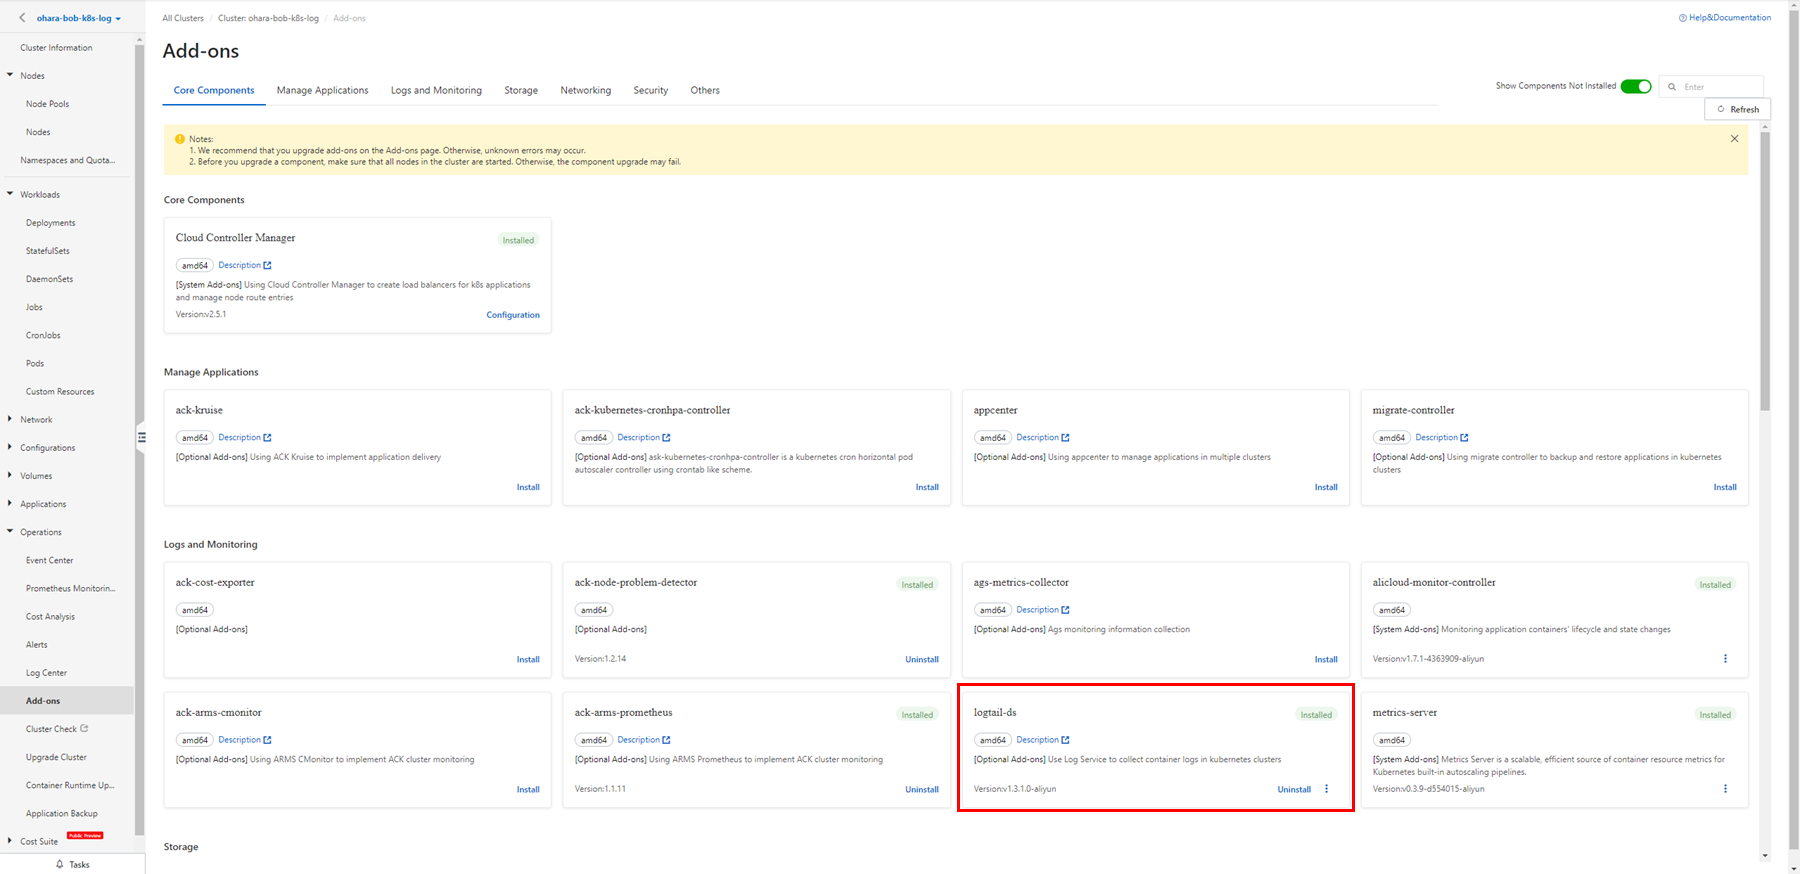
For existing clusters, you can install components here to enable the log collection feature. A new Simple Log Service project with a cluster ID has been created and can be used in the future.
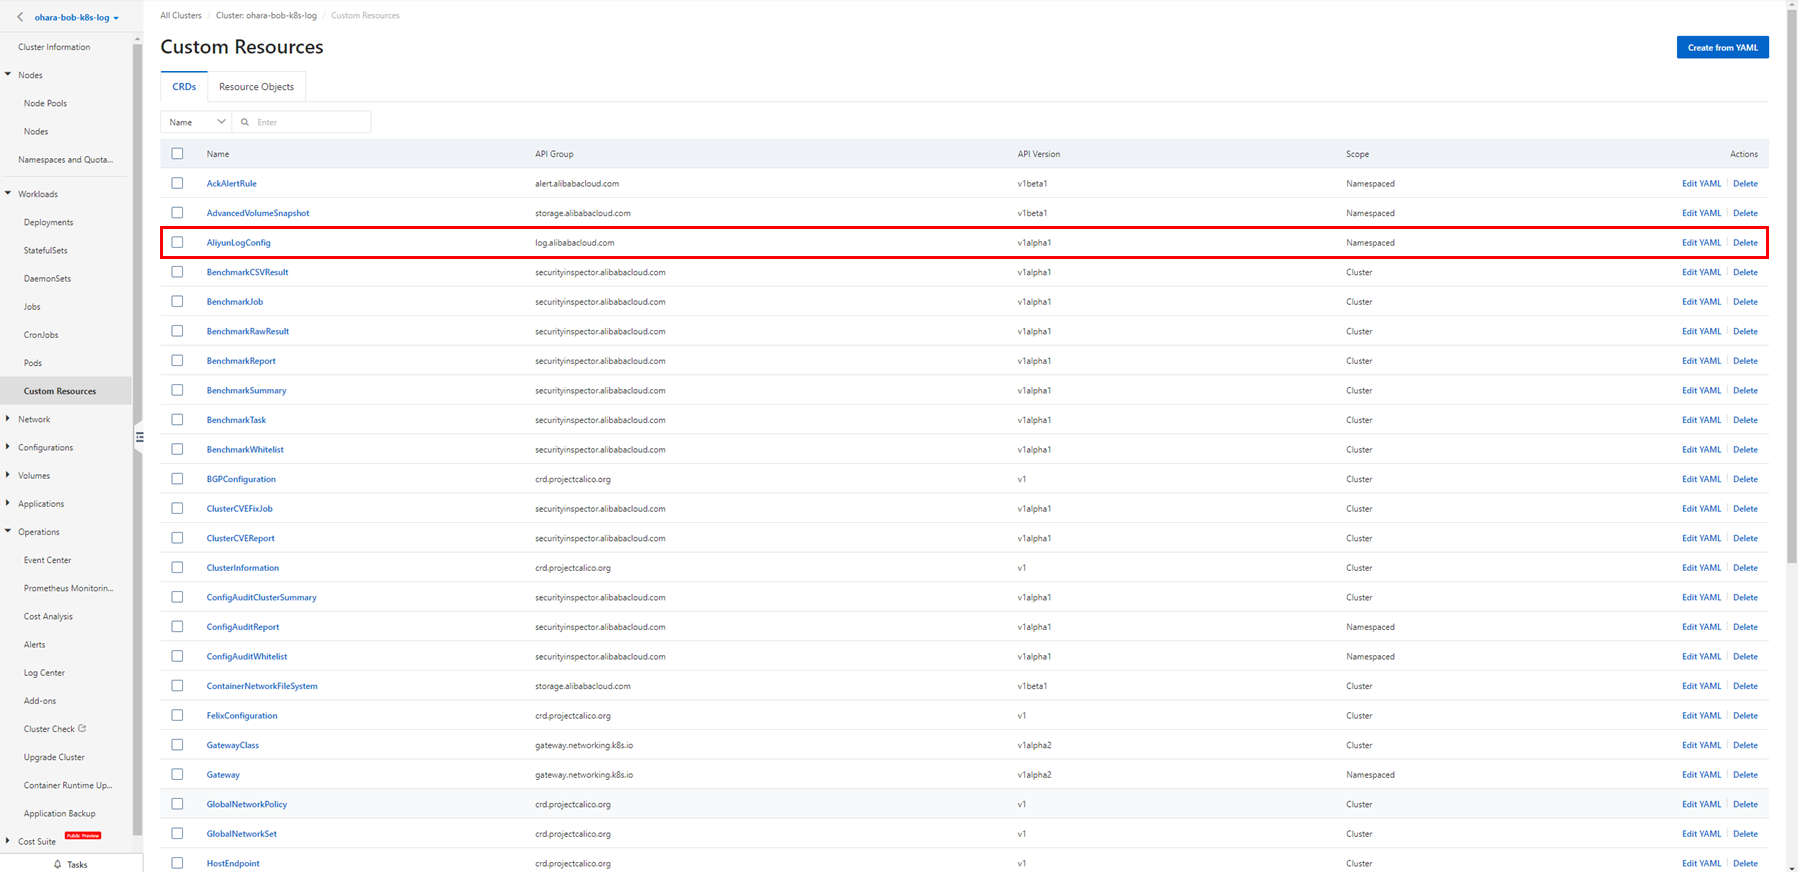
A Custom Resource Definition (CRD) named AliyunLogConfig is also created on the Workloads > Custer Resources page. It will be used in DaemonSet and Sidecar modes.
Collect log data from containers by using Log Service:
https://www.alibabacloud.com/help/en/container-service-for-kubernetes/latest/collect-log-data-from-containers-by-using-log-service
When you create an application, you have an option to configure Log Service to collect log data from containers. An application can be created using the console wizard or the YAML template.
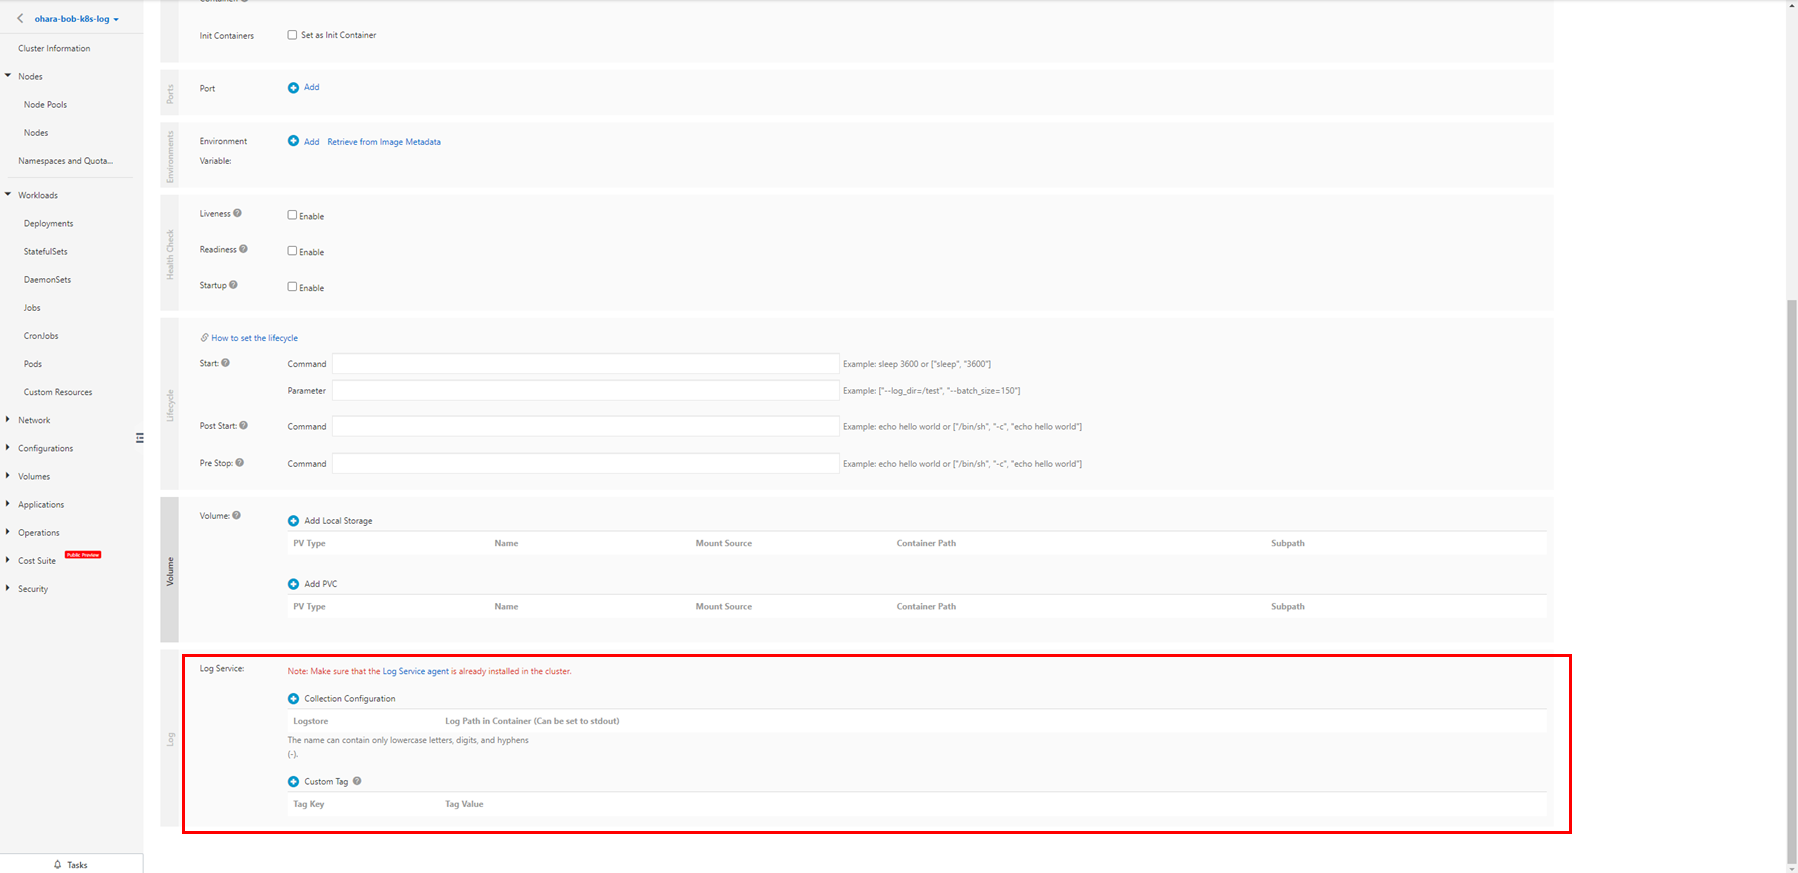
By default, Simple Log Service collects log data by row and does not parse log data. To change the log collection mode or to parse the log data, DaemonSet and Sidecar modes must be used in the following steps.
Configure Log Service when you create an application:
https://www.alibabacloud.com/help/en/container-service-for-kubernetes/latest/collect-log-data-from-containers-by-using-log-service#section-oja-55c-uqj
Create a Logtail configuration to collect container stdout and stderr in DaemonSet mode.
You can also create related configurations directly in the Simple Log Service console by following the document and diagram below.
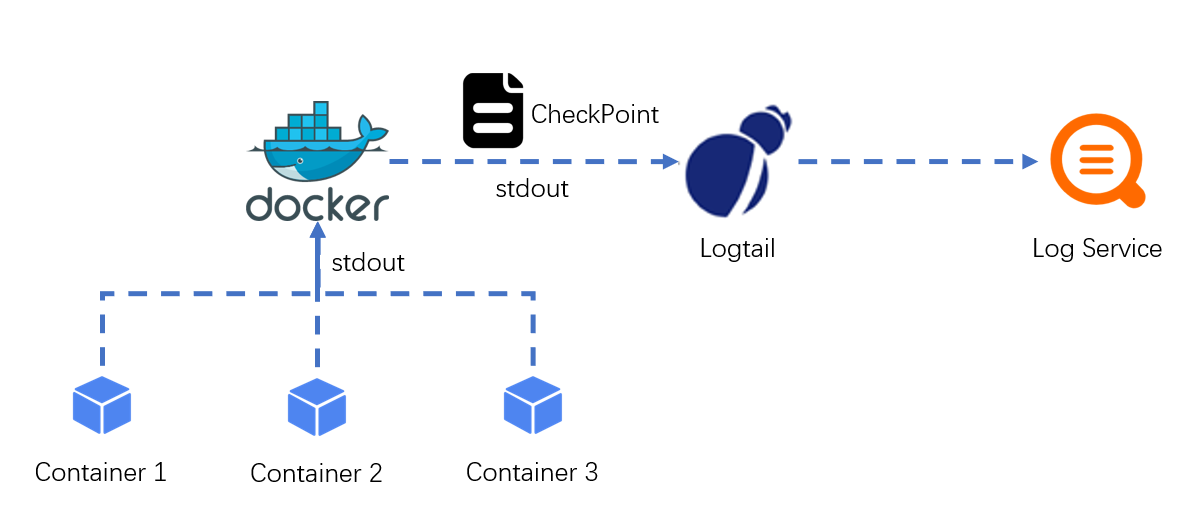
Use the Simple Log Service console to collect container stdout and stderr in DaemonSet mode:
https://www.alibabacloud.com/help/en/log-service/latest/use-the-log-service-console-to-collect-container-stdout-and-stderr-logs-in-daemonset-mode
It is preferable to create a specific Logtail configuration using a Custom Resource Definition (CRD).
Use CRDs to collect container logs in DaemonSet mode:
https://www.alibabacloud.com/help/en/log-service/latest/collect-kubernetes-container-logs-in-daemonset-crd-mode
Prepare a YAML file for configuring CRD as follows and create the destination resource in the console.
In the sample, the resource name is simple-stdout-example and the destination Logstore name is k8s-stdout. Please update based on your situation.
apiVersion: log.alibabacloud.com/v1alpha1
kind: AliyunLogConfig
metadata:
  name: simple-stdout-example
spec:
  logstore: k8s-stdout
  logtailConfig:
    inputType: plugin
    configName: k8s-stdout-example
    inputDetail:
      plugin:
        inputs:
          -
            type: service_docker_stdout
            detail:
              Stdout: true
              Stderr: true
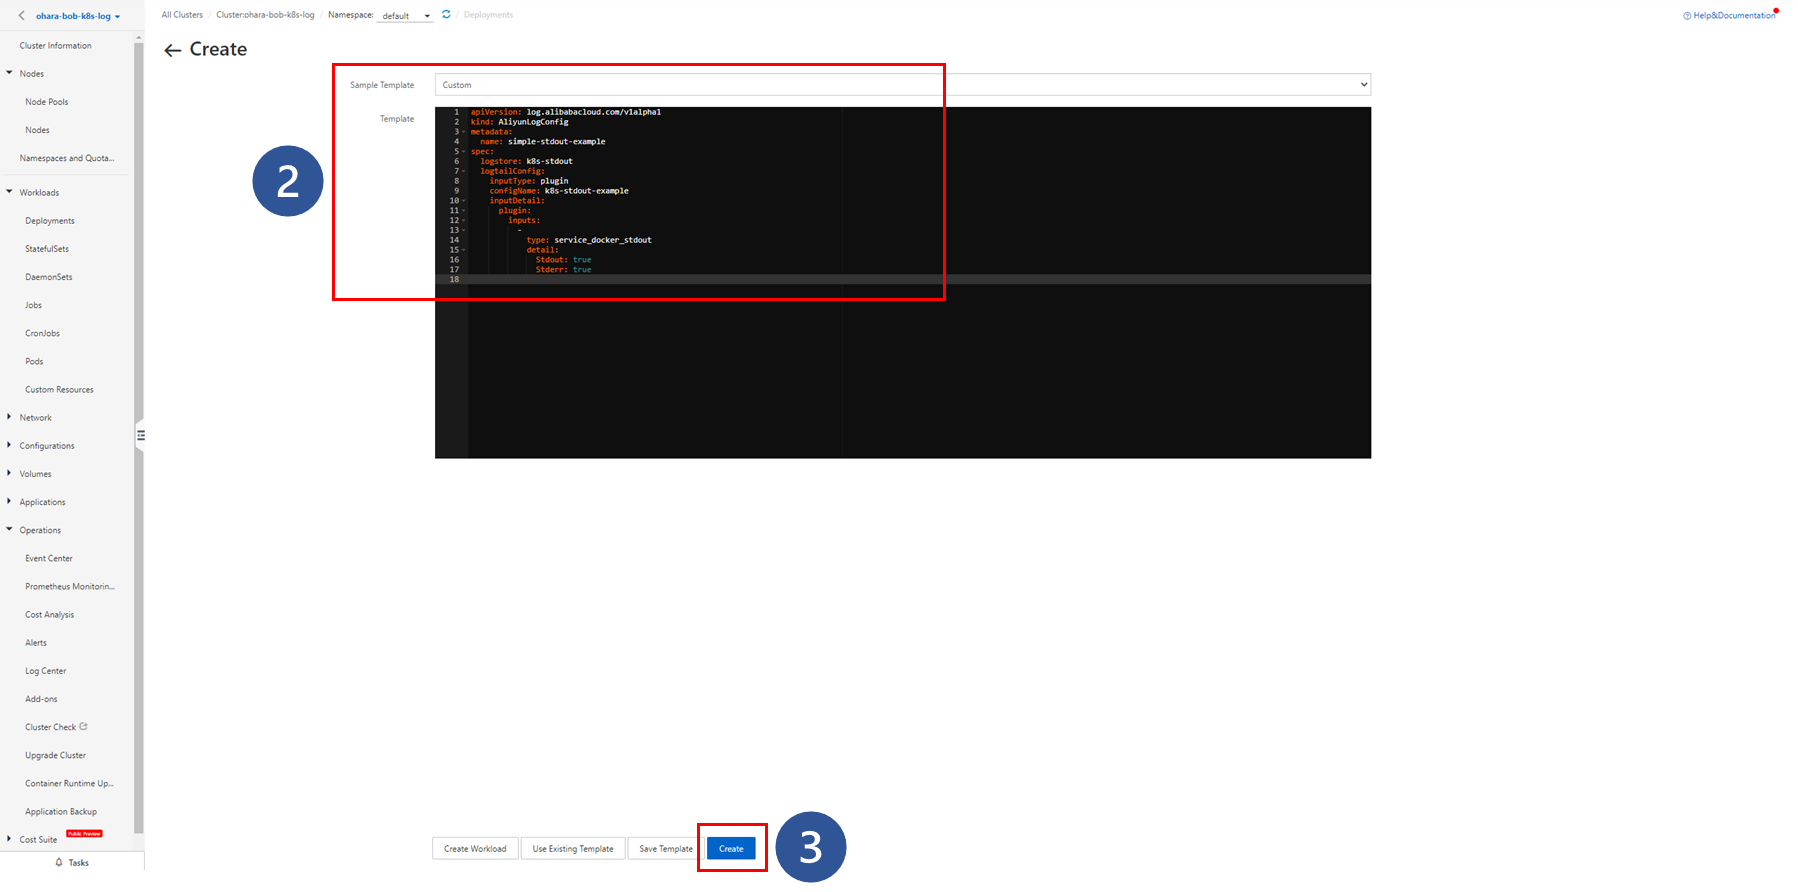
The CRD resource object appears in the list.

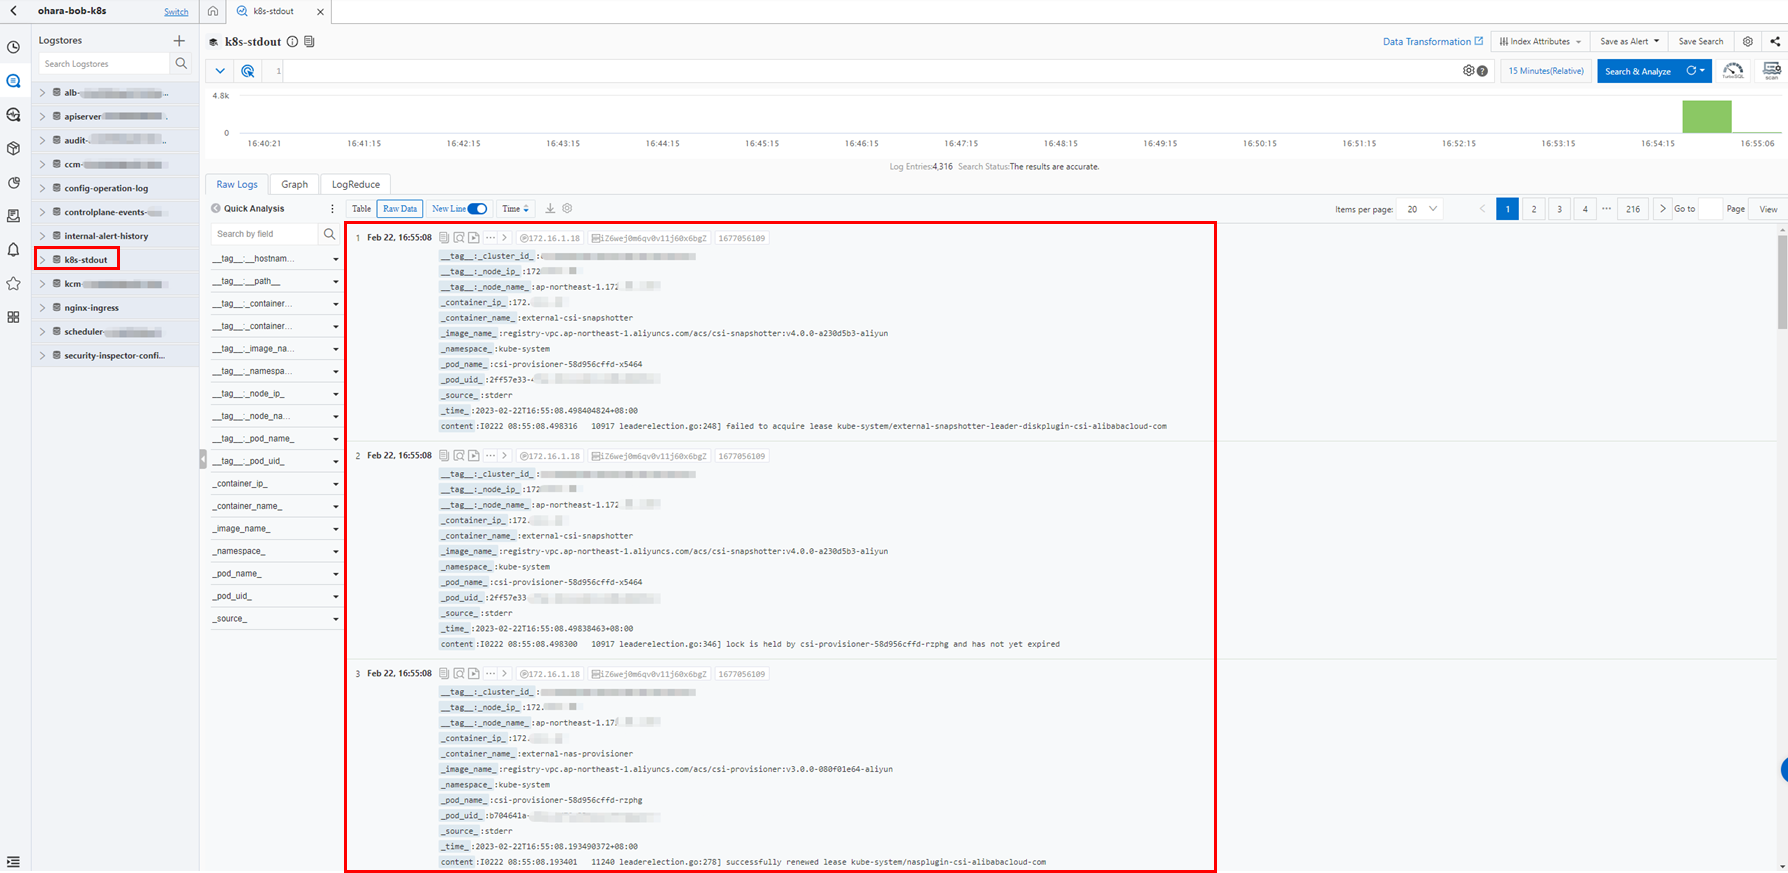
In the Simple Log Service project, view the created Logstore and collected logs.
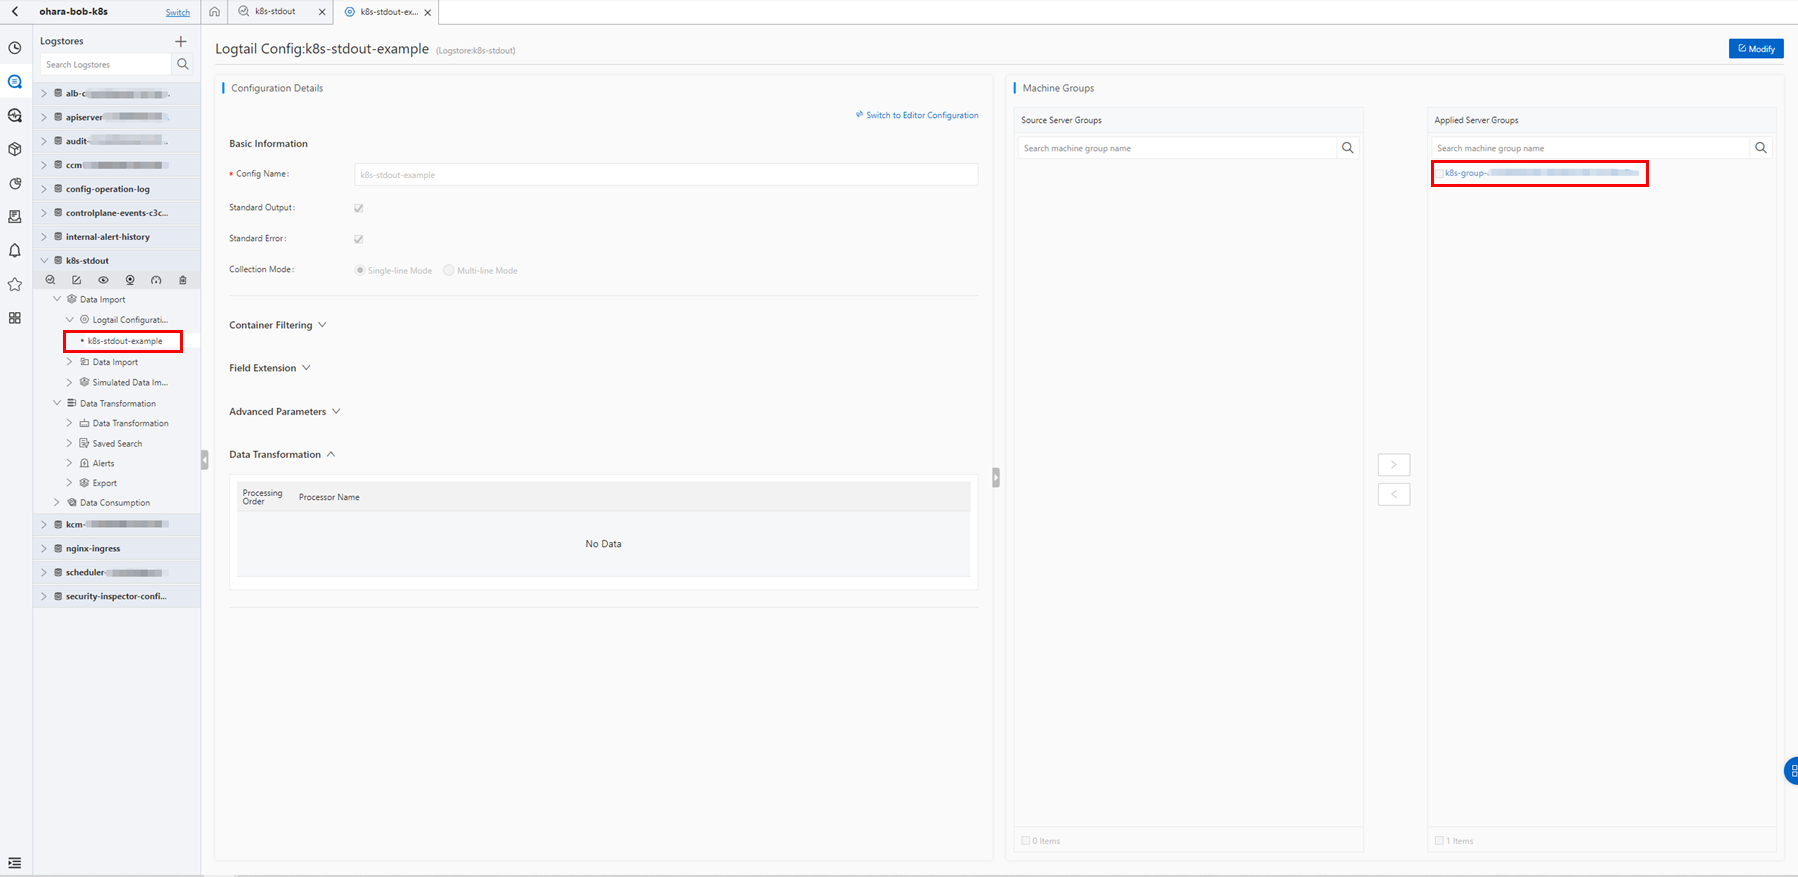
Check the Logtail configuration in the Simple Log Service console.
Several methods can be used to collect and parse log data, including the Simple mode and regular expression, like those supported in the Simple Log Service console.
Some information can also be used to filter logs from different pods, such as the Kubernetes label, Kubernetes namespace, pod name, and container name.
In this section, just collect all the stdout logs in Simple mode.
Examples of Logtail configurations that are used to collect stdout and stderr:
https://www.alibabacloud.com/help/en/log-service/latest/collect-kubernetes-container-logs-in-daemonset-crd-mode#section-33k-8w0-t2u
As mentioned earlier, Logtail can be configured to collect text logs in DaemonSet mode from both the Simple Log Service console and the CRD settings.
Since the collection of text logs should be a common requirement, both processes will be explained. However, the CRD method is still preferred.
Use the Simple Log Service console to collect container text logs in DaemonSet mode:
https://www.alibabacloud.com/help/en/log-service/latest/use-the-log-service-console-to-collect-container-text-logs-in-daemonset-mode
Use CRDs to collect container logs in DaemonSet mode:
https://www.alibabacloud.com/help/en/log-service/latest/collect-kubernetes-container-logs-in-daemonset-crd-mode
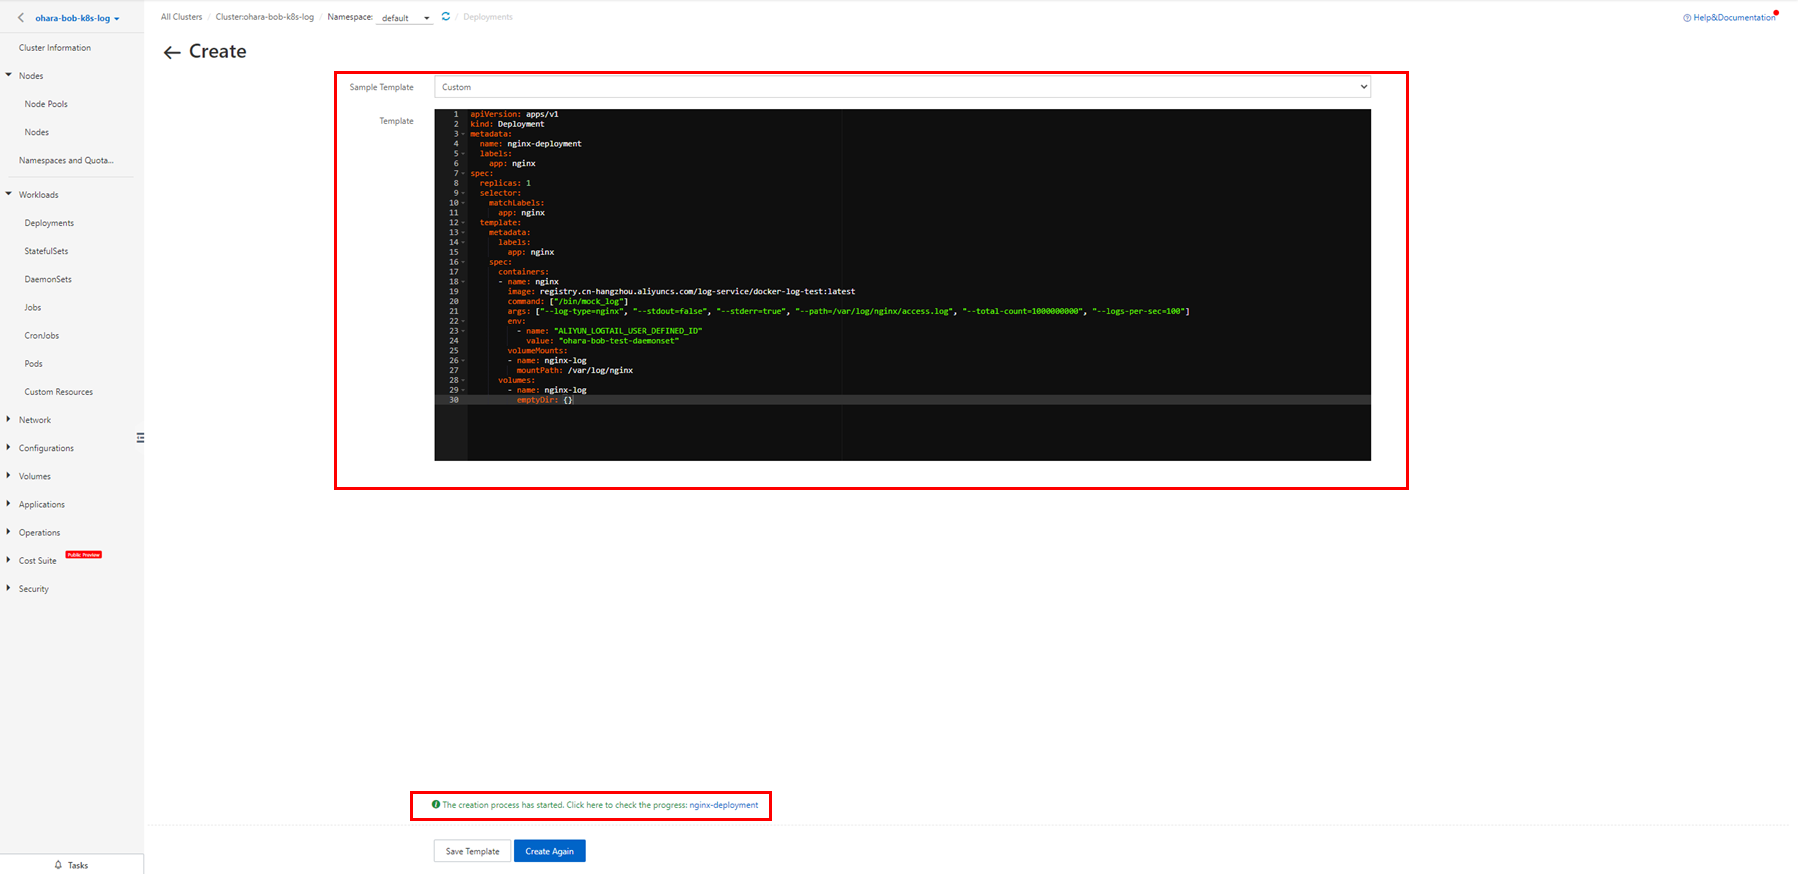
Create an application that simulates log data based on Nginx. Images are provided by Alibaba Cloud.
After you build an application by using the following configuration YAML, you can simulate Nginx access logs to the log file used in the following steps.
apiVersion: apps/v1
kind: Deployment
metadata:
  name: nginx-deployment
  labels:
    app: nginx
spec:
  replicas: 1
  selector:
    matchLabels:
      app: nginx
  template:
    metadata:
      labels:
        app: nginx
    spec:
      containers:
      - name: nginx
        image: registry.cn-hangzhou.aliyuncs.com/log-service/docker-log-test:latest
        command: ["/bin/mock_log"]
        args: ["--log-type=nginx", "--stdout=false", "--stderr=true", "--path=/var/log/nginx/access.log", "--total-count=1000000000", "--logs-per-sec=100"]
        env:
          - name: "ALIYUN_LOGTAIL_USER_DEFINED_ID"
            value: "ohara-bob-test-daemonset"
        volumeMounts:
        - name: nginx-log
          mountPath: /var/log/nginx
      volumes:
        - name: nginx-log
          emptyDir: {}
Create a resource in the console in the same way.

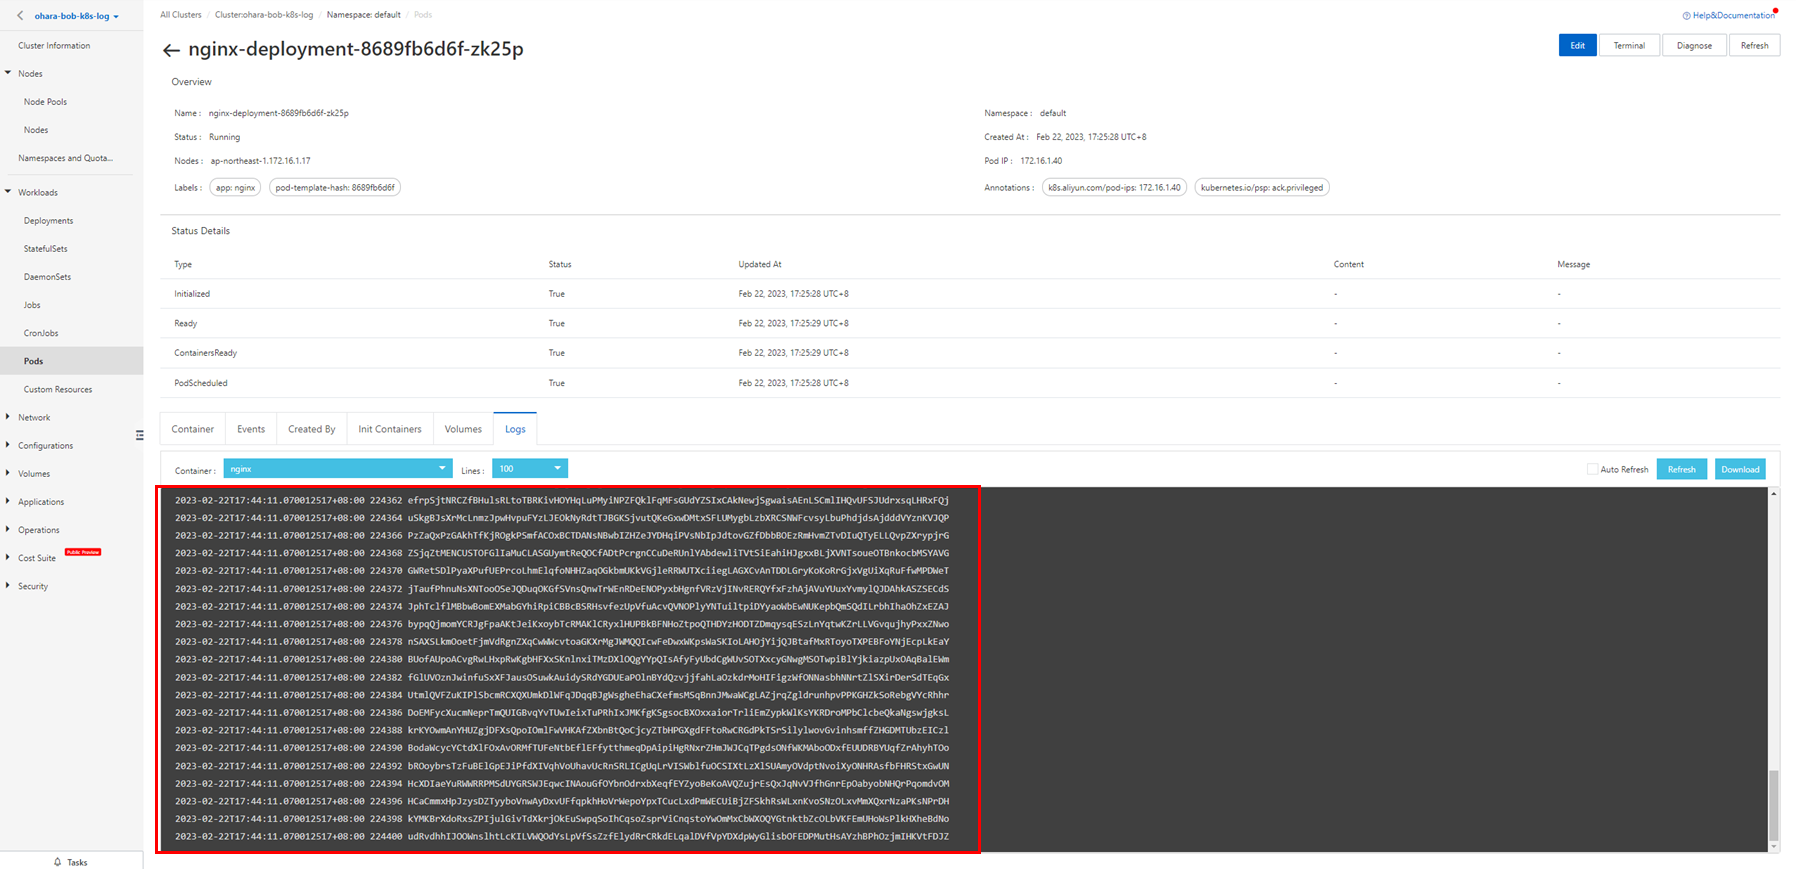
When you run the application, Nginx access logs are continuously generated.
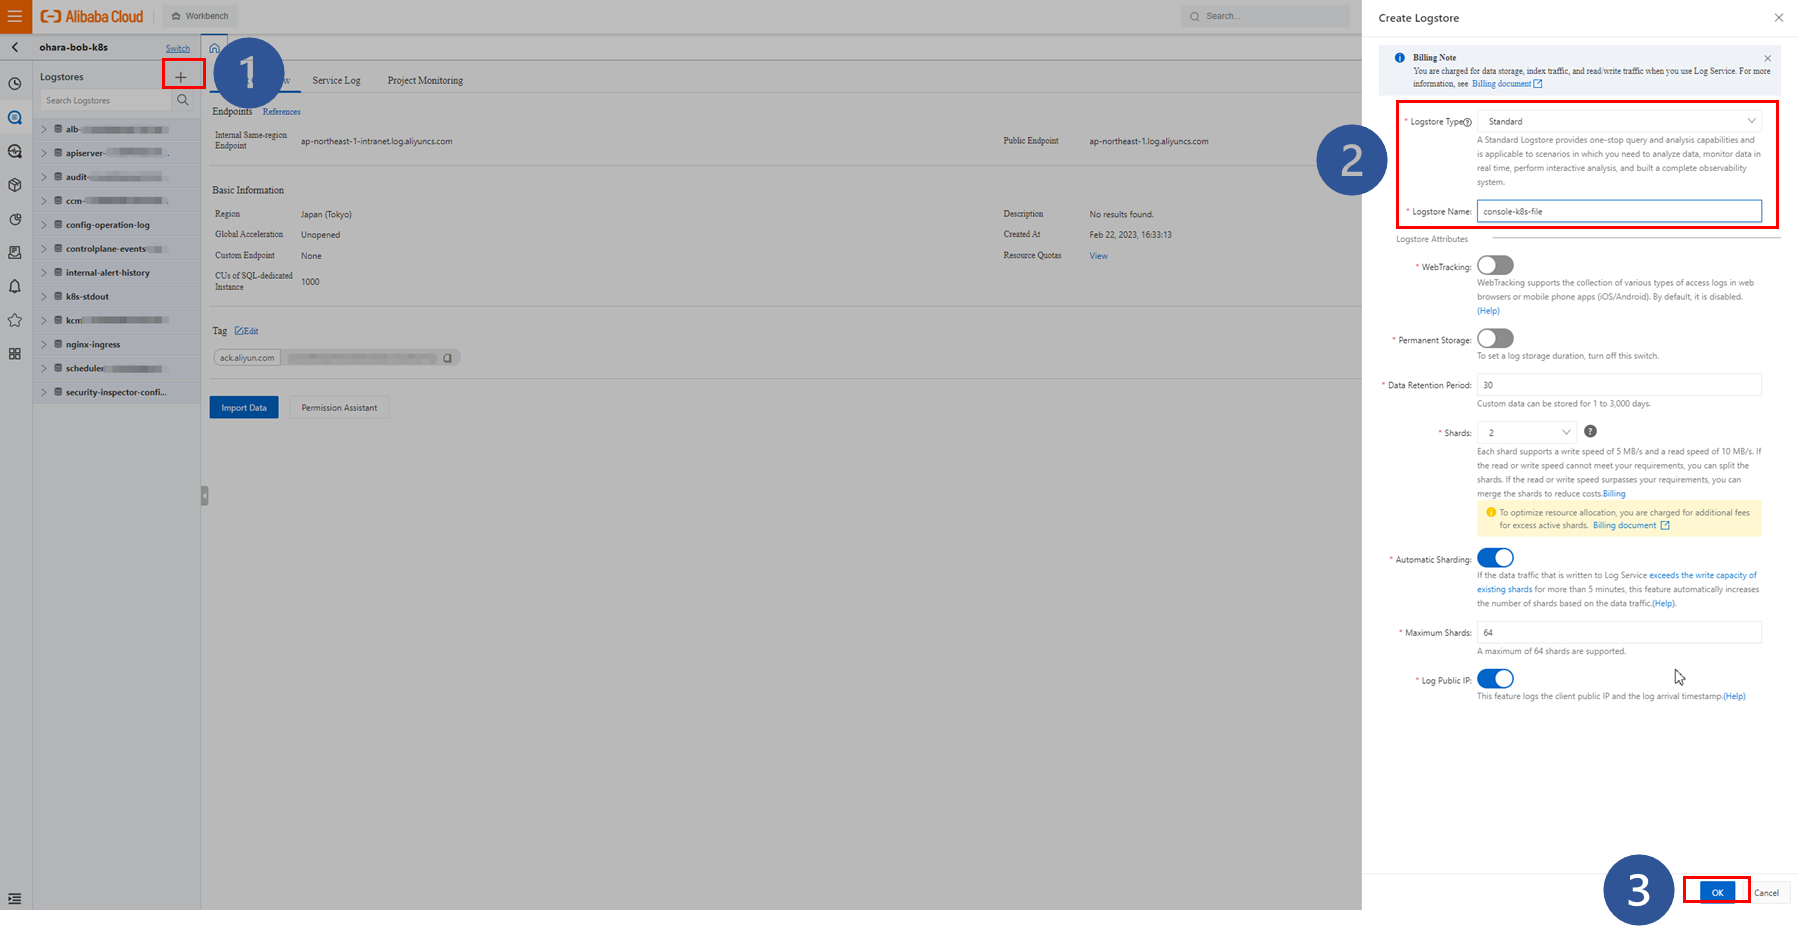
Access the Simple Log Service console and create a new Logstore.
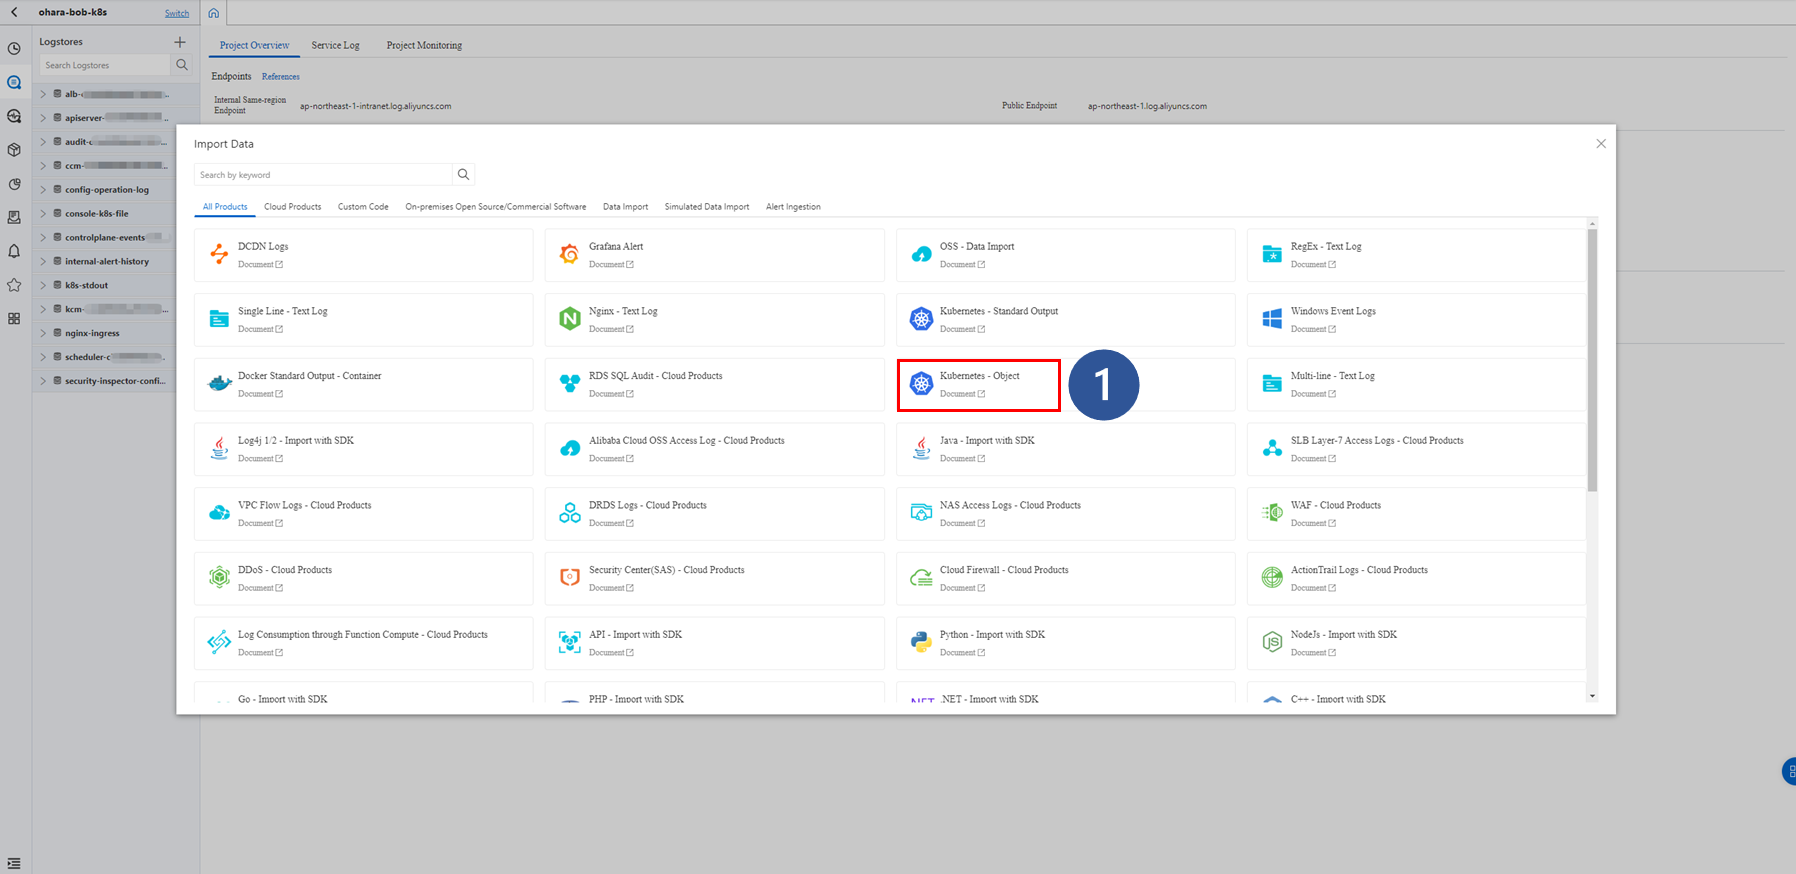
The destination Logstore is created, and the notification window is displayed. Click Data Import Wizard in the window to start configuring Logtail.



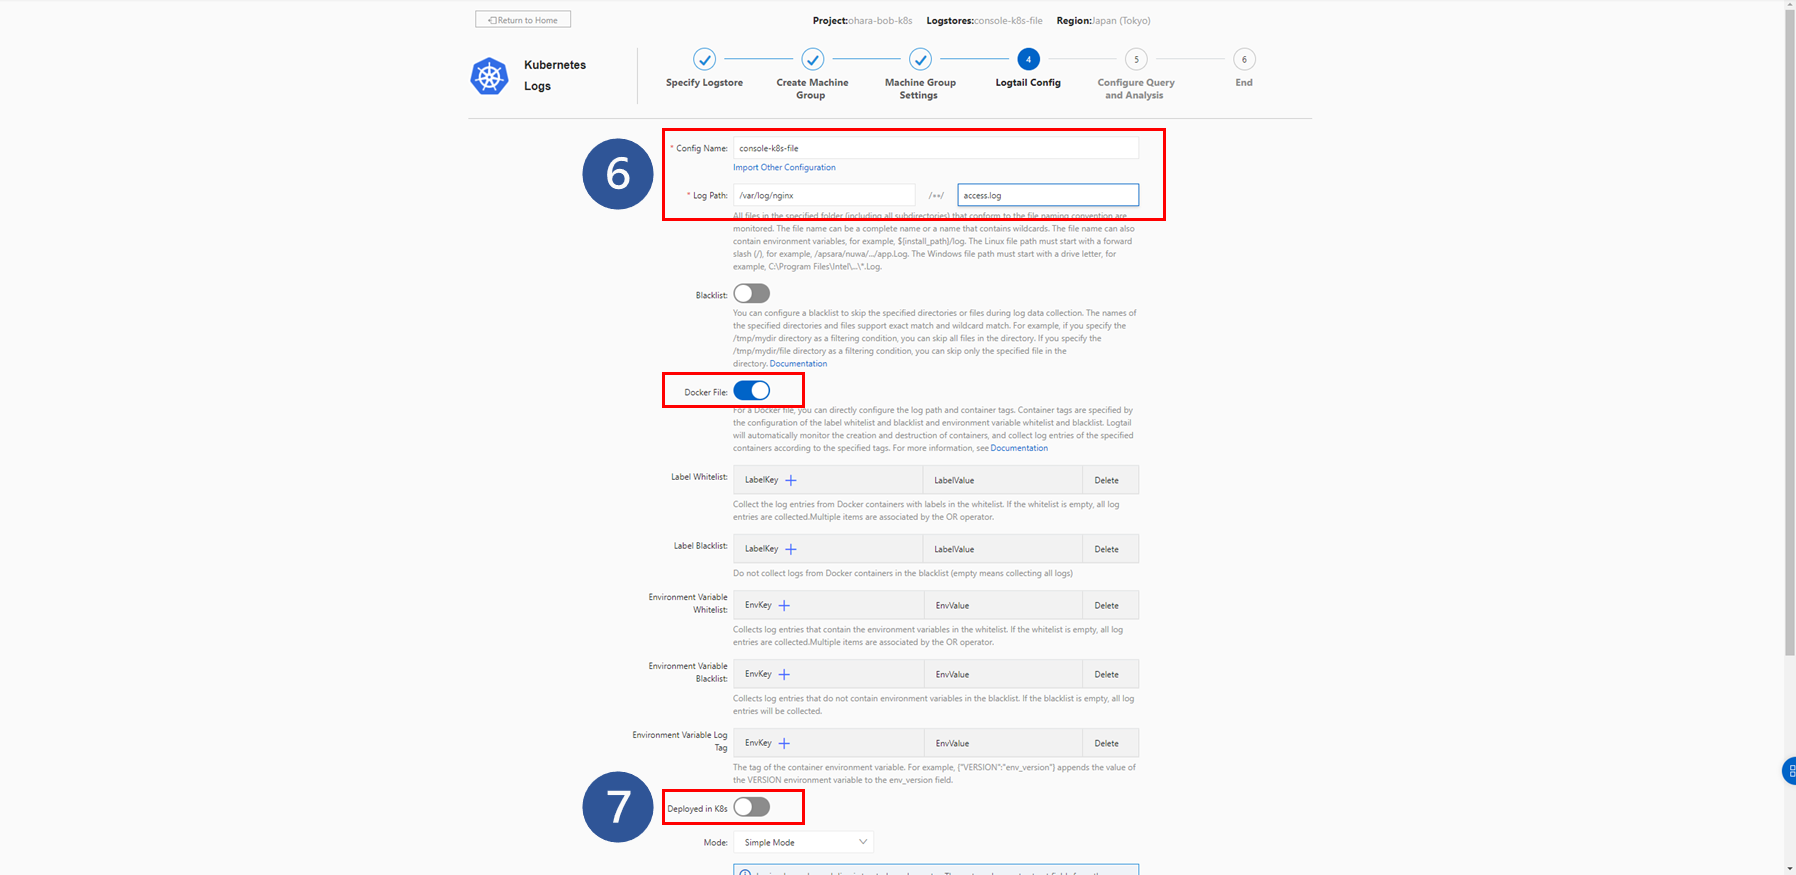
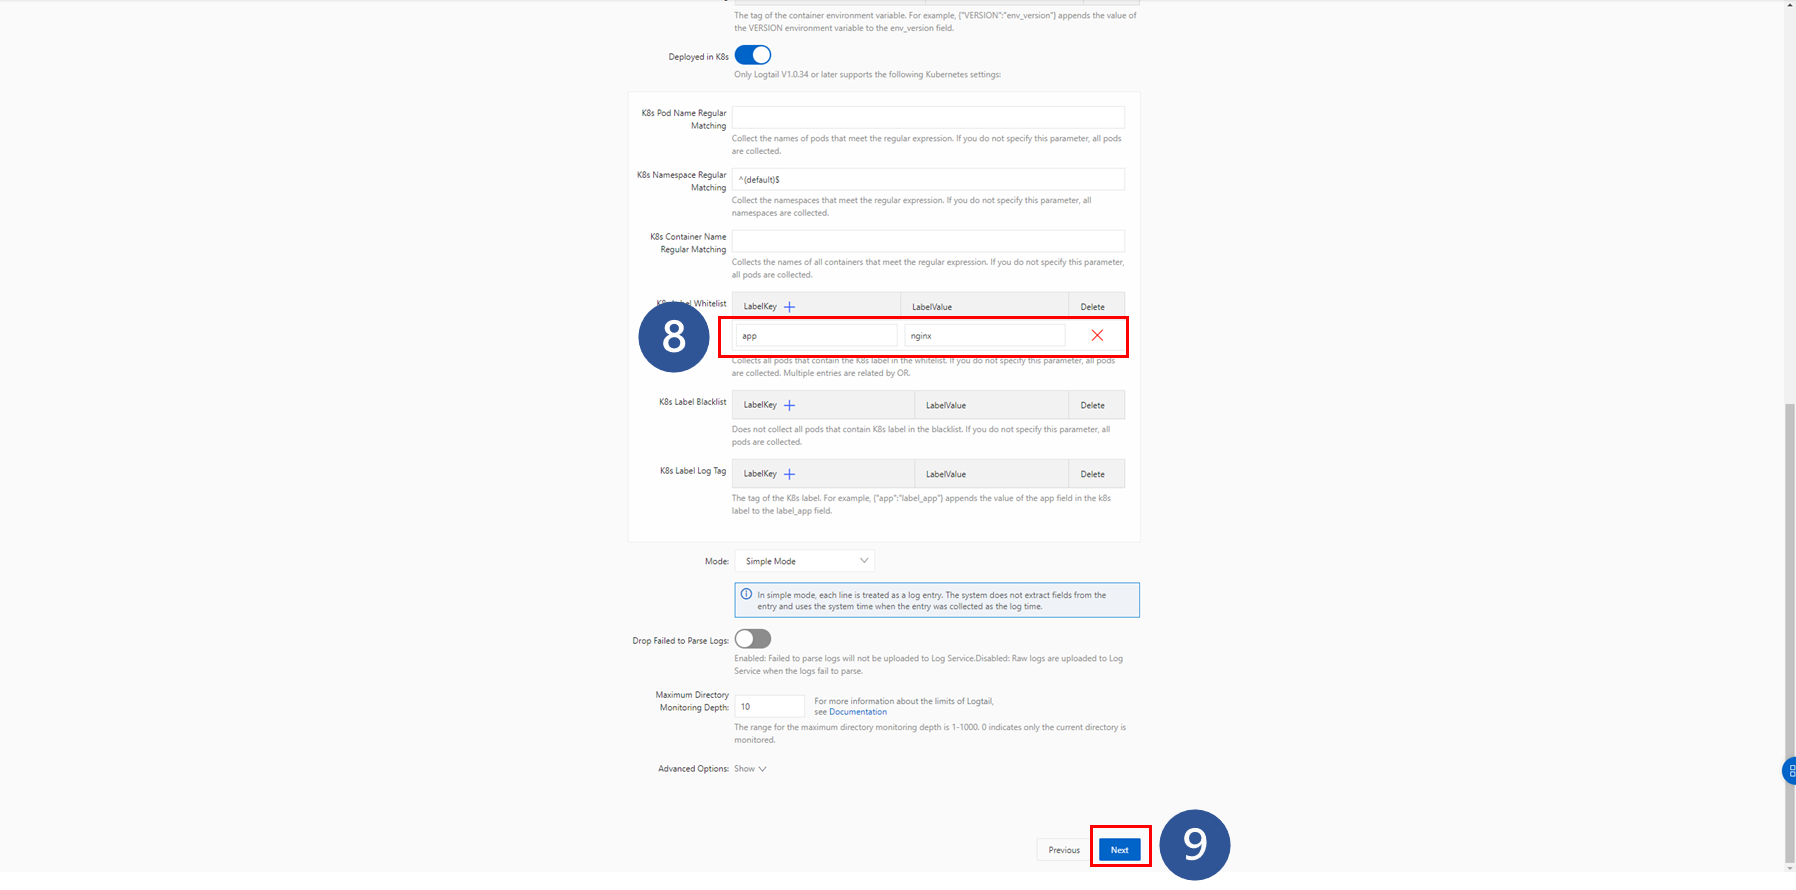
The data analysis mode can be changed before clicking Next. By default, it is set to Simple Mode and log data are collected in one row.
This can be updated based on your requirements. Options such as JSON Mode, Delimiter Mode, and Full Regex Mode are supported. This test uses the default Simple Mode.
The data can now be previewed on the page, and the log data are collected according to the Logtail configuration. If no data is collected here, double-check the settings and correct them.
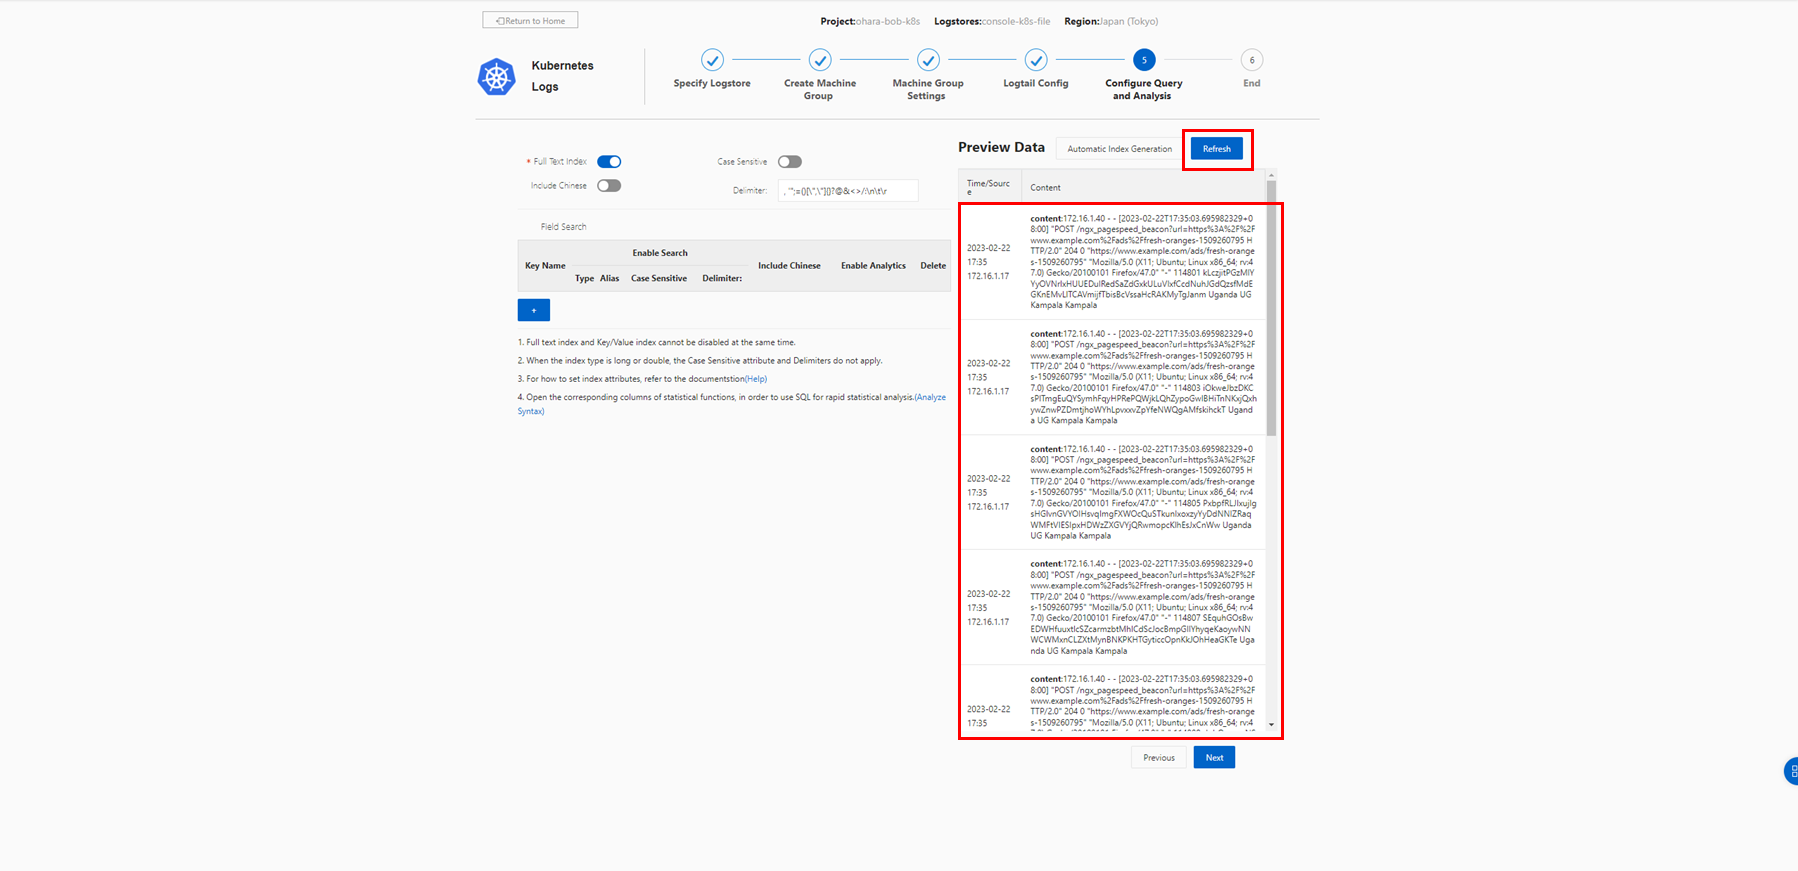
Click Automatic Index Generation to automatically generate indexes based on the collected data.
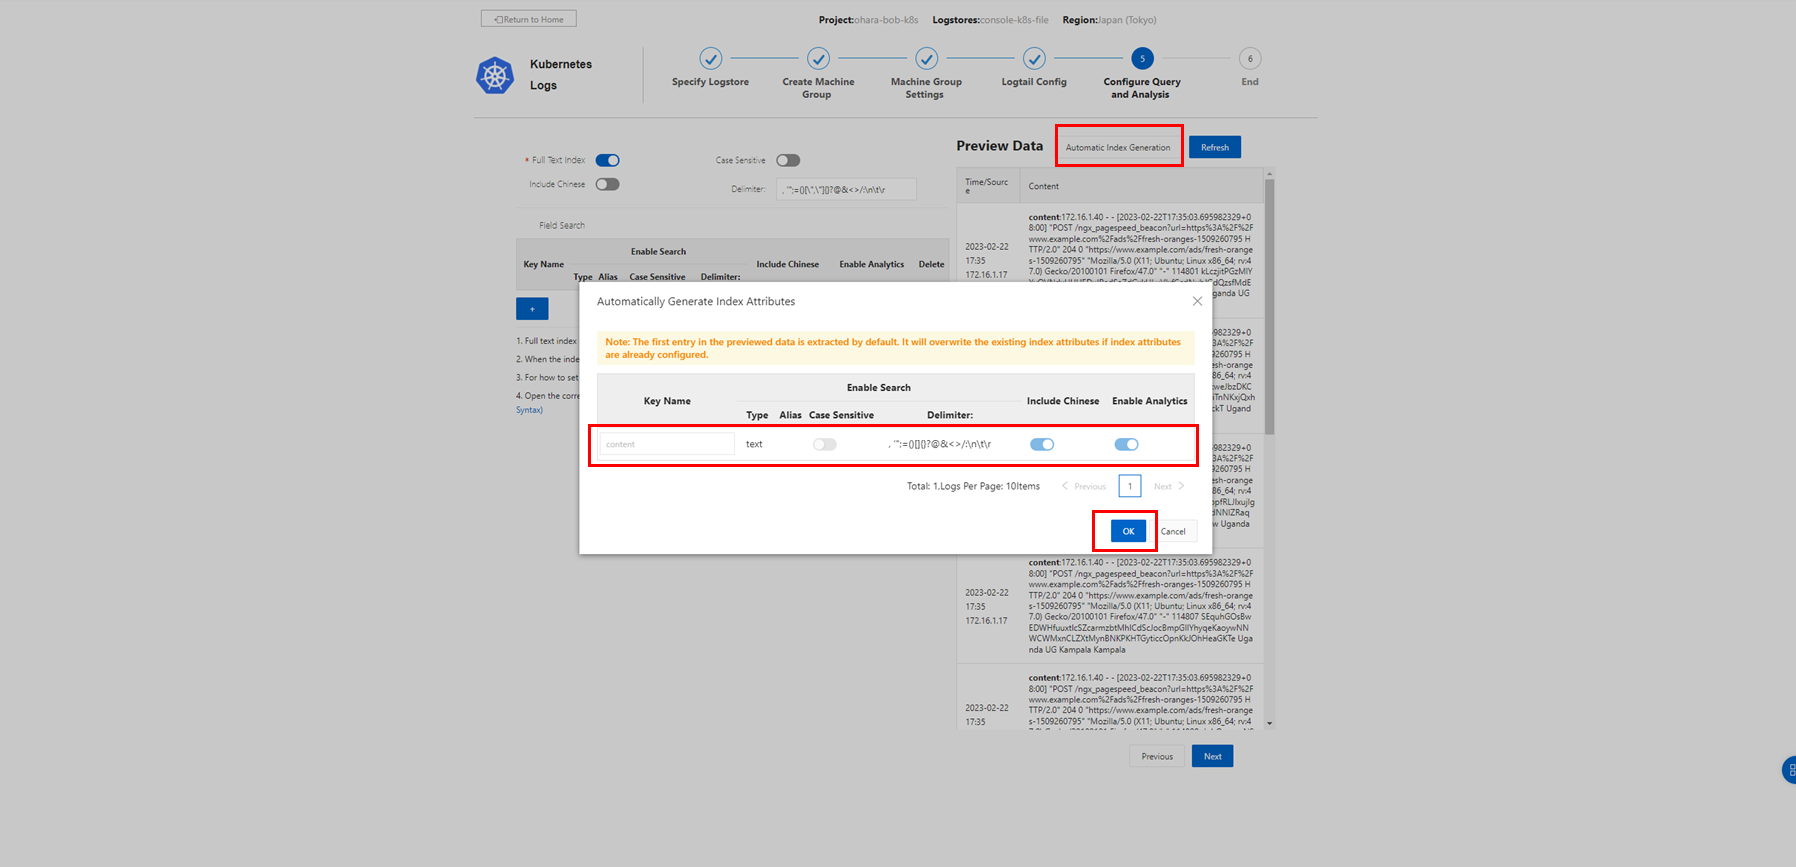
Since data are collected in Simple Mode, the whole row is recognized as one field named content.
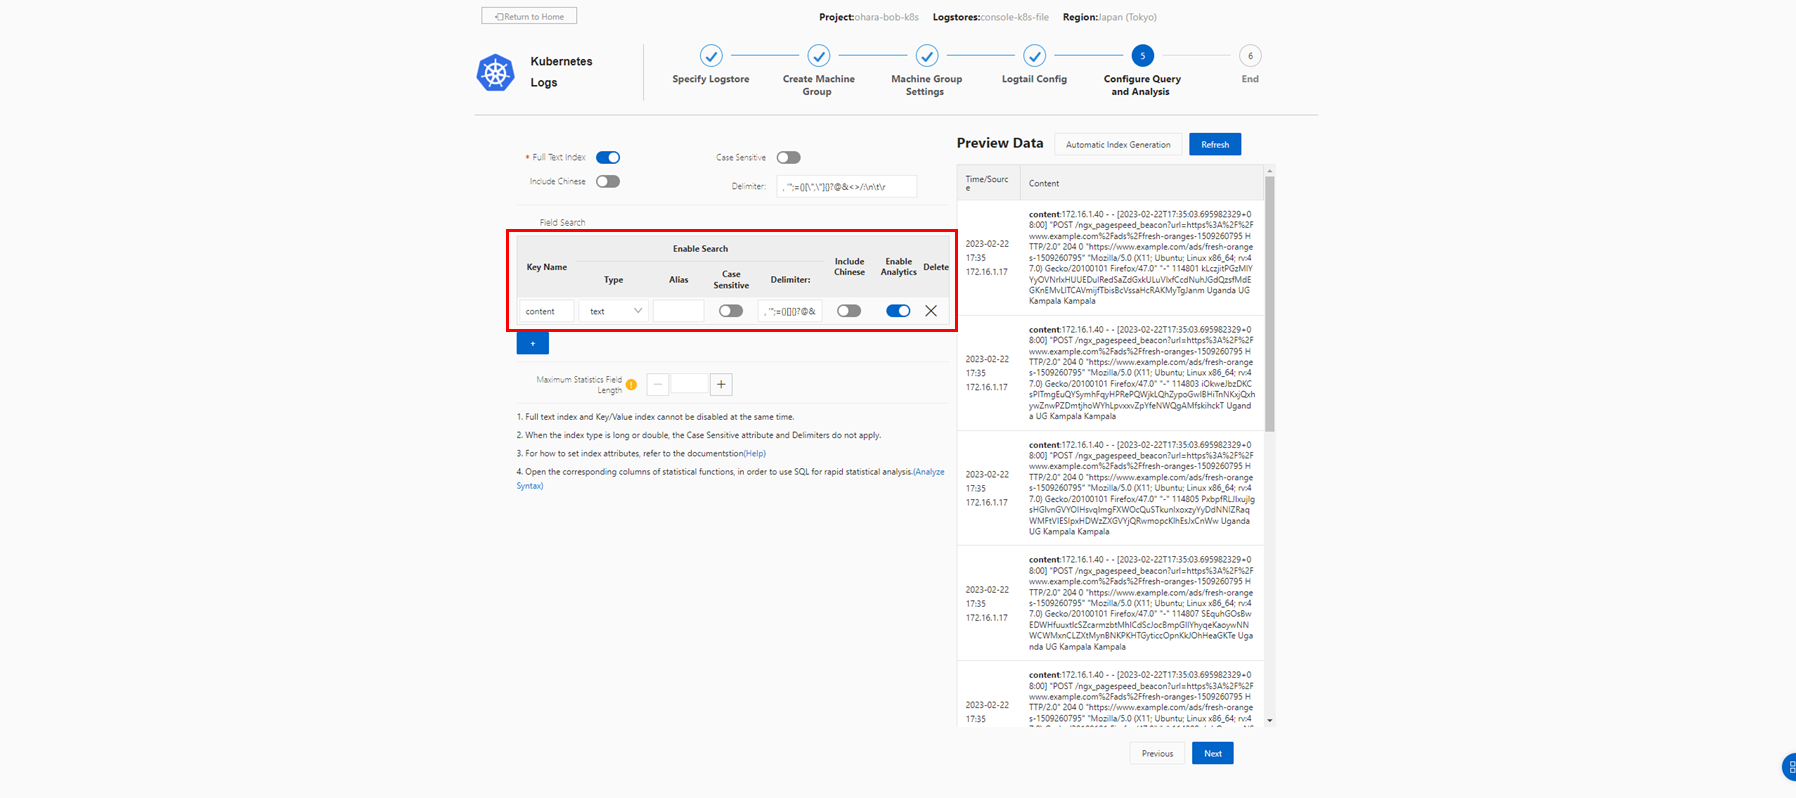
Click Next to complete configuration. The success message is displayed.
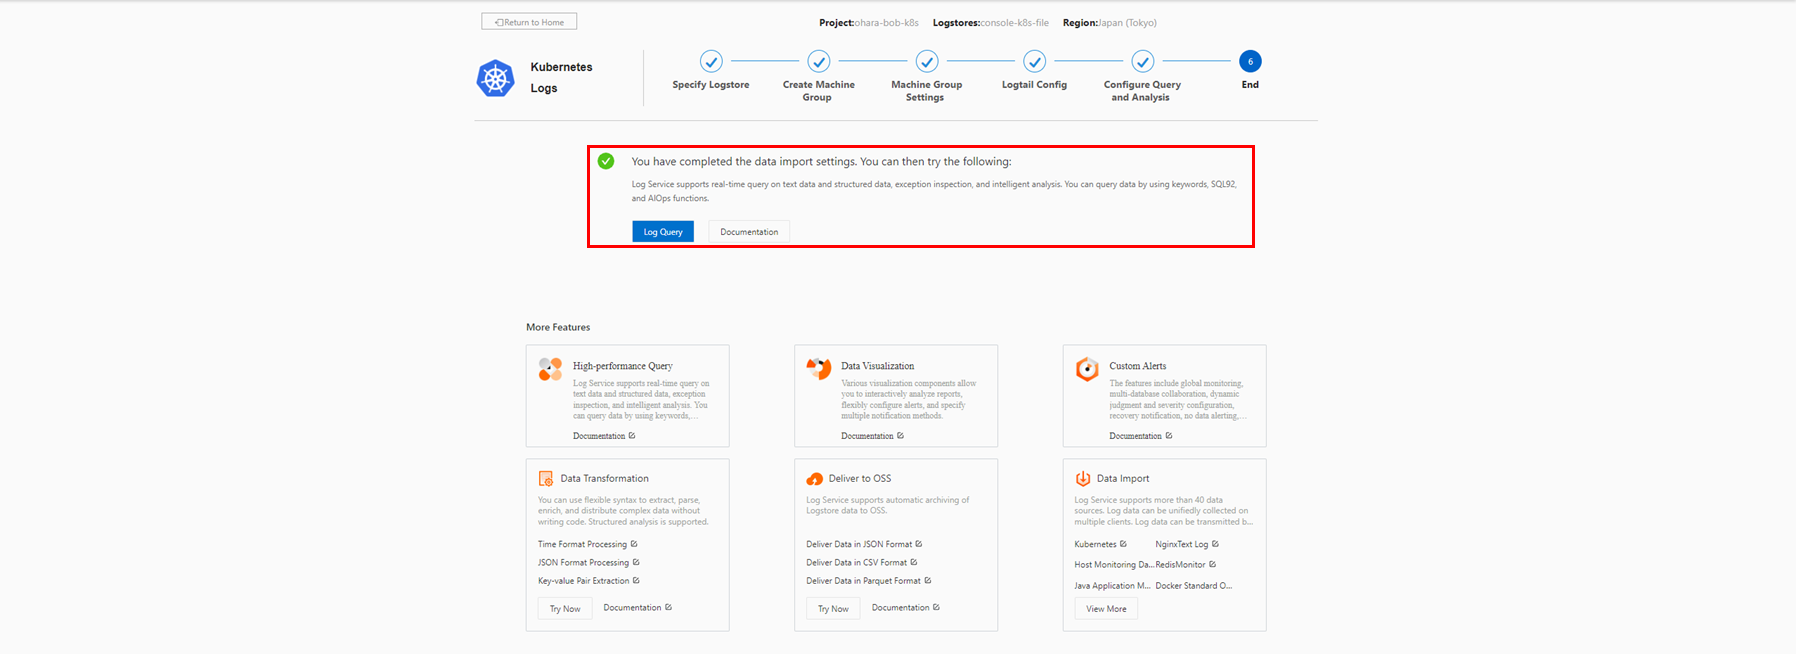
The collected logs can be checked in real time by clicking Log Query.
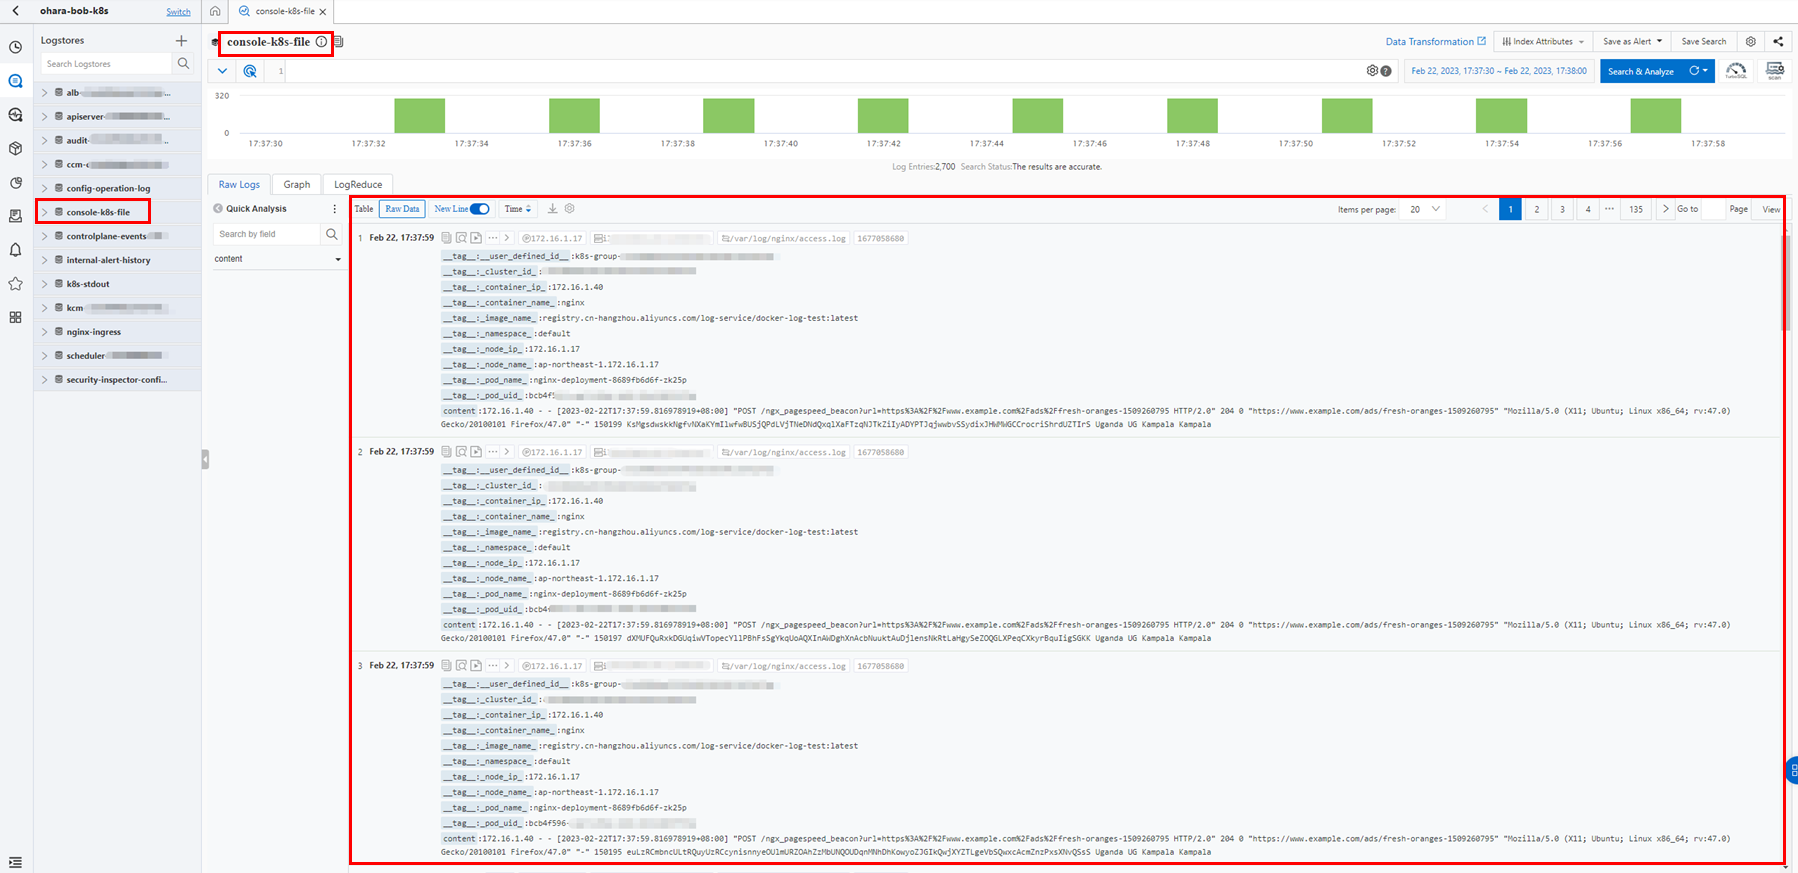
Check the Logtail configuration.
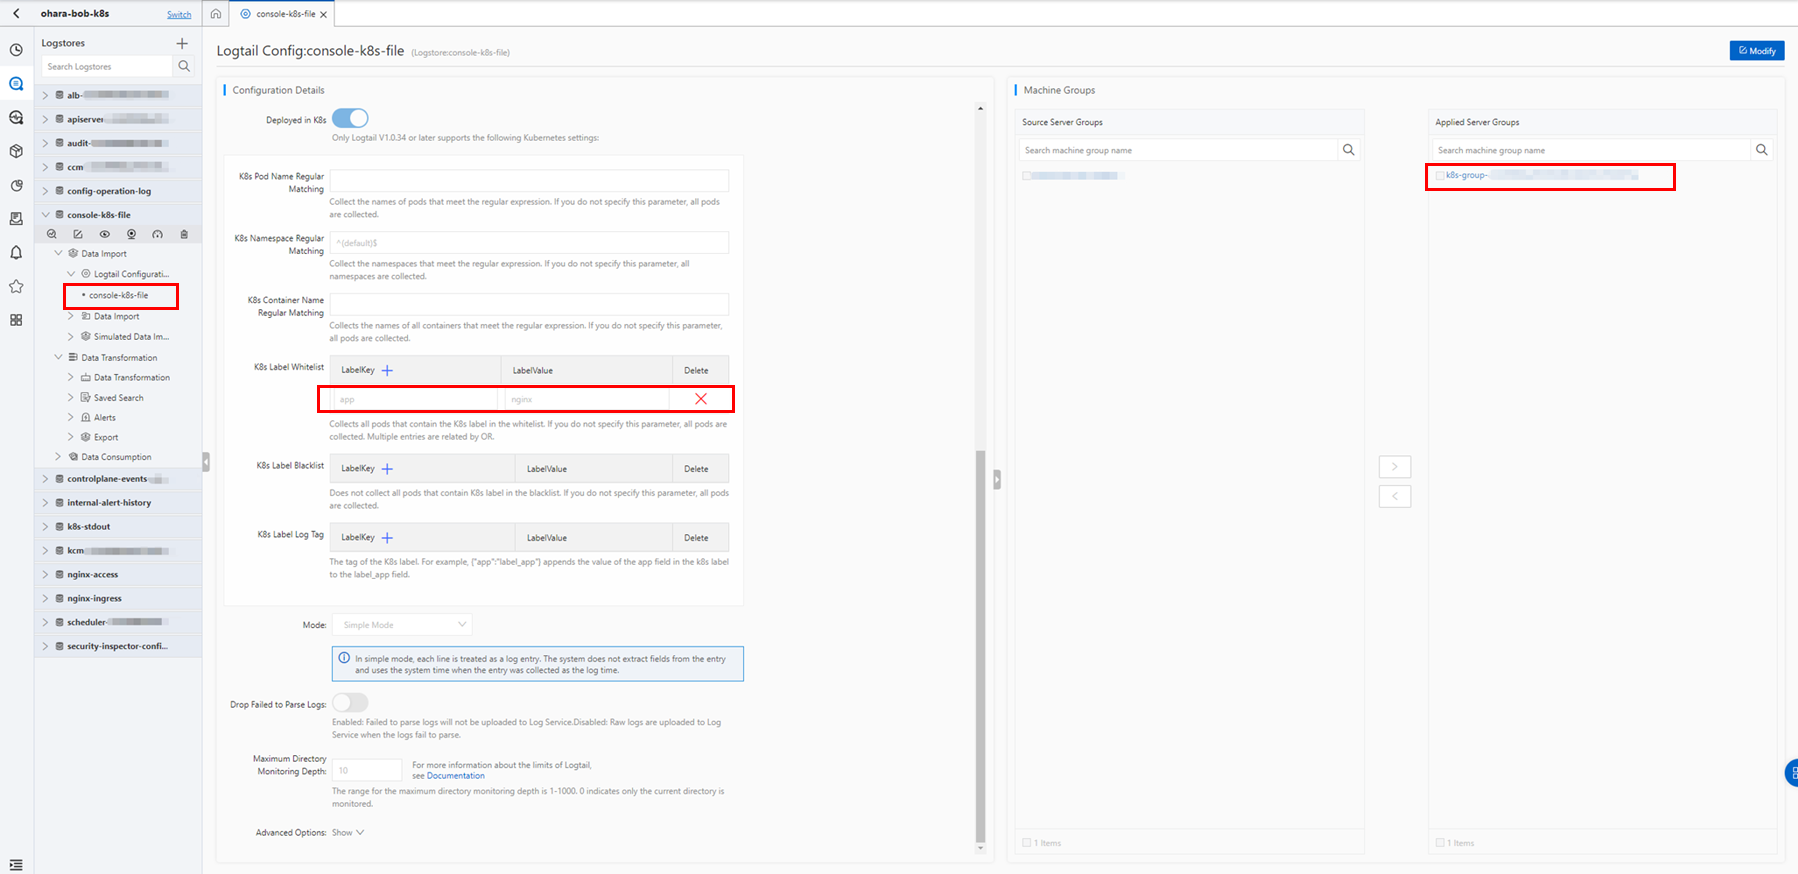
Prepare a YAML file for configuration as follows and create a CRD resource object in the same way.
Examples of Logtail configurations that are used to collect text logs:
https://www.alibabacloud.com/help/en/log-service/latest/collect-kubernetes-container-logs-in-daemonset-crd-mode#section-ncq-ic5-ooi
apiVersion: log.alibabacloud.com/v1alpha1
kind: AliyunLogConfig
metadata:
  name: simple-file-example
spec:
  logstore: k8s-file
  logtailConfig:
    inputType: file
    configName: simple-file-example
    inputDetail:
      logType: common_reg_log
      logPath: /var/log/nginx
      filePattern: access.log
      dockerFile: true
      IncludeK8sLabel:
        app: "nginx"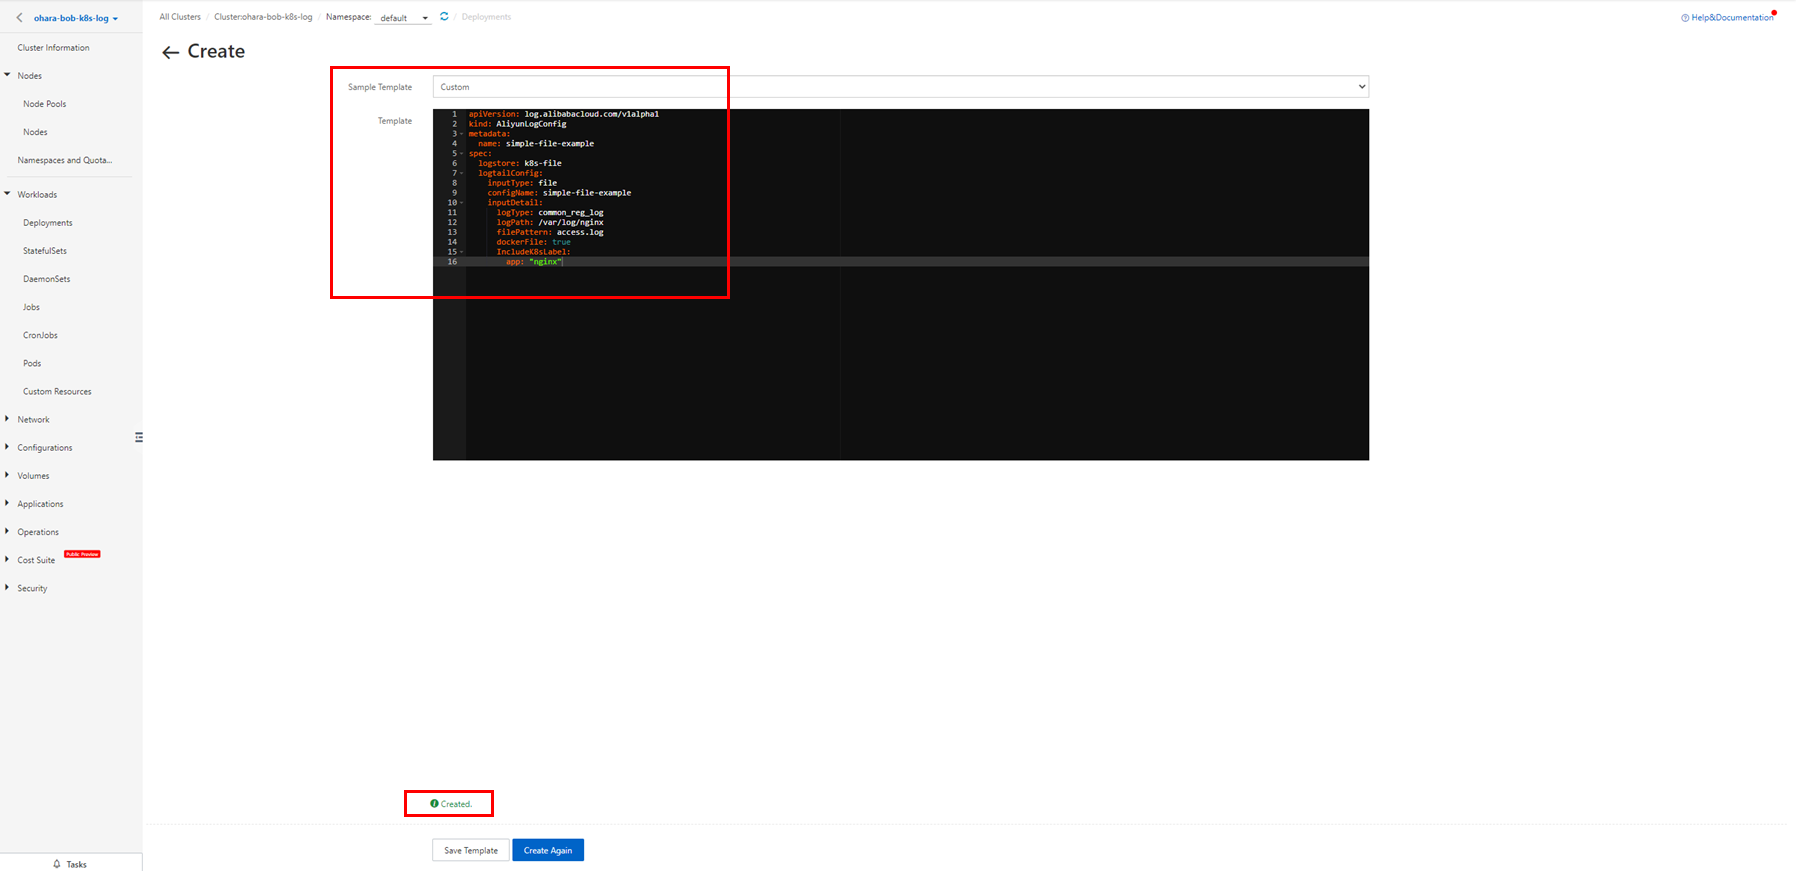

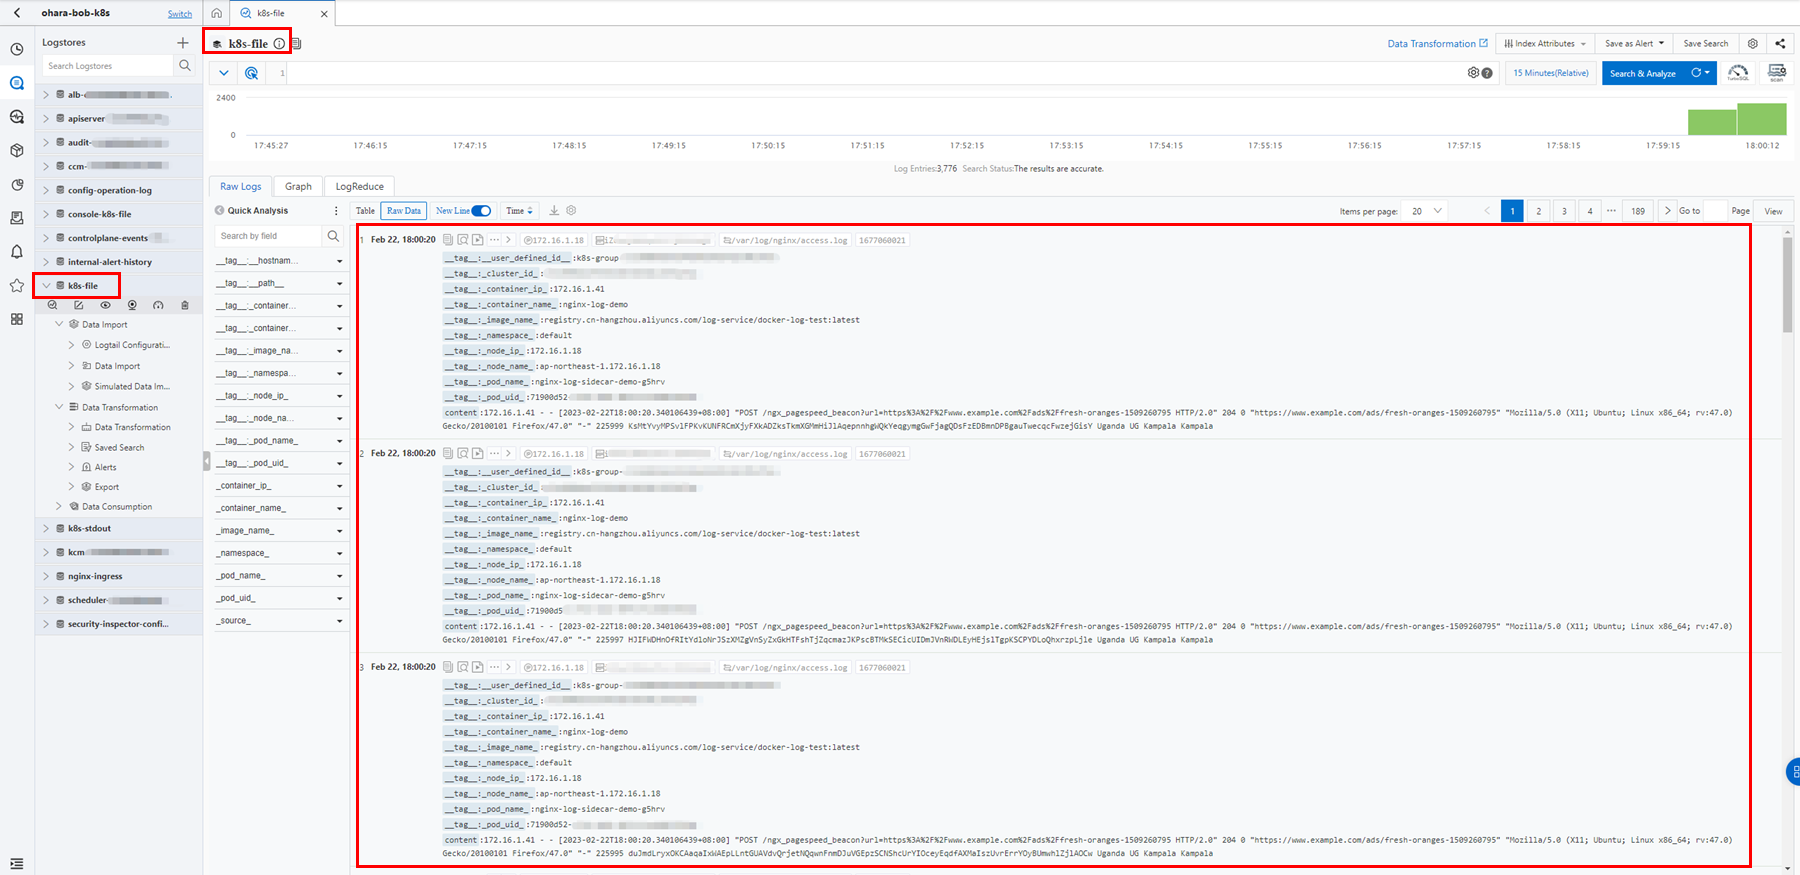
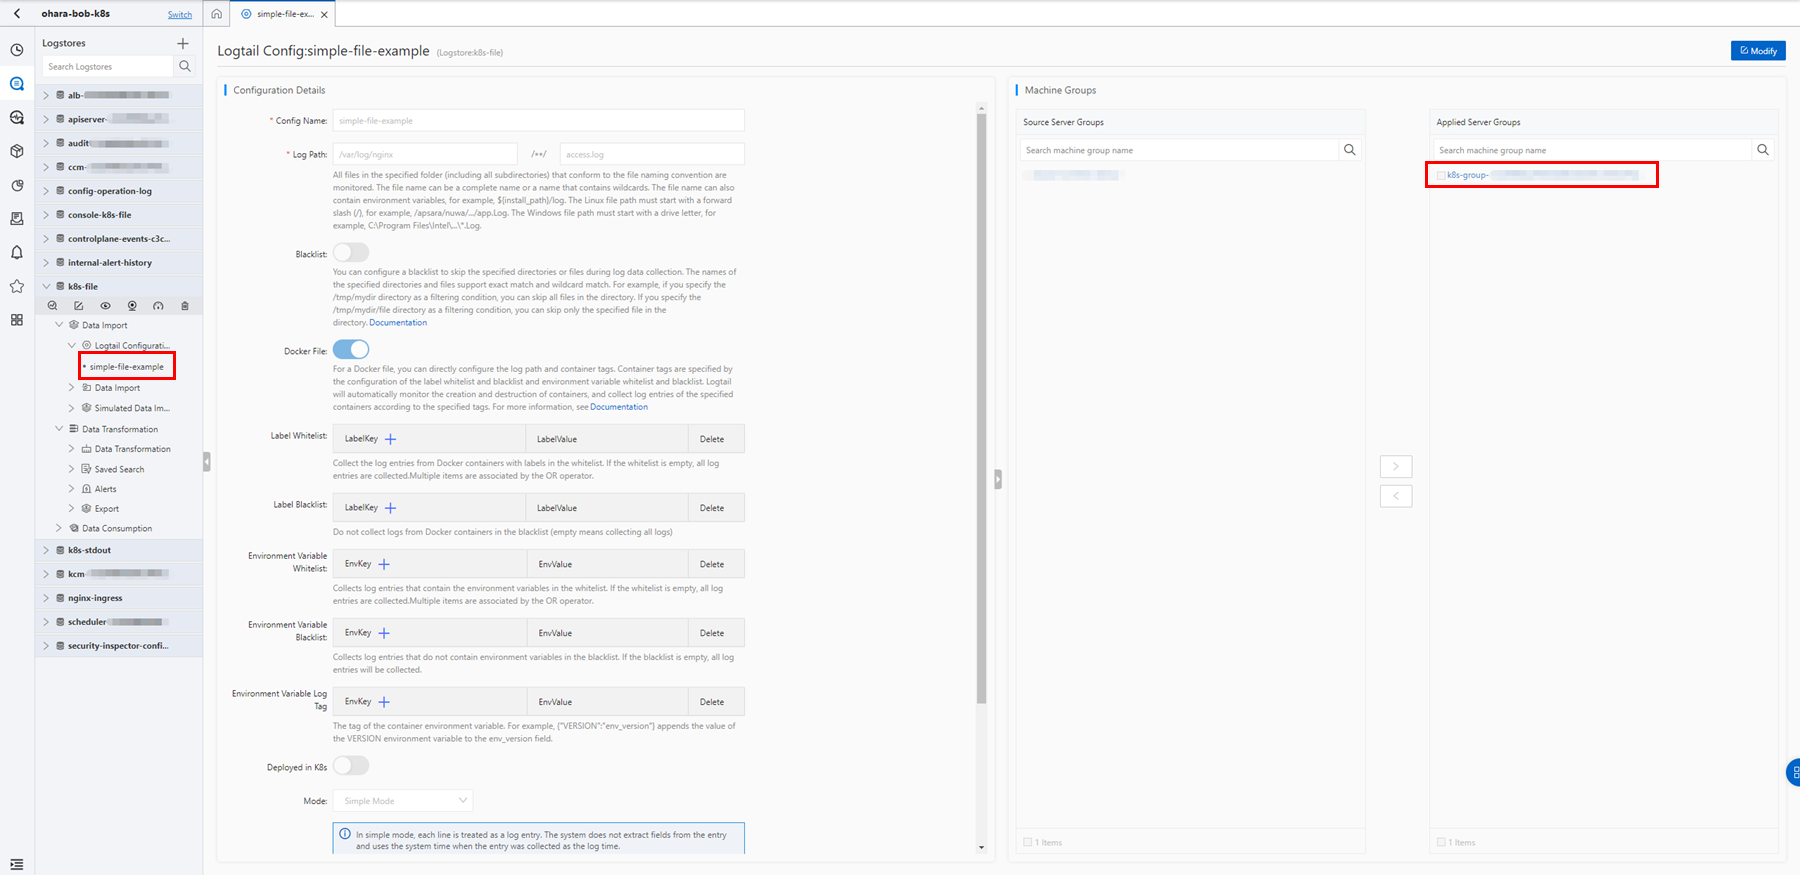
In the Simple Log Service console, check the created Logstore, collected log data, and Logtail configuration.
Use a Custom Resource Definition (CRD) to collect the container text logs in Sidecar mode.
In Sidecar mode, the Logtail container shares the log directory with the application container. The application container writes logs to the shared directory. Logtail monitors changes in log files in the shared directory and collects logs.
Sidecar container with a logging agent:
https://kubernetes.io/docs/concepts/cluster-administration/logging/#sidecar-container-with-a-logging-agent
How Pods manage multiple containers:
https://kubernetes.io/docs/concepts/workloads/pods/#how-pods-manage-multiple-containers
Prepare the CRD configuration YAML file and create a resource object in the same way.
Install Sidecar:
https://www.alibabacloud.com/help/en/log-service/latest/use-crds-to-collect-container-text-logs-in-sidecar-mode#section-34s-d39-pfp
apiVersion: batch/v1
kind: Job
metadata:
  name: nginx-log-sidecar-demo
  namespace: default
spec:
  template:
    metadata:
      name: nginx-log-sidecar-demo
    spec:
      restartPolicy: Never
      containers:
      - name: nginx-log-demo
        image: registry.cn-hangzhou.aliyuncs.com/log-service/docker-log-test:latest
        command: ["/bin/mock_log"]
        args: ["--log-type=nginx", "--stdout=false", "--stderr=true", "--path=/var/log/nginx/access.log", "--total-count=1000000000", "--logs-per-sec=100"]
        volumeMounts:
        - name: nginx-log
          mountPath: /var/log/nginx
      ##### logtail sidecar container
      - name: logtail
        # More information: https://cr.console.aliyun.com/repository/cn-hangzhou/log-service/logtail/detail
        # This image has been published in the entire region.
        image: registry.cn-hangzhou.aliyuncs.com/log-service/logtail:latest
        # After receiving sigterm, the logtail stops 10 seconds later.
        command:
        - sh
        - -c
        - /usr/local/ilogtail/run_logtail.sh 10
        livenessProbe:
          exec:
            command:
            - /etc/init.d/ilogtaild
            - status
          initialDelaySeconds: 30
          periodSeconds: 30
        env:
          ##### Basic settings
          # user id
          - name: "ALIYUN_LOGTAIL_USER_ID"
            value: "${your_aliyun_user_id}"
          # user defined id
          - name: "ALIYUN_LOGTAIL_USER_DEFINED_ID"
            value: "${your_machine_group_user_defined_id}"
          # The configuration file path in the Logtail container
          - name: "ALIYUN_LOGTAIL_CONFIG"
            value: "/etc/ilogtail/conf/${your_region_config}/ilogtail_config.json"
          ##### Event tag settings
          - name: "ALIYUN_LOG_ENV_TAGS"
            value: "_pod_name_|_pod_ip_|_namespace_|_node_name_|_node_ip_"
          - name: "_pod_name_"
            valueFrom:
              fieldRef:
                fieldPath: metadata.name
          - name: "_pod_ip_"
            valueFrom:
              fieldRef:
                fieldPath: status.podIP
          - name: "_namespace_"
            valueFrom:
              fieldRef:
                fieldPath: metadata.namespace
          - name: "_node_name_"
            valueFrom:
              fieldRef:
                fieldPath: spec.nodeName
          - name: "_node_ip_"
            valueFrom:
              fieldRef:
                fieldPath: status.hostIP
        volumeMounts:
        - name: nginx-log
          mountPath: /var/log/nginx
      ##### Sharing volume information
      volumes:
      - name: nginx-log
        emptyDir: {}

---

apiVersion: log.alibabacloud.com/v1alpha1
kind: AliyunLogConfig
metadata:
  name: nginx-log-access-example
spec:
  project: ohara-bob-k8s
  logstore: nginx-access
  machineGroups:
  - ${your_machine_group_user_defined_id}
  logtailConfig:
    inputType: file
    configName: nginx-log-access-example
    inputDetail:
      logType: common_reg_log
      logPath: /var/log/nginx
      filePattern: access.log
      dockerFile: false
Please update the below configuration based on your own environment before using the configuration file.
…
         ##### Basic settings
          # user id
          - name: "ALIYUN_LOGTAIL_USER_ID"
            value: "${your_aliyun_user_id}"
          # user defined id
          - name: "ALIYUN_LOGTAIL_USER_DEFINED_ID"
            value: "${your_machine_group_user_defined_id}"
          # The configuration file path in the Logtail container
          - name: "ALIYUN_LOGTAIL_CONFIG"
            value: "/etc/ilogtail/conf/${your_region_config}/ilogtail_config.json"
          ##### Event tag settings
…
spec:
  project: ohara-bob-k8s
  logstore: nginx-access
  machineGroups:
  - ${your_machine_group_user_defined_id}
  logtailConfig:
…
● $ {Your_aliyun_user_id}: your Alibaba Cloud account ID.
● $ {Your_machine_group_user_defined_id}: the custom ID of the machine group. Example: nginx-log-sidecar.
● $ {Your_region_config}: the ID of the region where the project resides and the type of network used by the project. For example, set this parameter to ap-northeast-1 to collect log data through the internal network in the Japan (Tokyo) region, or set this parameter to ap-northeast-1-internet to collect log data through the Internet.
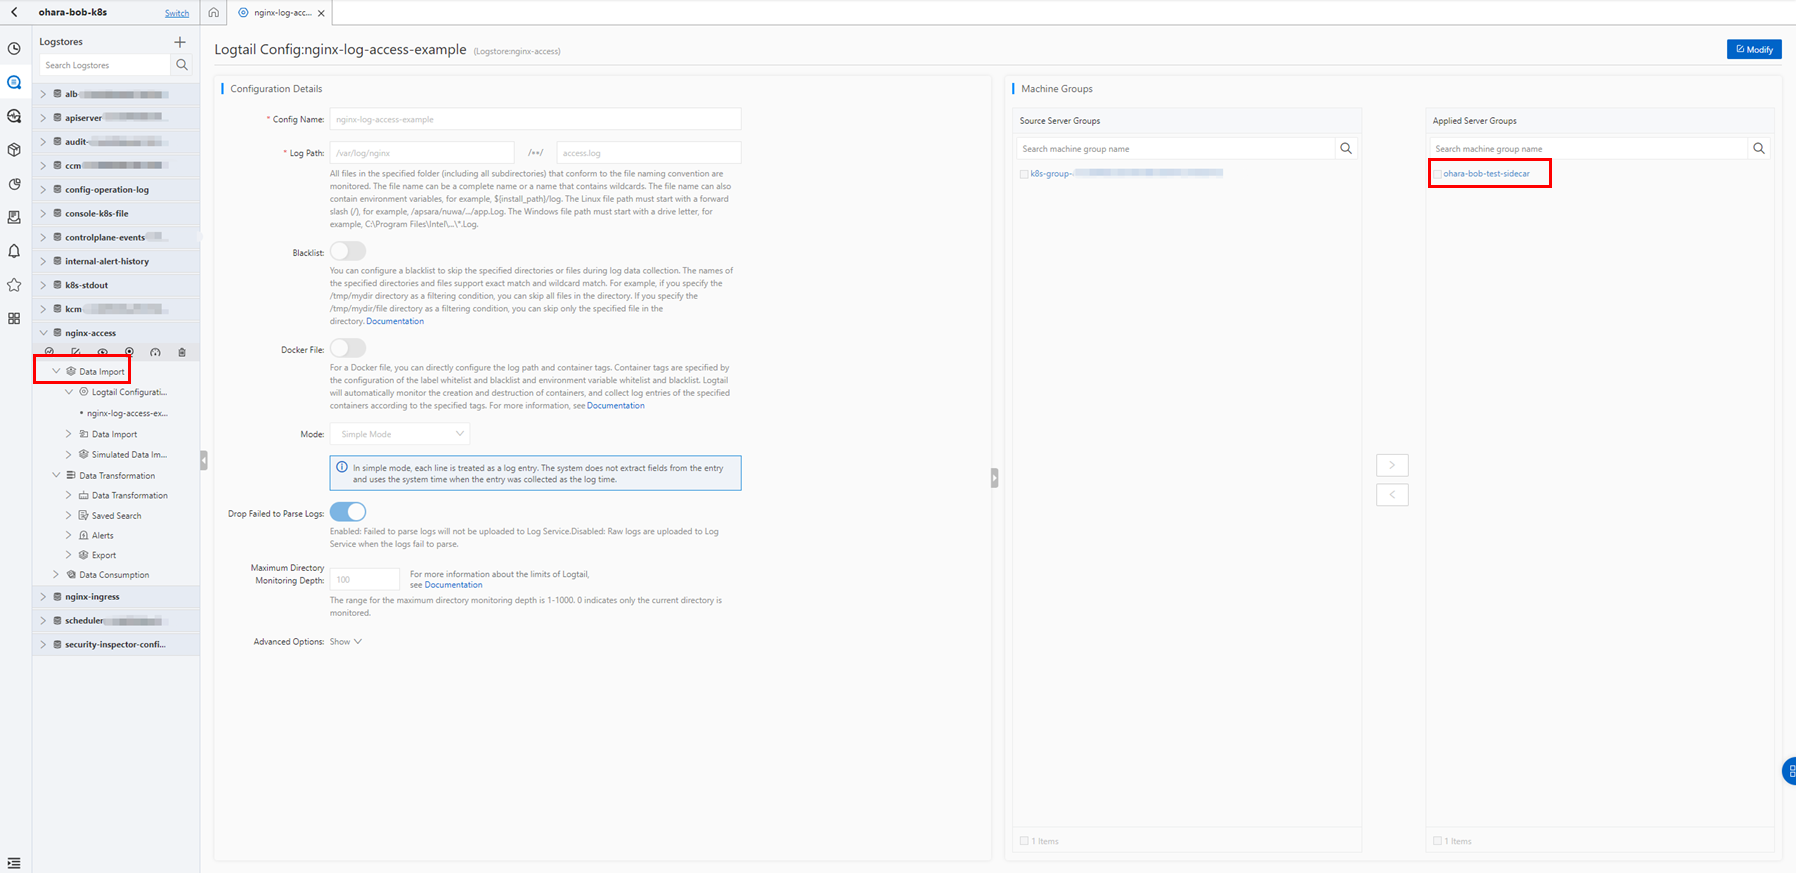
Make sure that ${your_machine_group_user_defined_id} is defined the same in Job and CRD.
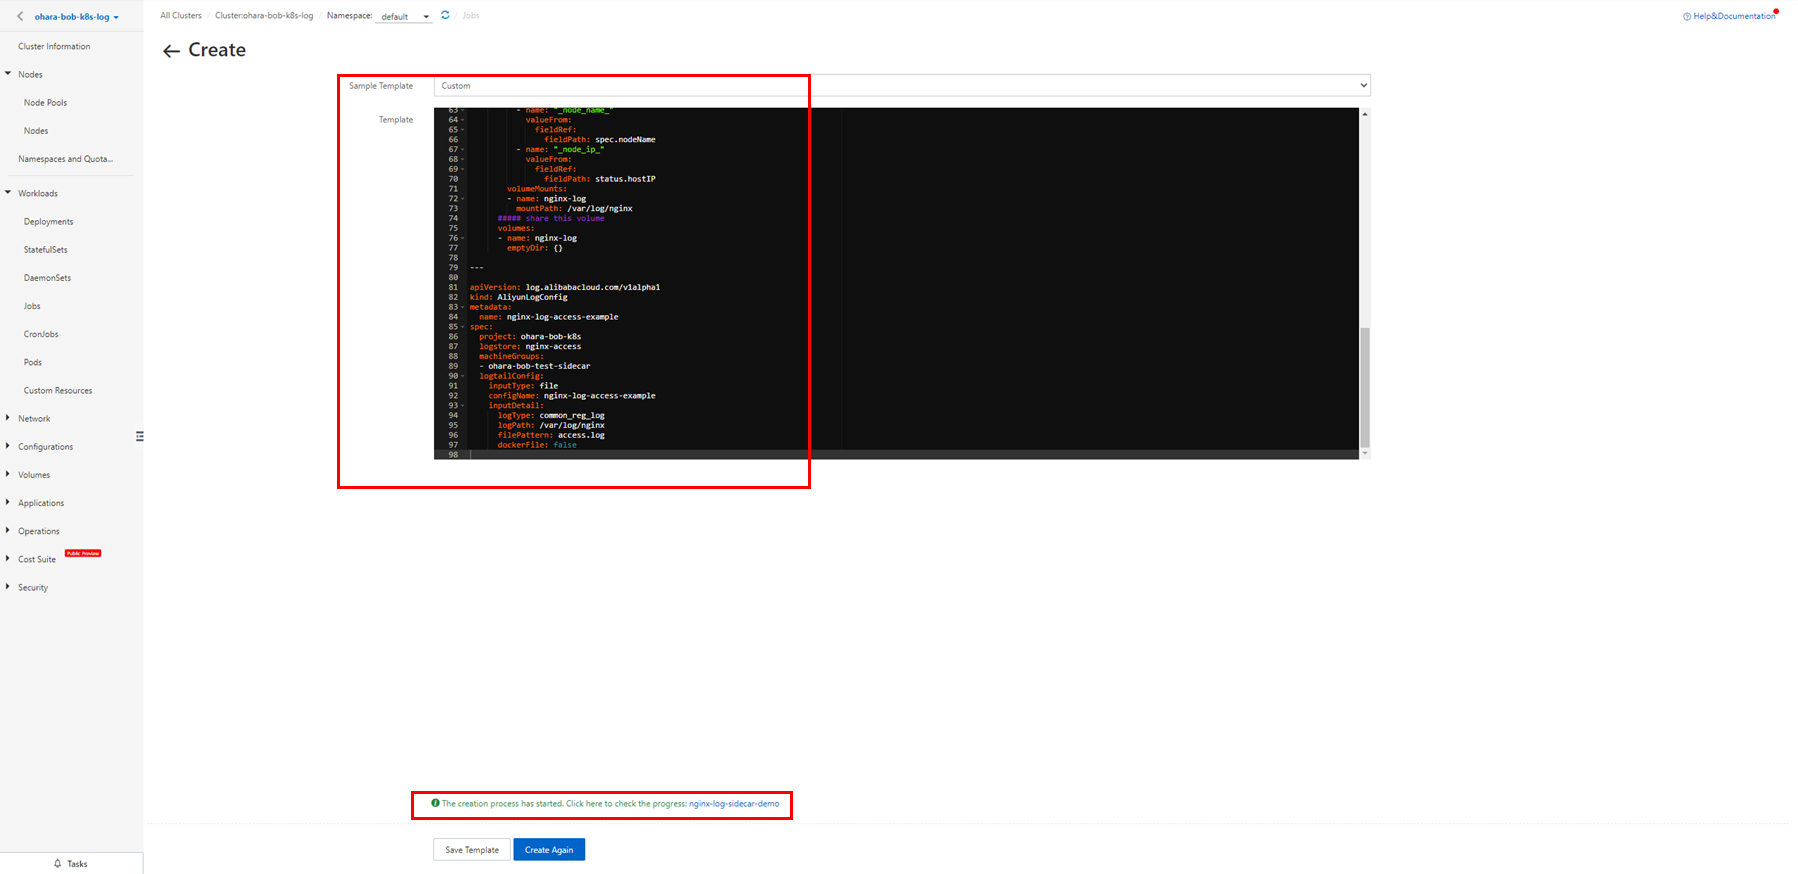
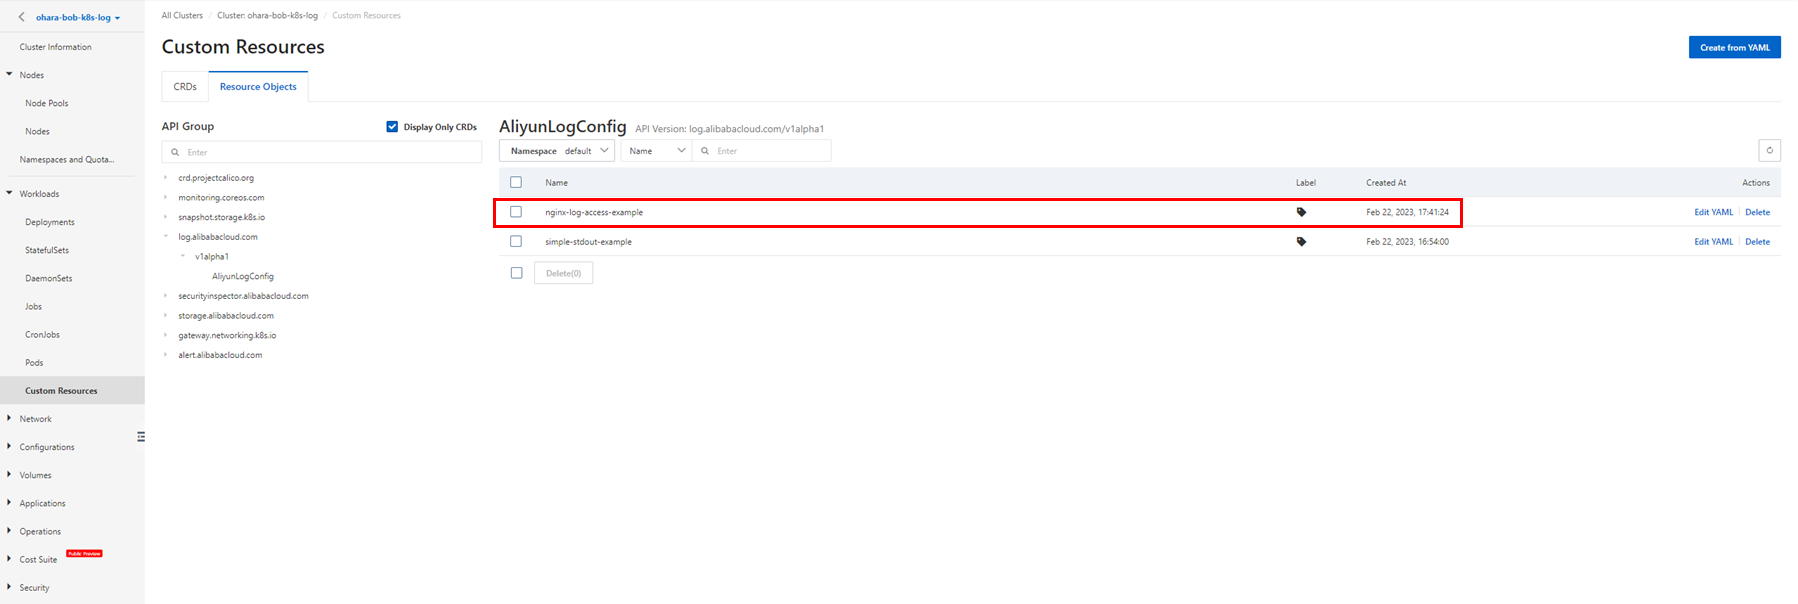

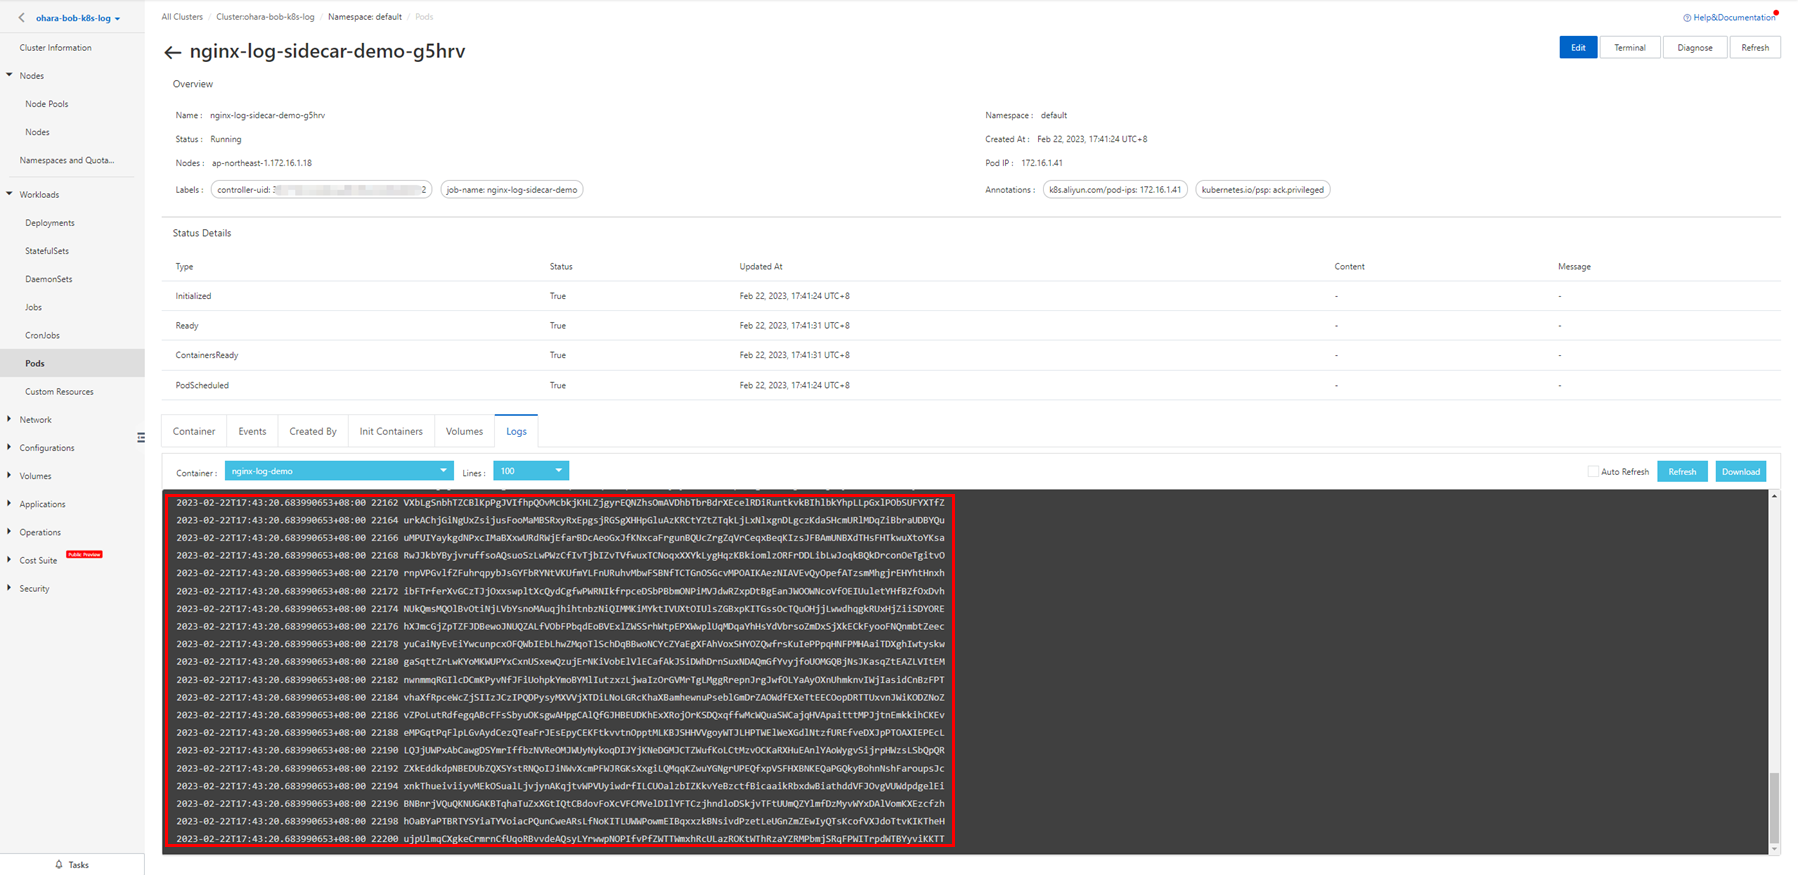
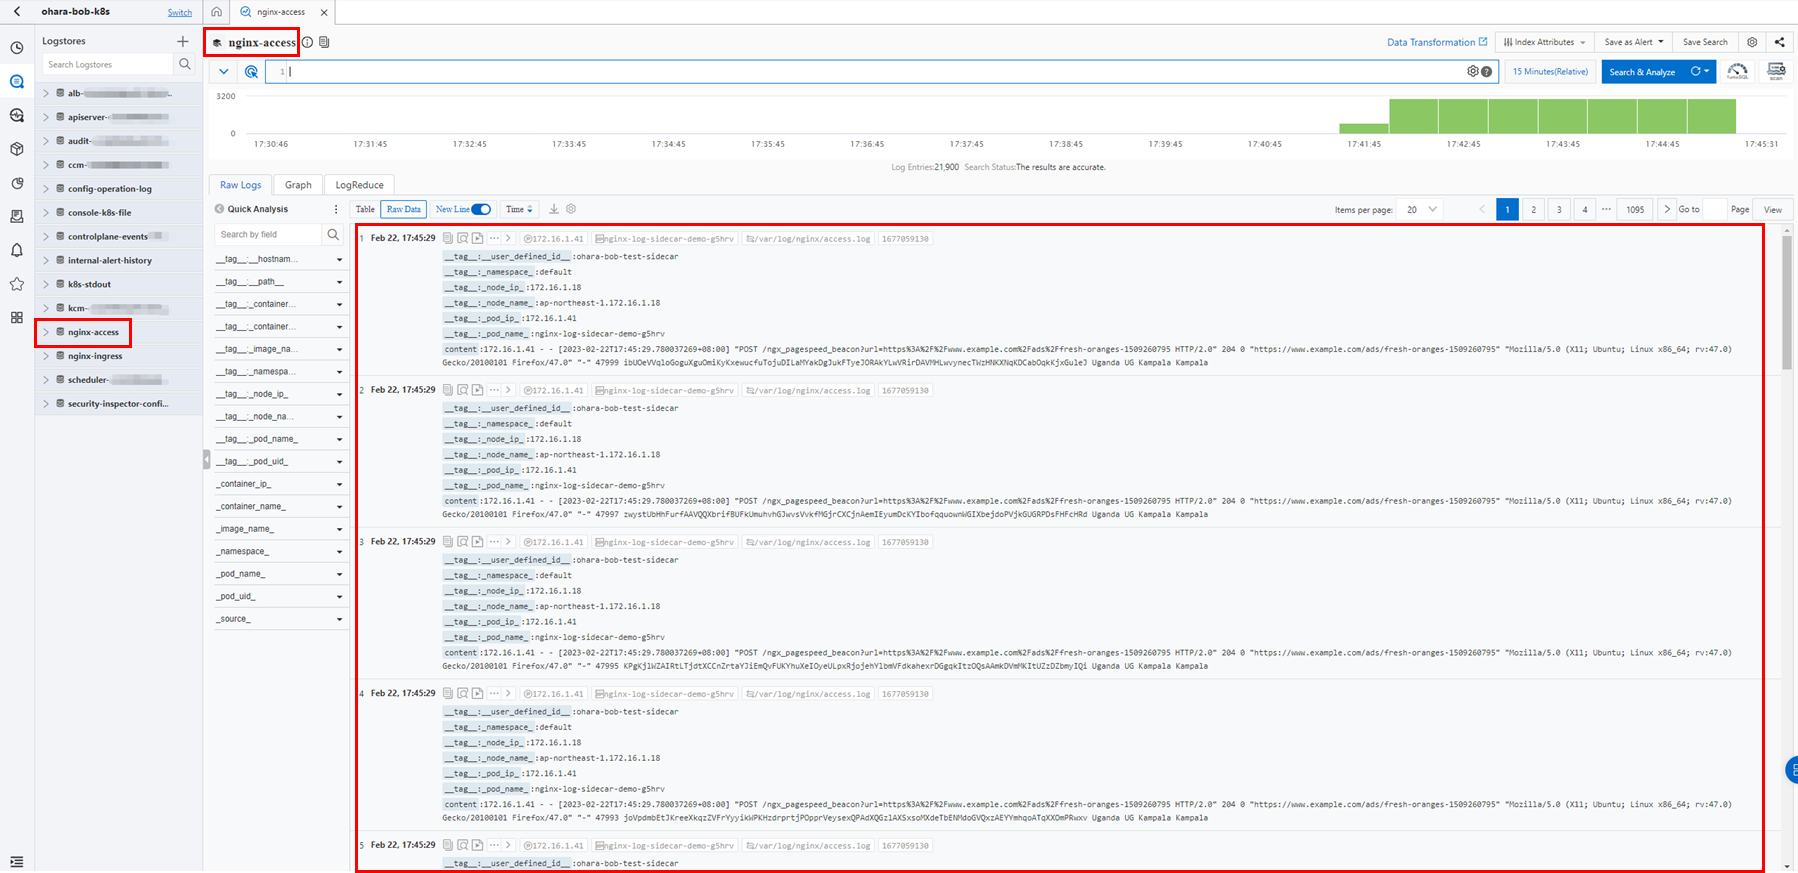
In the Simple Log Service console, check the created Logstore, collected log data, and Logtail configuration. You can verify that the applied server group information is the same as the value of ${your_machine_group_user_defined_id} you configured in the configuration file.
Though this article only covered the collection method, you can also use the queries to perform a simple analysis on the collected data or use the results of the queries to make alert notifications.
Simple Log Service is a good product for streamlining operations and reducing load. If you have built your own Syslog server, please consider using it.
If there is a discrepancy between the content of this article and the Alibaba Cloud Official Website, please give priority to the information provided on the Official Website.
This article is a translated piece of work from SoftBank:
https://www.softbank.jp/biz/blog/cloud-technology/articles/202303/logservice-ack/
https://www.softbank.jp/biz/blog/cloud-technology/articles/202303/logservice-ack-2/
Disclaimer: The views expressed herein are for reference only and don't necessarily represent the official views of Alibaba Cloud.
Introducing the New Full-stack Observability in Simple Log Service
Alibaba Cloud Community - March 22, 2024
Alibaba Container Service - March 12, 2024
Alibaba Container Service - April 8, 2025
Alibaba Developer - June 30, 2020
Alibaba Cloud Community - December 28, 2022
H Ohara - March 13, 2024
 Simple Log Service
An all-in-one service for log-type data
Learn More Storage Capacity Unit
Plan and optimize your storage budget with flexible storage services
Learn More Hybrid Cloud Storage
A cost-effective, efficient and easy-to-manage hybrid cloud storage solution.
Learn More Hybrid Cloud Distributed Storage
Provides scalable, distributed, and high-performance block storage and object storage services in a software-defined manner.
Learn MoreMore Posts by H Ohara