Grafana is an open-source data visualization tool that simplifies the process of creating data charts for monitoring and statistics. When using Grafana, it needs to be combined with data collection tools like Managed Service for Prometheus (Prometheus) and Elasticsearch. Grafana supports various data sources such as Elasticsearch, MySQL, Prometheus, Zabbix, InfluxDB, PostgreSQL, Graphite, and OpenTSDB.
Managed Service for Grafana is a cloud-native visualization platform for data operations. It provides users with an O&M-free environment to run Grafana, allowing for quick deployment. By default, it integrates data sources from various Alibaba Cloud services such as database services, Message Queue services, Prometheus, and Simple Log Service. It also offers rich data dashboards for more detailed O&M and monitoring.
Managed Service for Grafana efficiently analyzes and displays metrics, logs, and traces without the need for server configuration or software updates, reducing maintenance complexity and workload. Additionally, it leverages the powerful cloud-native capabilities of Alibaba Cloud to enhance the overall security and availability of Grafana.
Managed Service for Grafana supports various Alibaba Cloud data sources, including Application Real-Time Monitoring Service (ARMS), Prometheus, and Simple Log Service. It allows users to deploy on-premises data sources on large disks or use self-managed data sources like Elasticsearch clusters and InfluxDB databases in a Virtual Private Cloud (VPC). Managed Service for Grafana seamlessly integrates with the open-source Grafana.
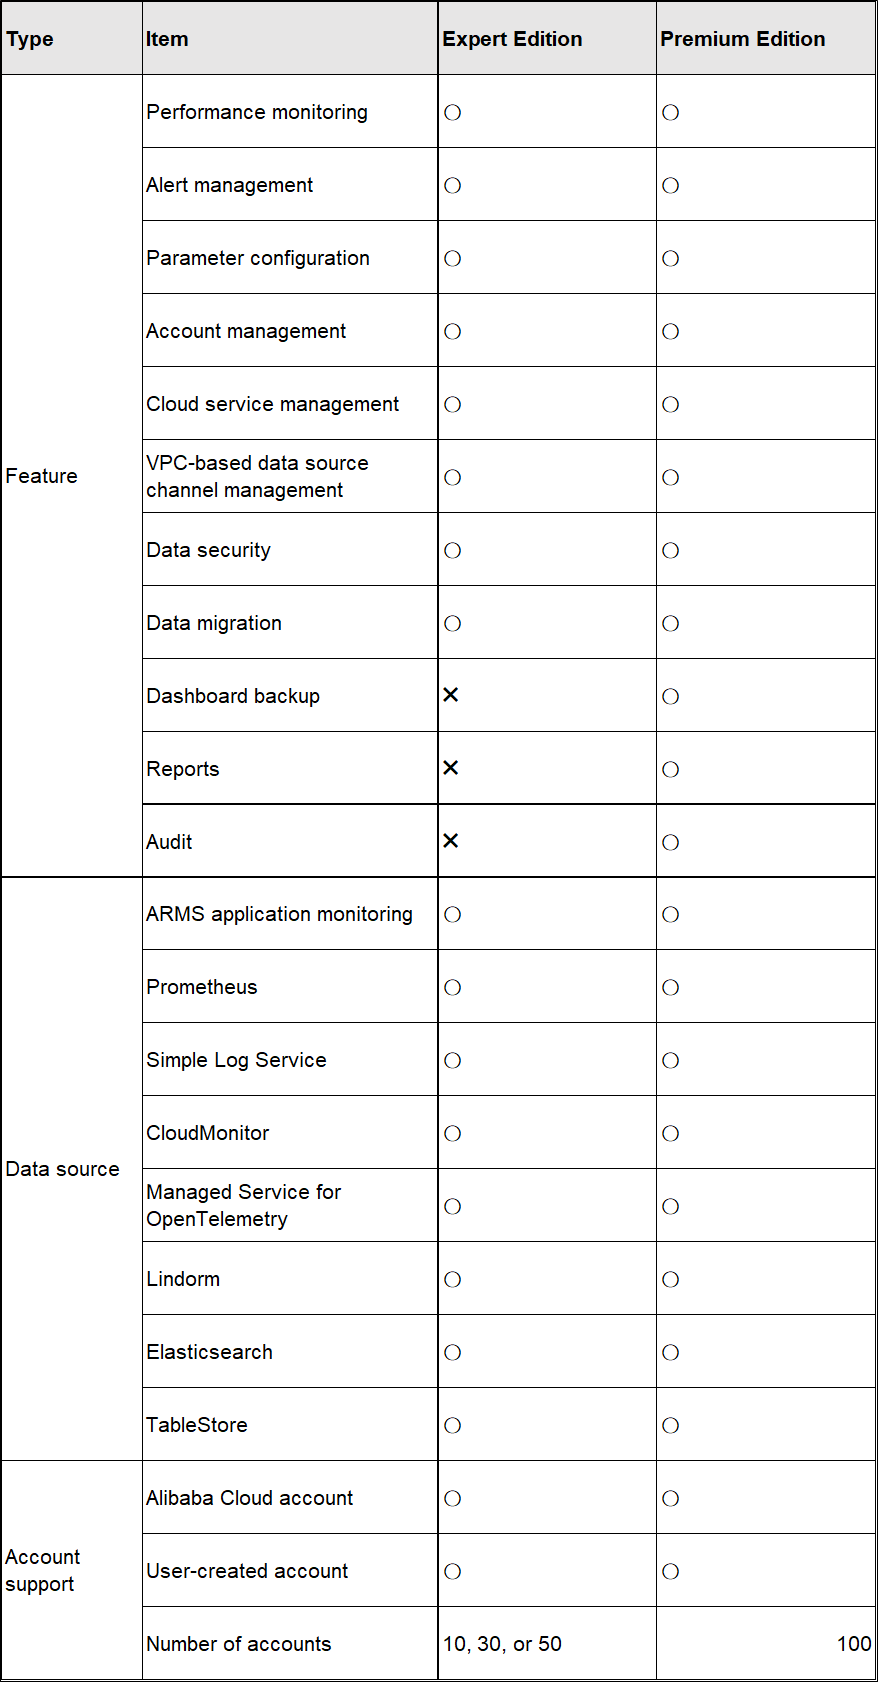
・Integrate with cloud services by default
By default, Managed Service for Grafana integrates with Alibaba Cloud services such as ARMS, Prometheus, CloudMonitor, Simple Log Service, and Elasticsearch. It provides data source settings for each cloud service, pre-configurations for large disks, and the one-click alerting feature.
・Various plug-ins to choose from
Managed Service for Grafana can be connected to your tools by using Grafana plug-ins. The data source plug-in can connect to an existing data source by calling an API operation and display data in real time without the user manually retrieving or migrating the data.
・Customized alert system
You can create, manage, and mute all Grafana alerts in one simple UI. All alerts can be easily integrated and centrally managed.
・Multi-dimensional data query
Cross-data source query, and the renaming, aggregating, joining, and computing of data sources are supported.
・Build your own data source
Managed Service for Grafana allows you to bridge multiple VPCs in the same region, add data sources in multiple VPCs to the same workspace and display queries and alerts in a unified manner.
・Panel editor
With a consistent UI for configuring data options in all visual panels, you can easily configure, customize, and navigate all panels.
Managed Service for Grafana supports one-click integration and synchronization of data sources from Alibaba Cloud services and their corresponding dashboards. You can conveniently check and manage cloud service integration on the workspace's information page. In this section, we will explore the integration of Simple Log Service, MySQL, and Grafana services.
Create a Grafana workspace.
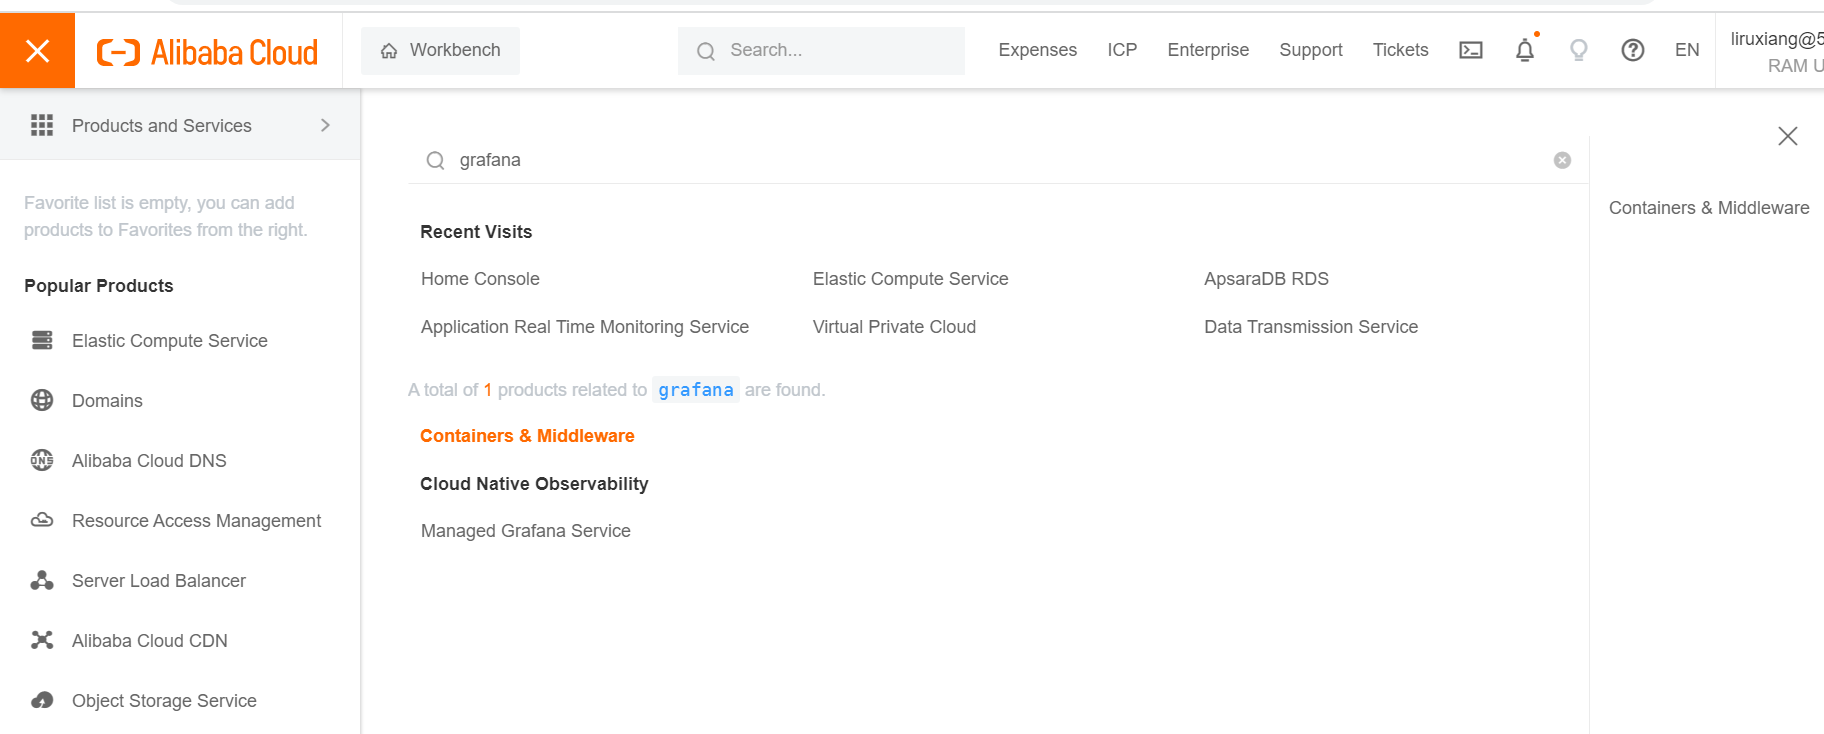

Click Create Workspace to go to the Create Workspace page.
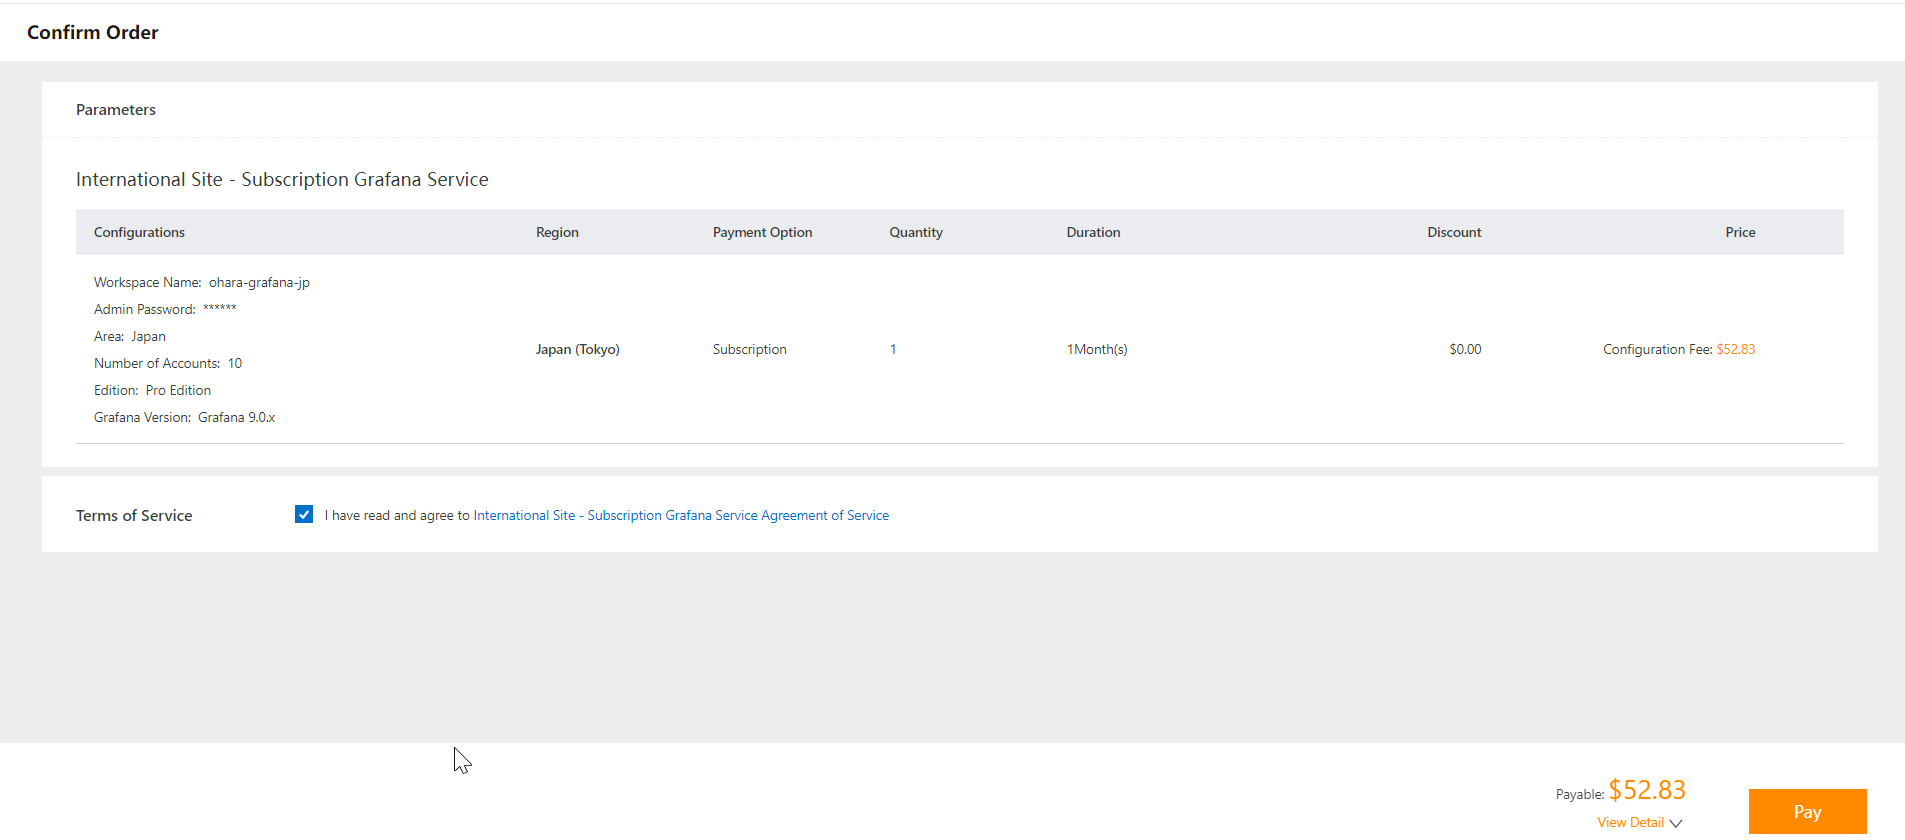
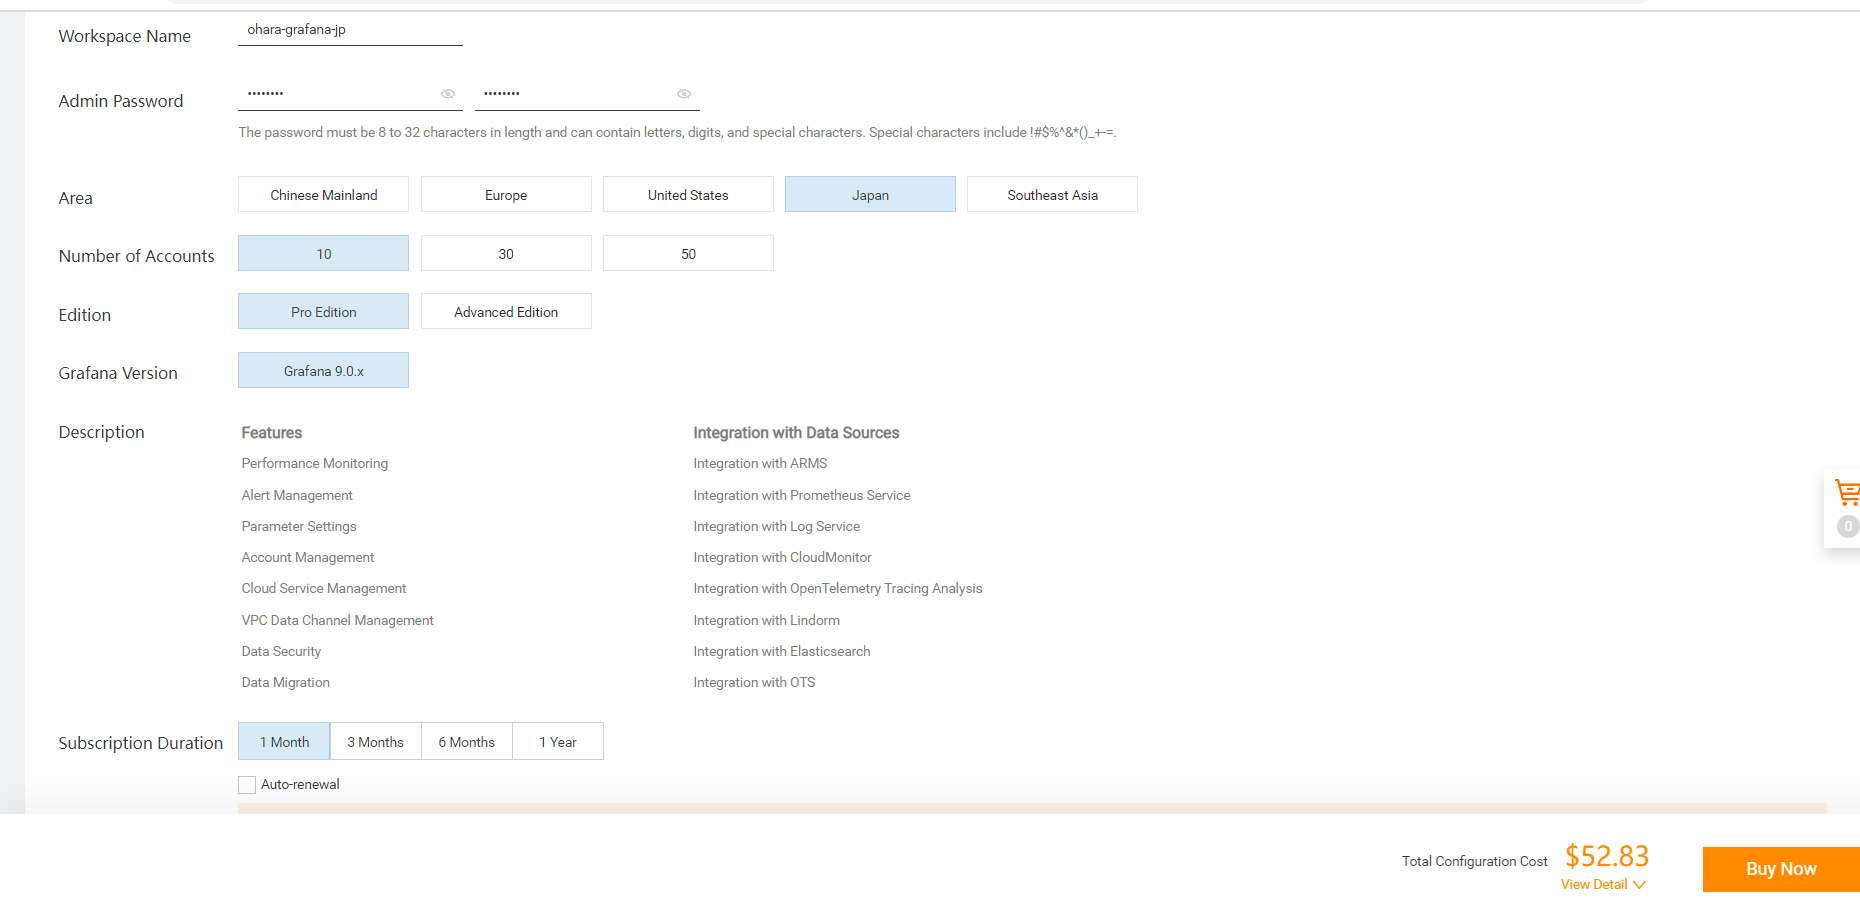


A workspace instance of Grafana has been created.
Grant the Grafana-related permissions to your account.
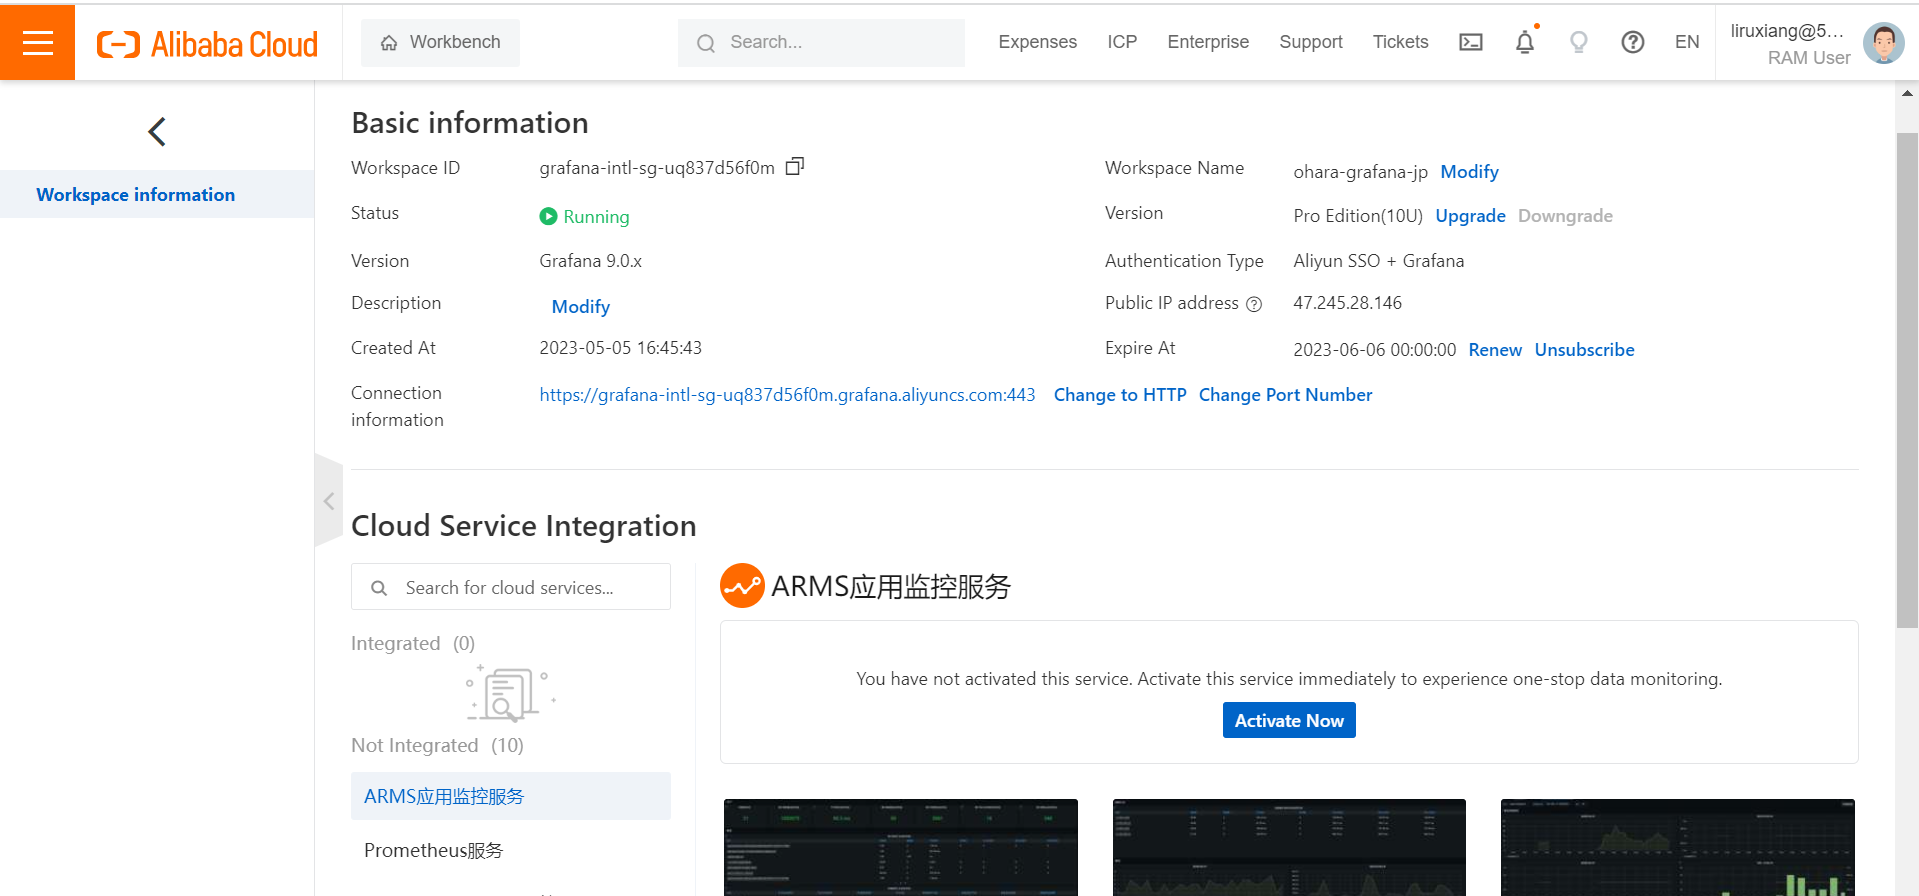
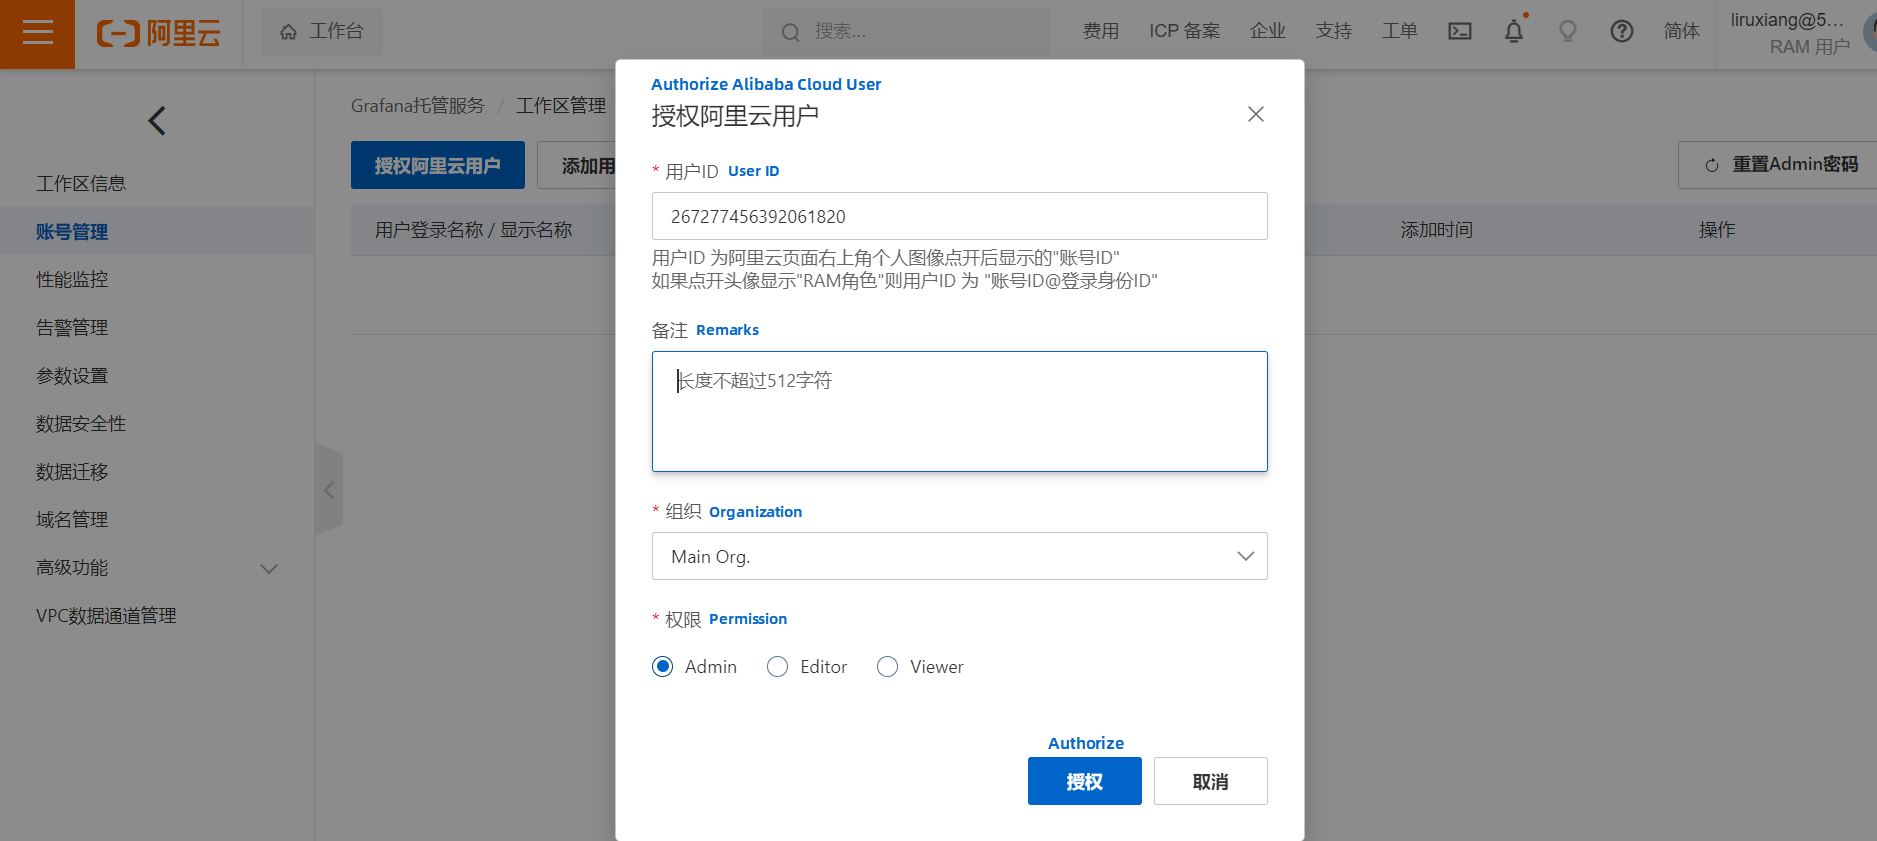

Log on to Grafana.
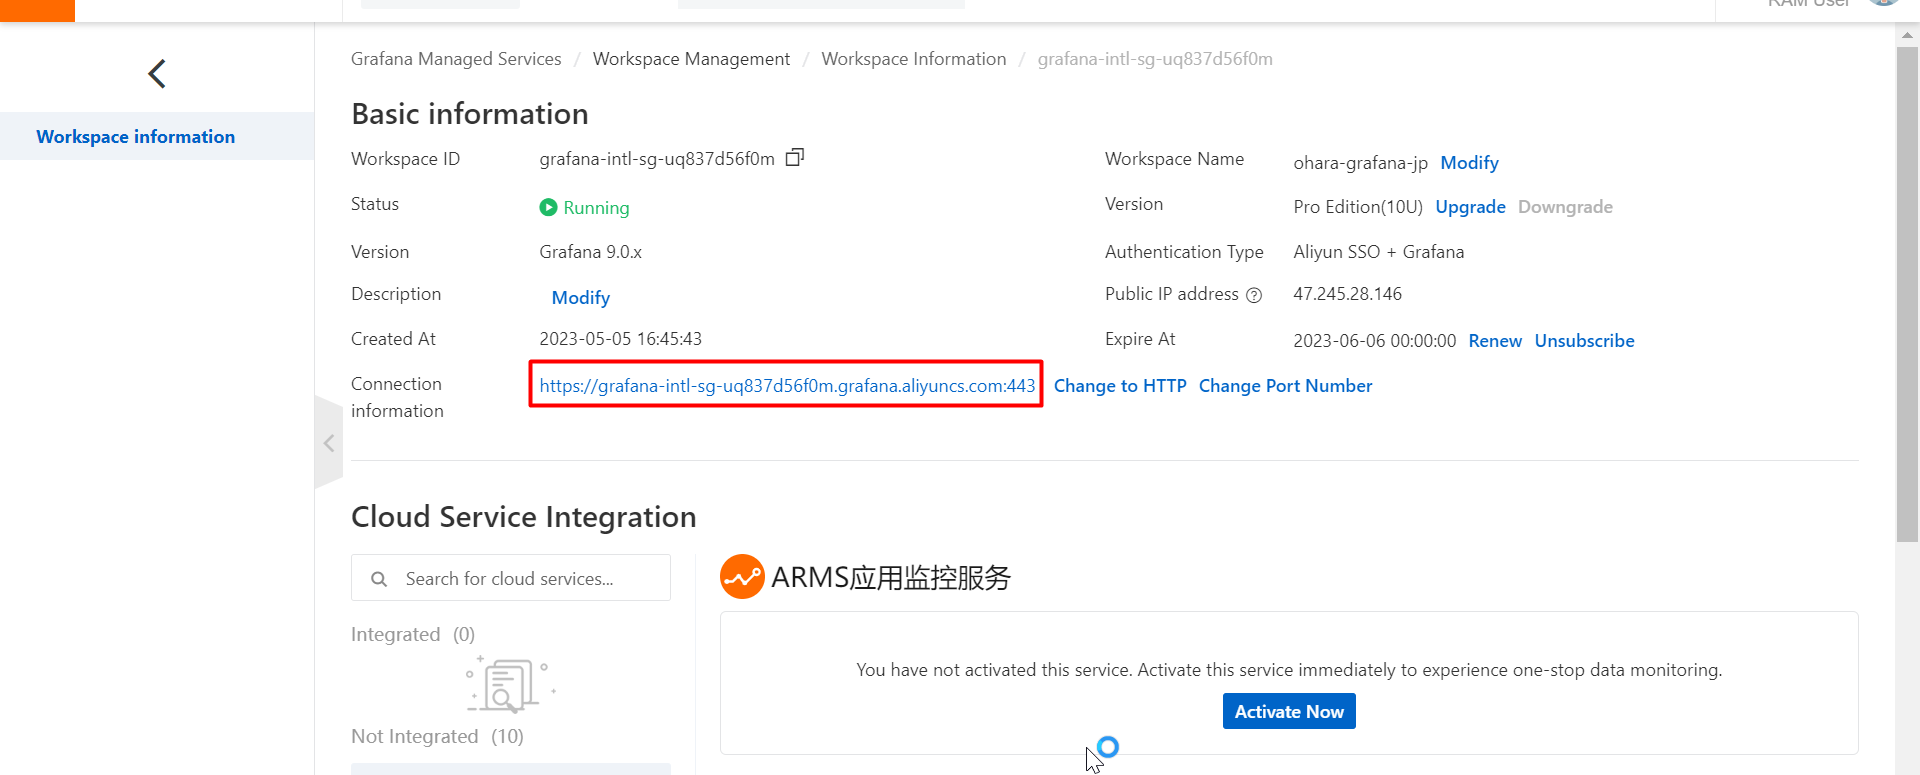
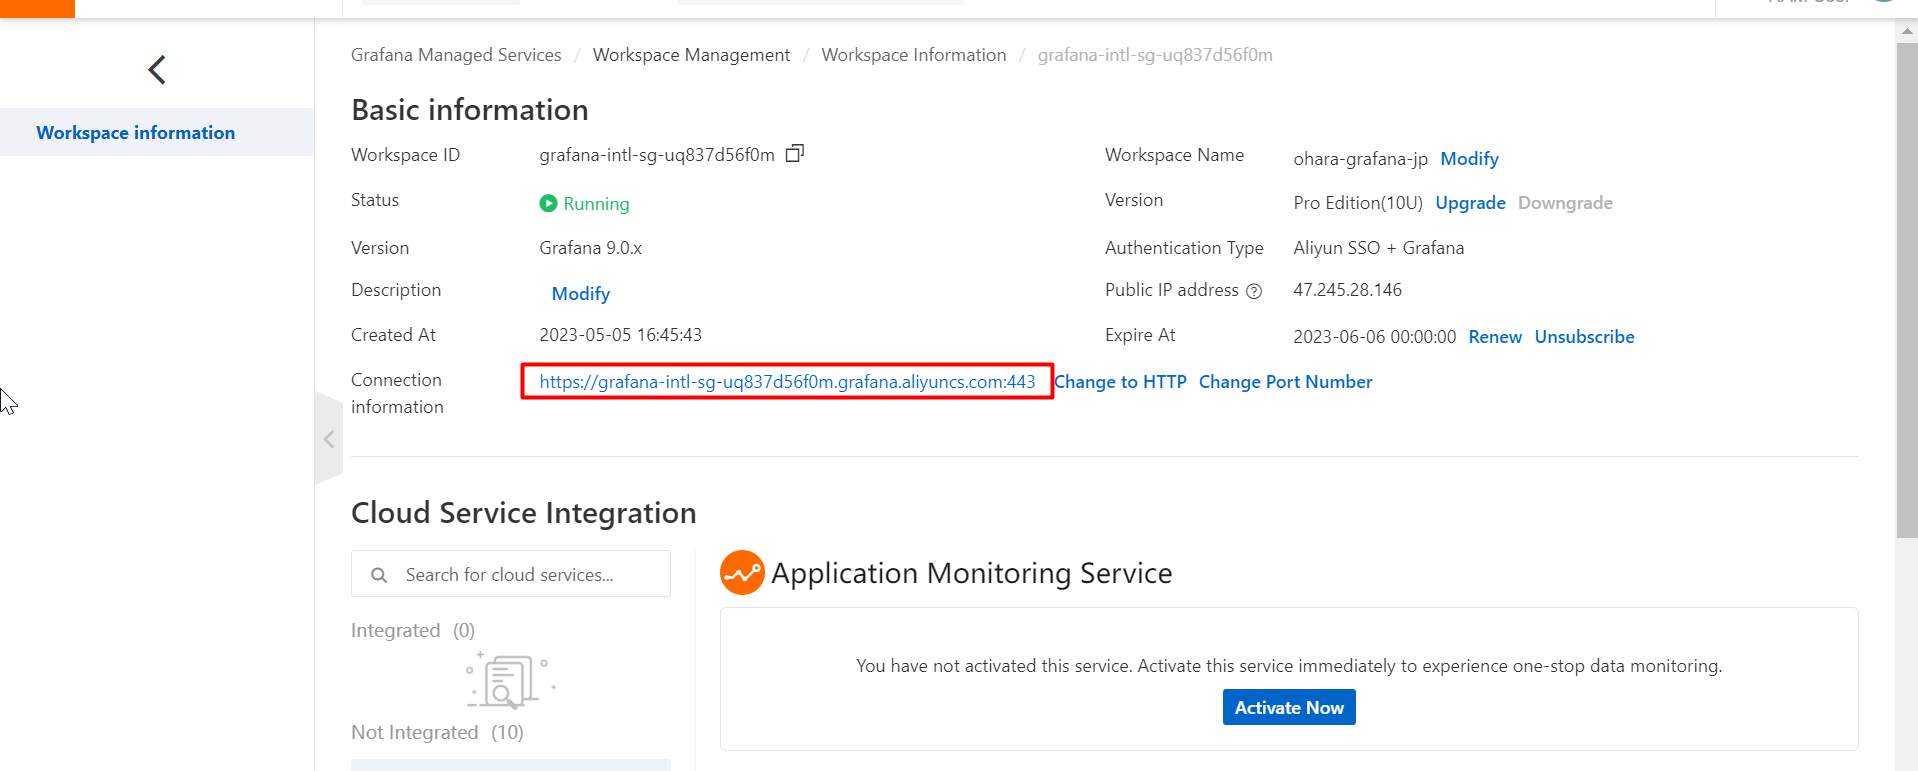
(1) Click the following URL to go to the Grafana logon page.
https://grafana-intl-sg-uq837d56f0m.grafana.aliyuncs.com:443
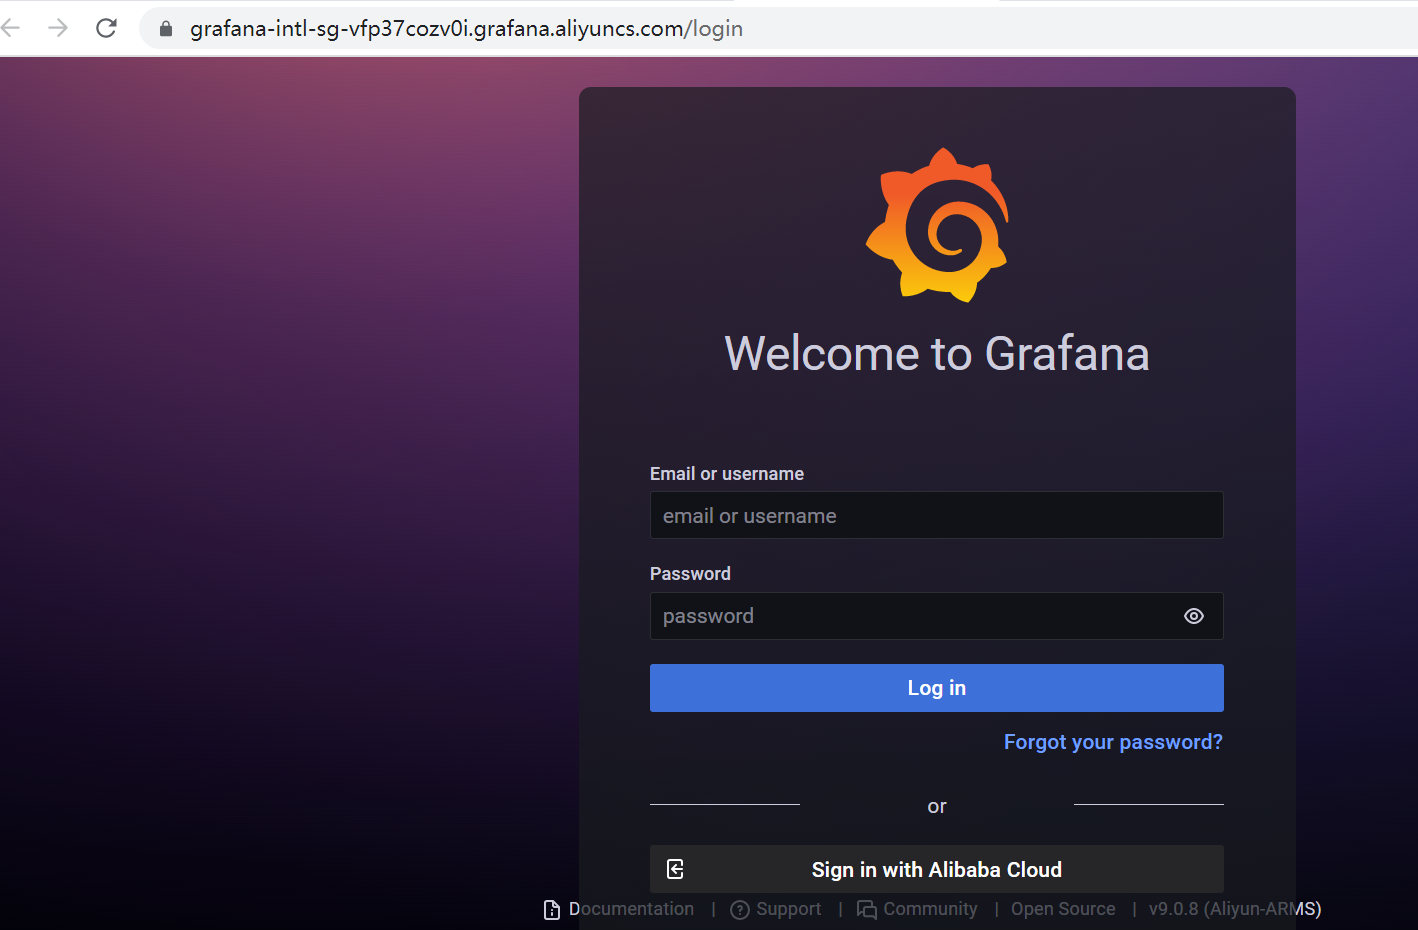
(2) Log on to Grafana by using your Alibaba Cloud account.
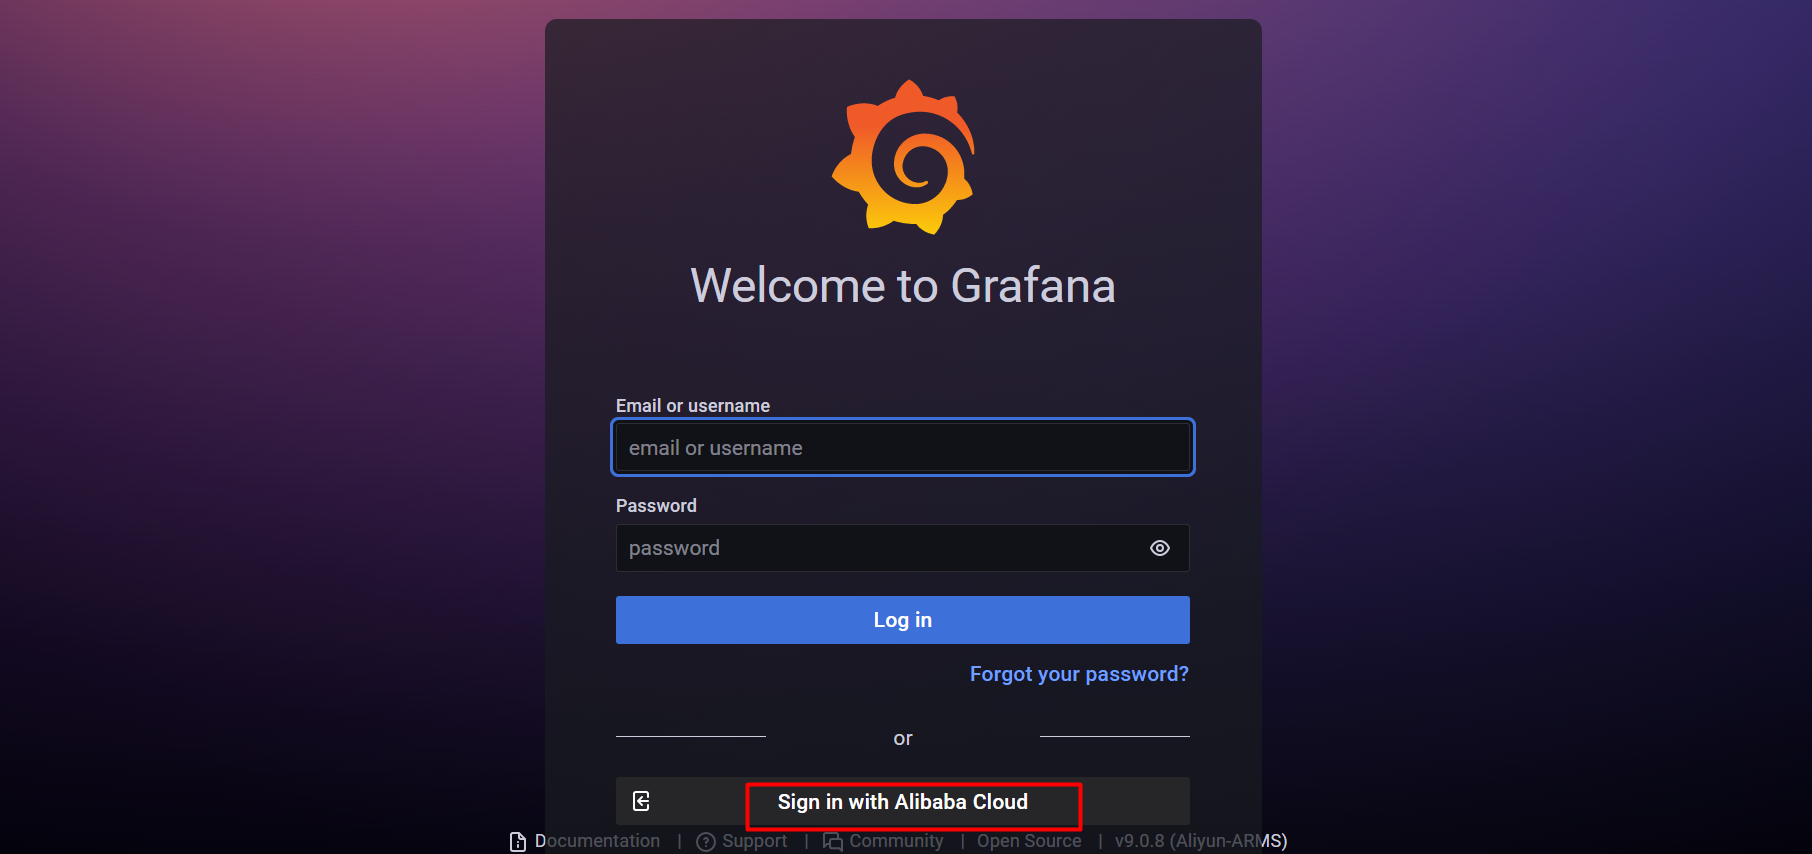
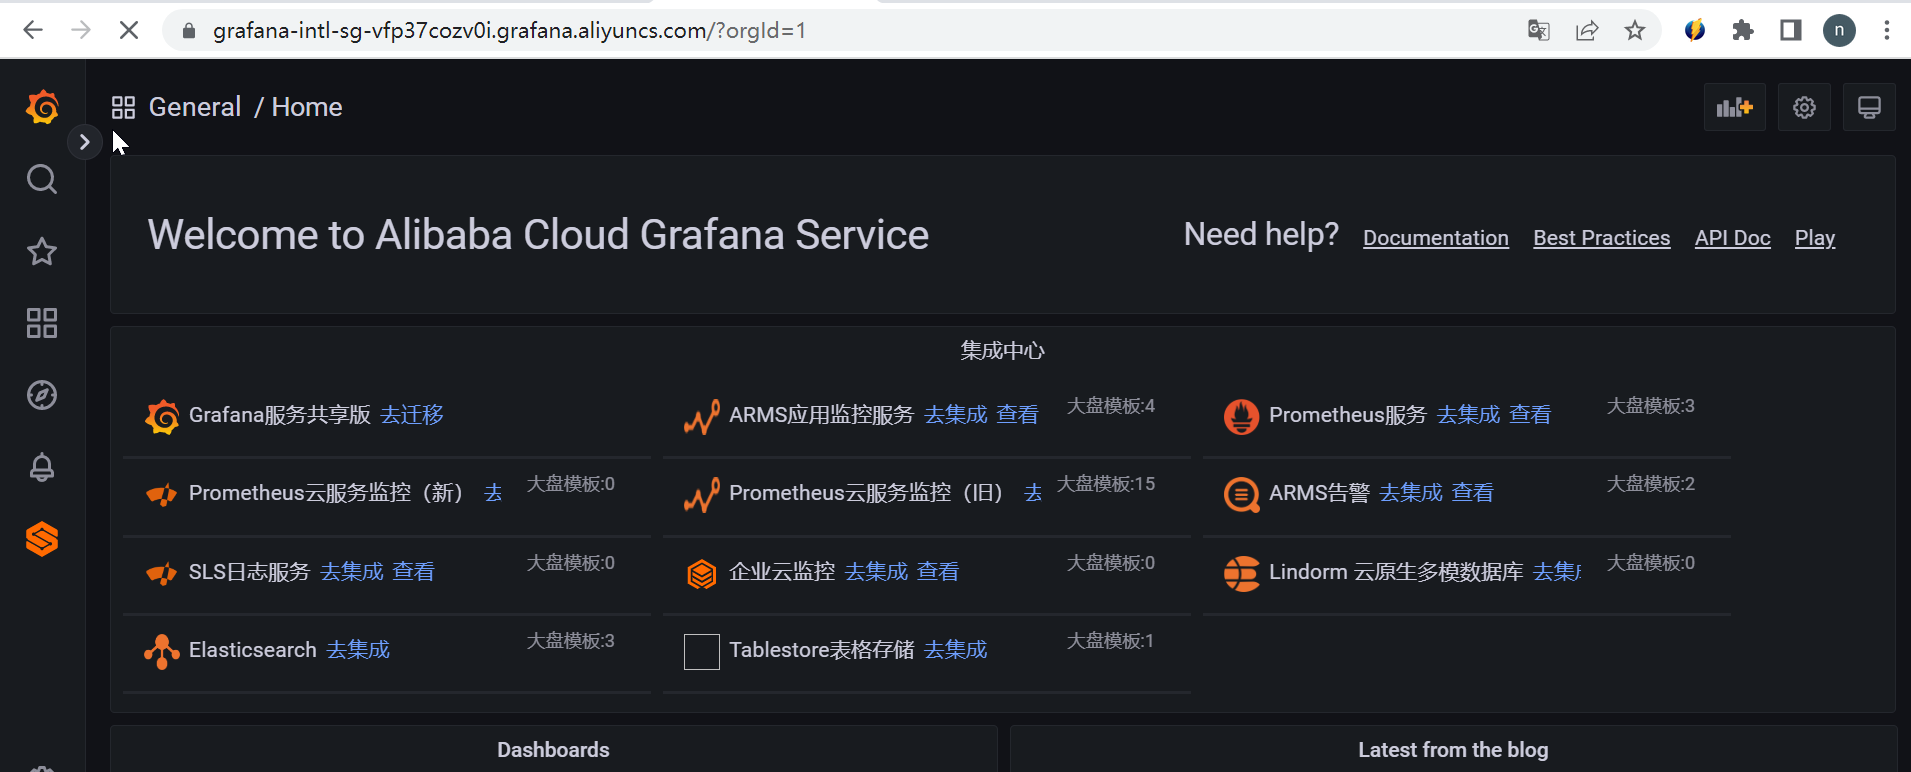
The Grafana service for ARMS has the data source plug-in of Simple Log Service installed by default. This plug-in allows you to synchronize data from Simple Log Service and display data in real time in the Grafana dashboard. You do not need to manually retrieve or migrate data.
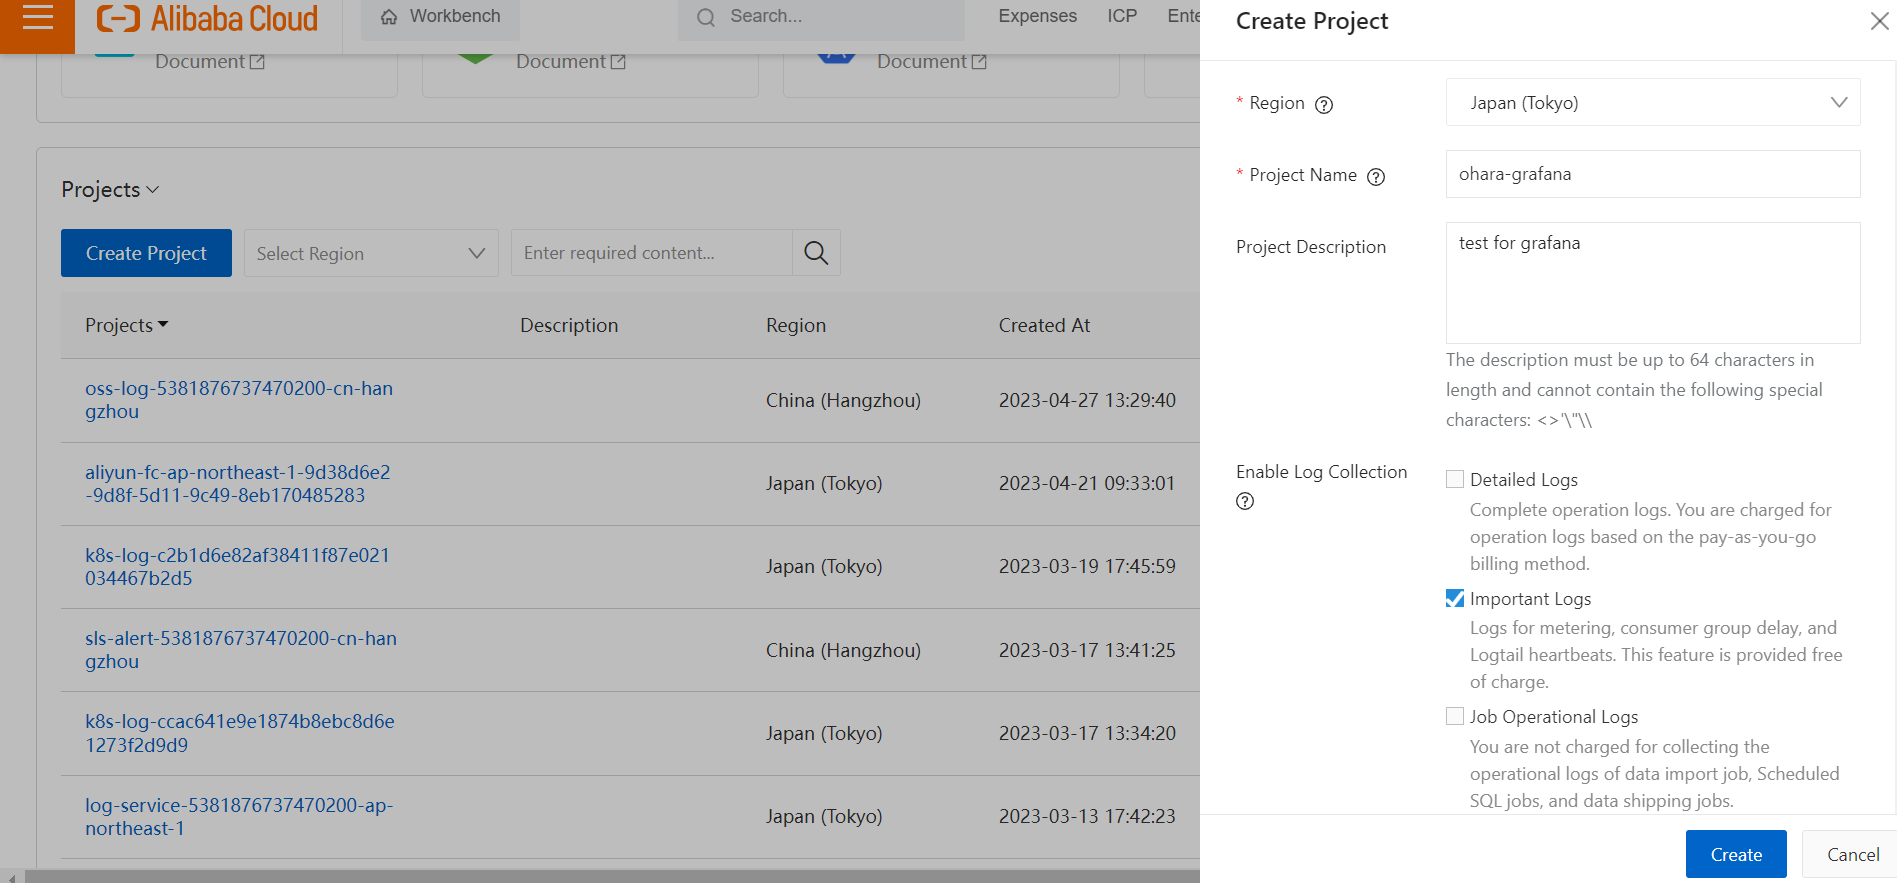
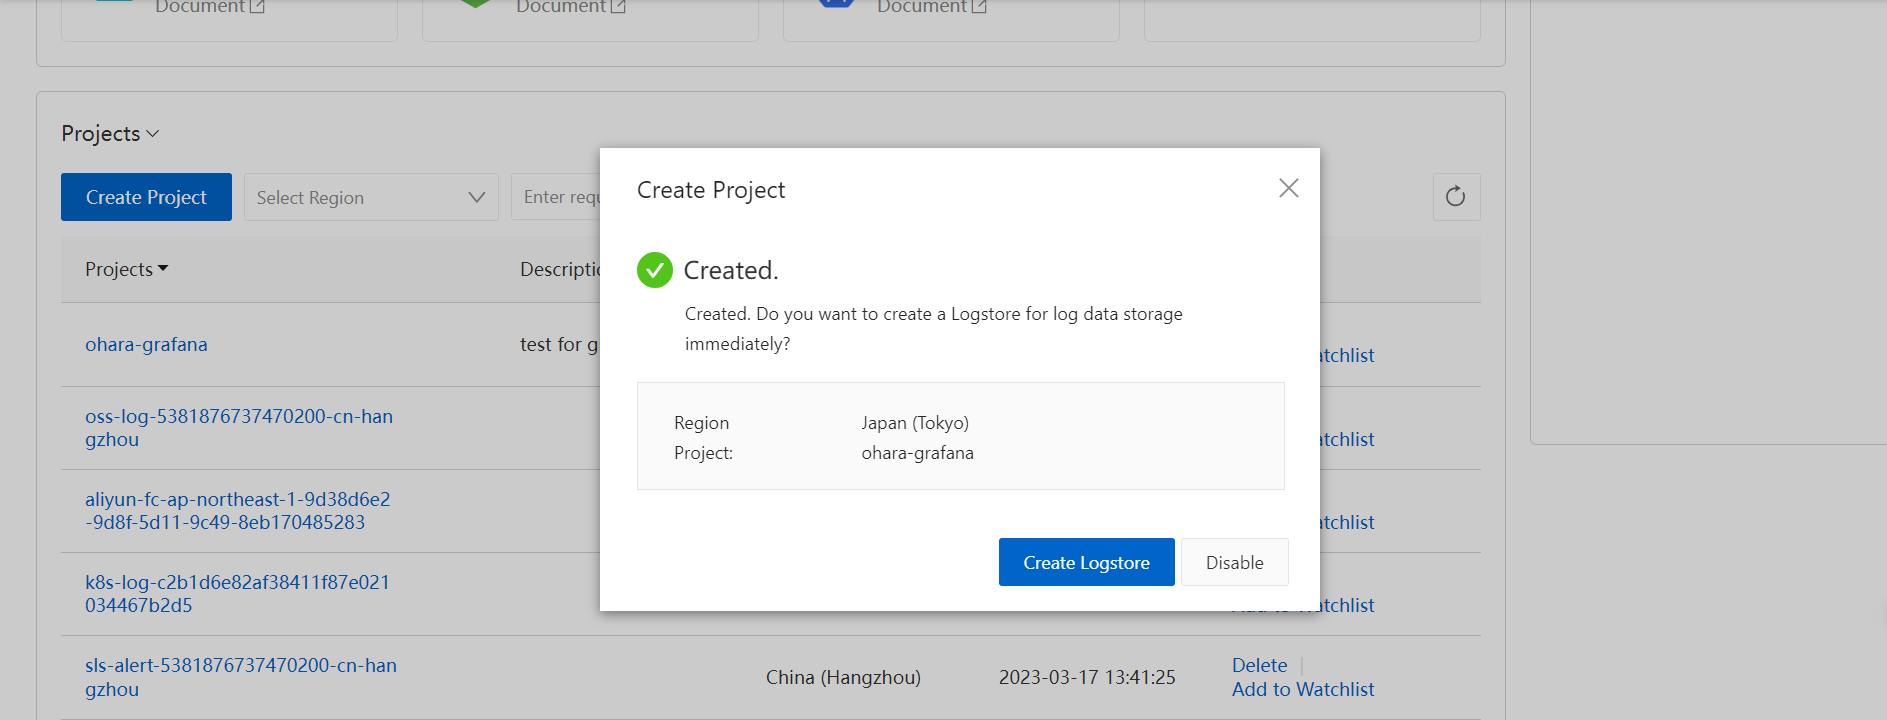
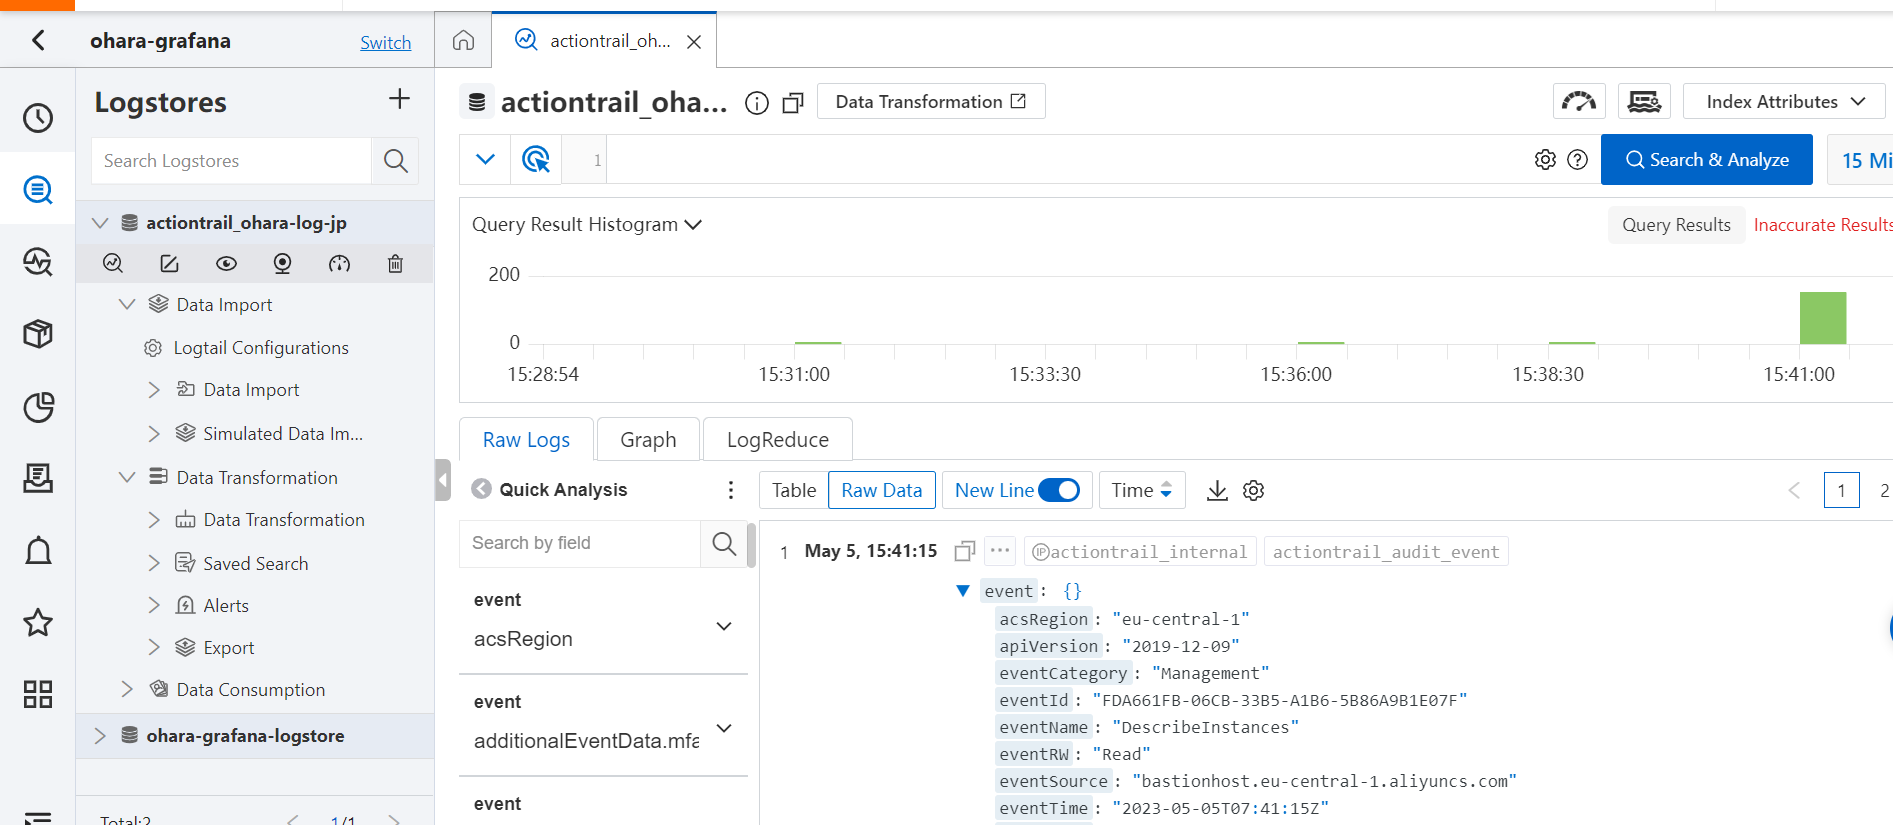
(1) Forward ActionTrail logs to Simple Log Service.
Create a trail in ActionTrail
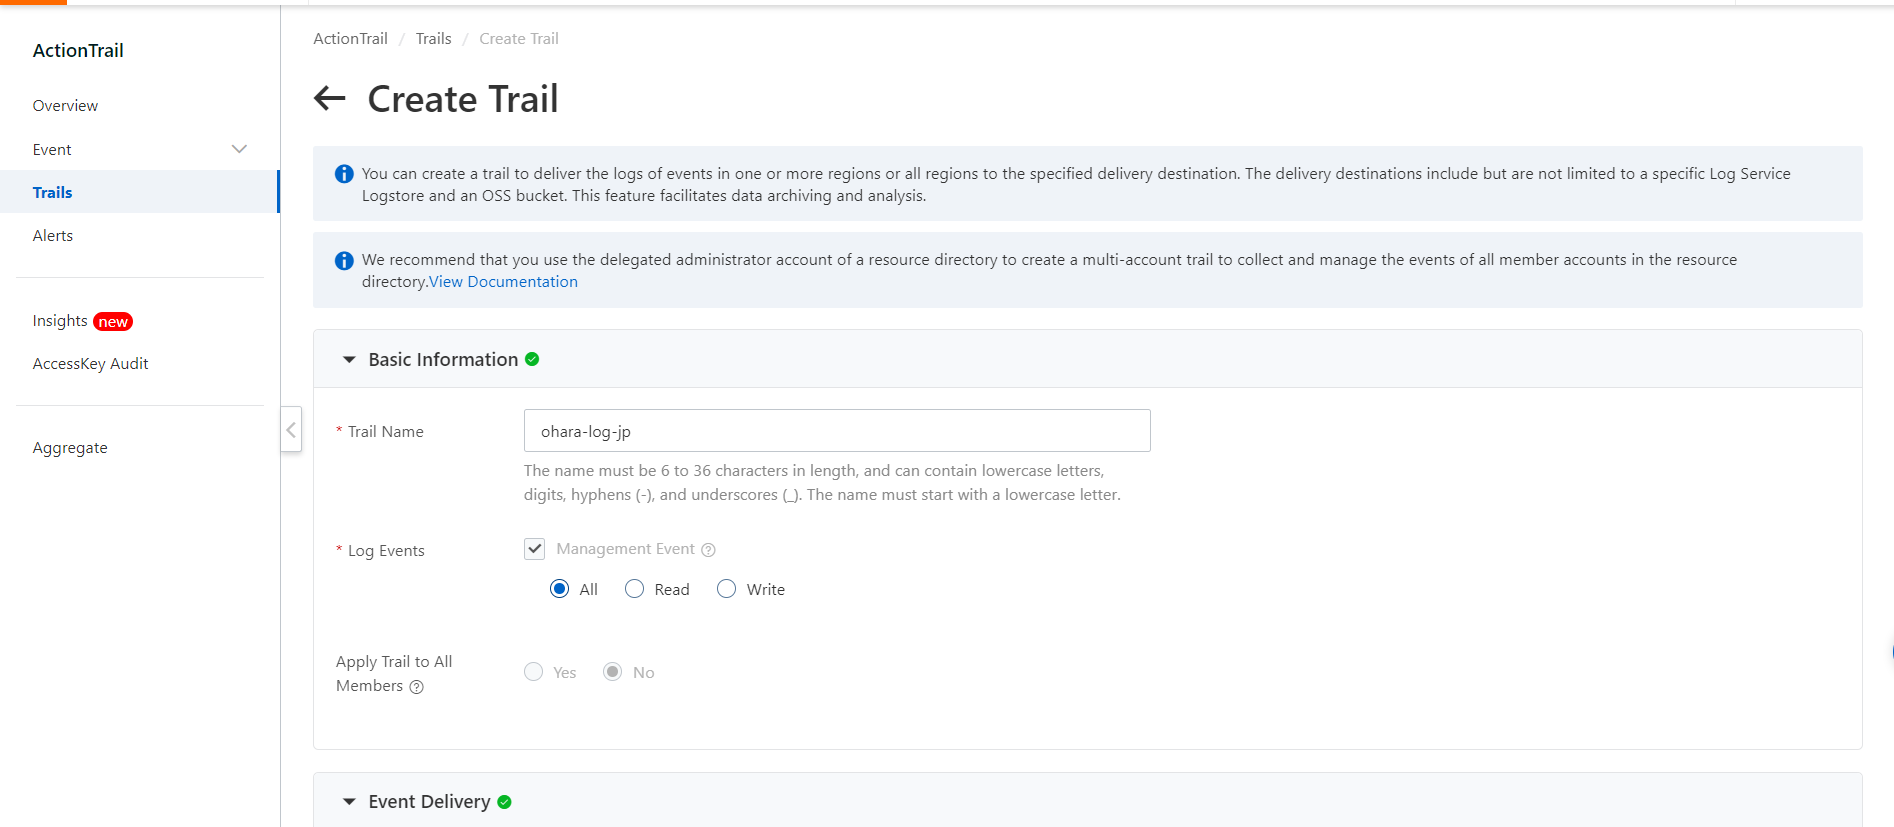
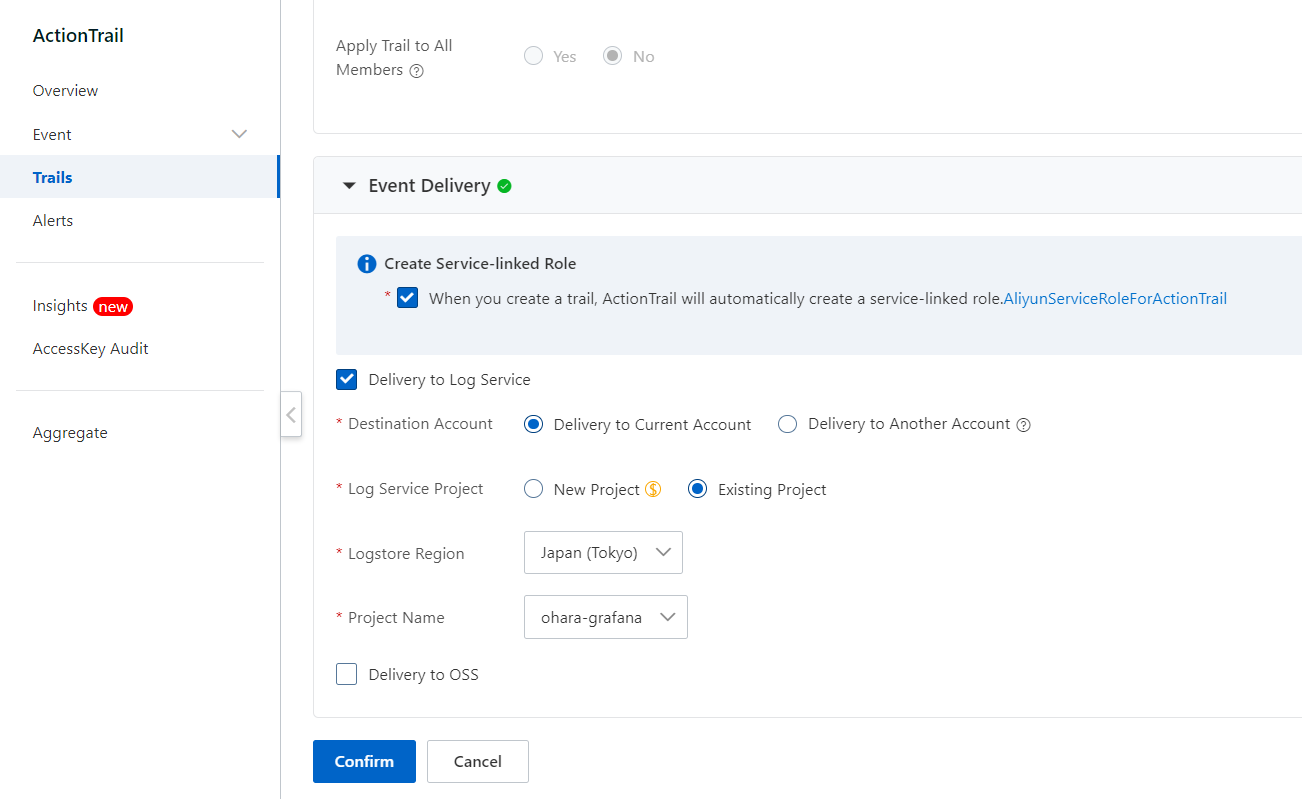

(2) Check the ActionTrail logs in Simple Log Service.
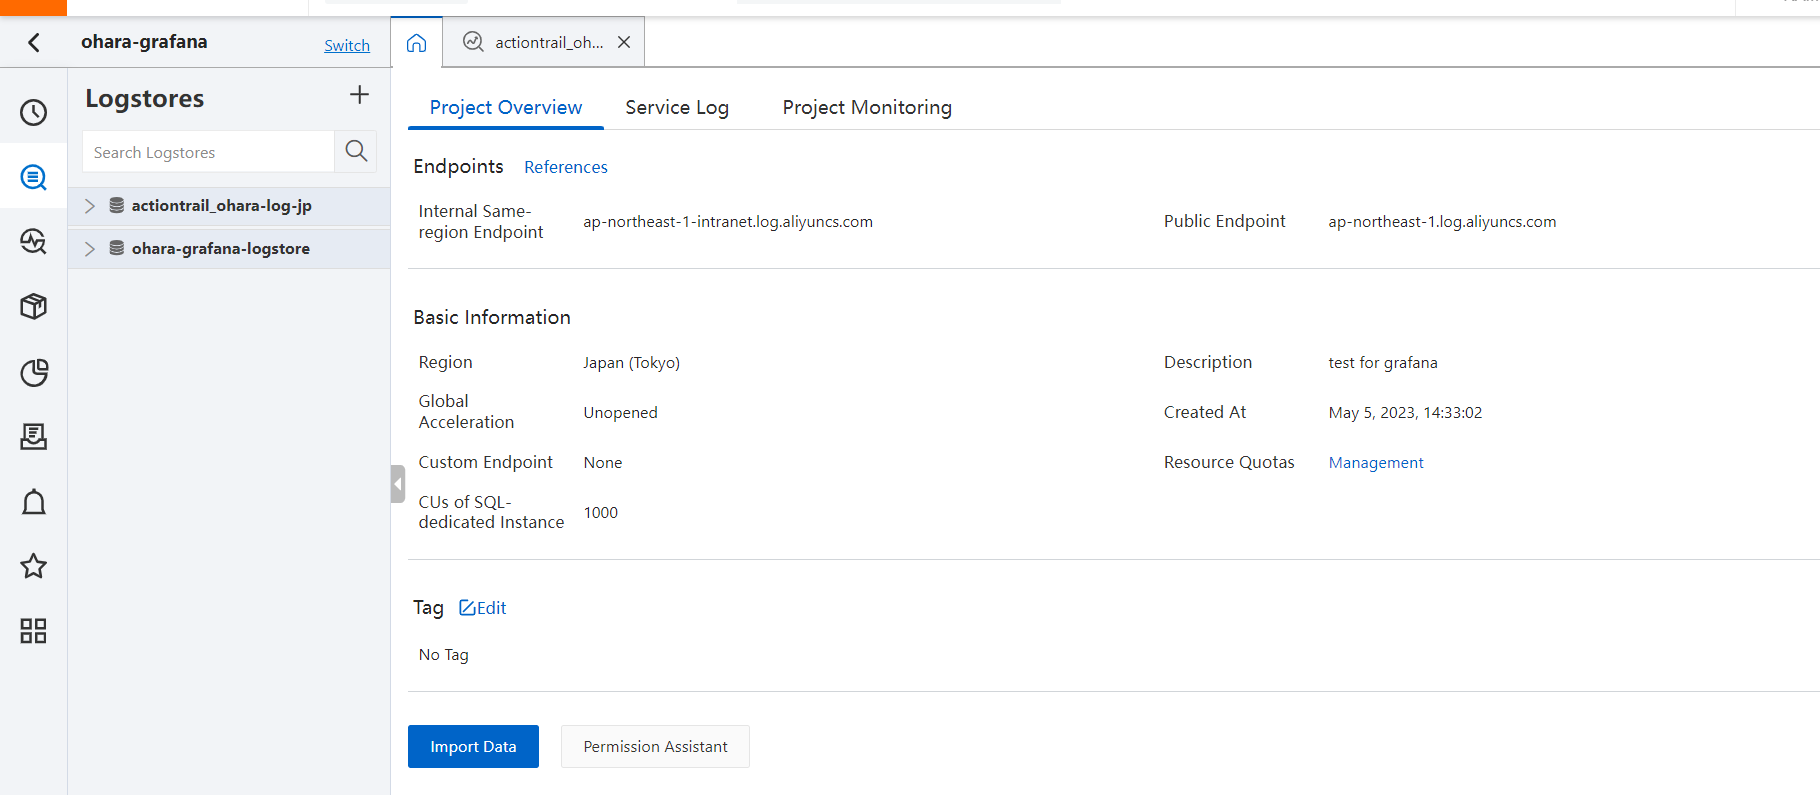
(1) Obtain the endpoint of a Logstore in advance.
Endpoint: ap-northeast-1.log.aliyuncs.com
(2) Click the access URL from the Grafana instance details page to log on to Grafana.

Click the following URL to go to the Grafana logon page.
https://grafana-intl-sg-uq837d56f0m.grafana.aliyuncs.com:443
(3) Go to the Data Sources page to add a data source by clicking the configuration icon on the Grafana homepage.
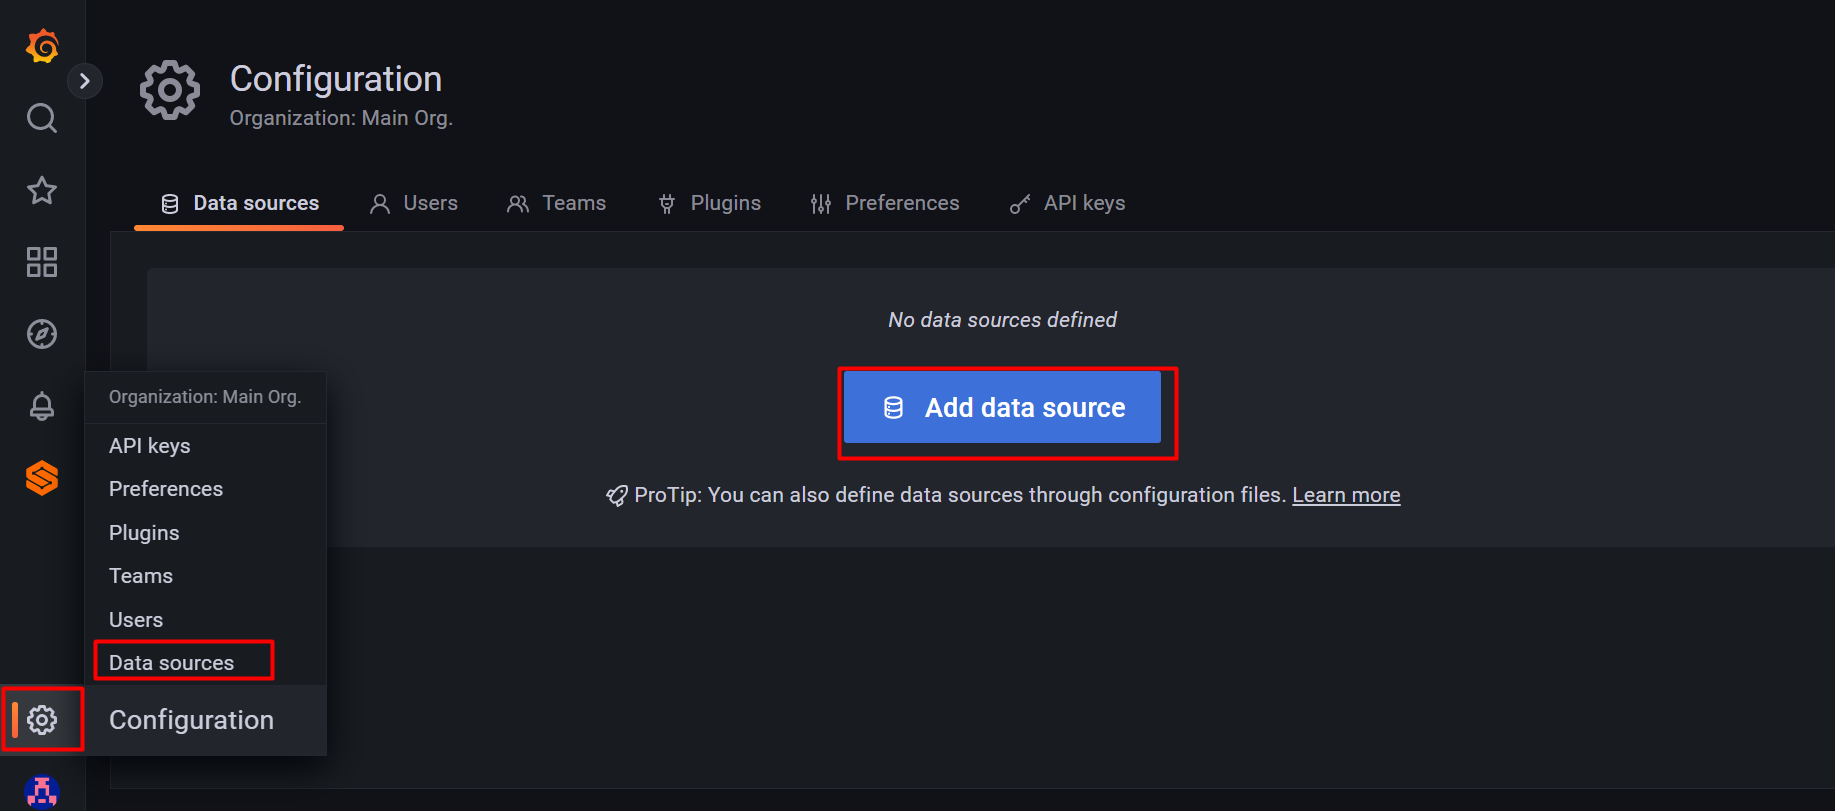
(4) Add the log-service-datasource data source.
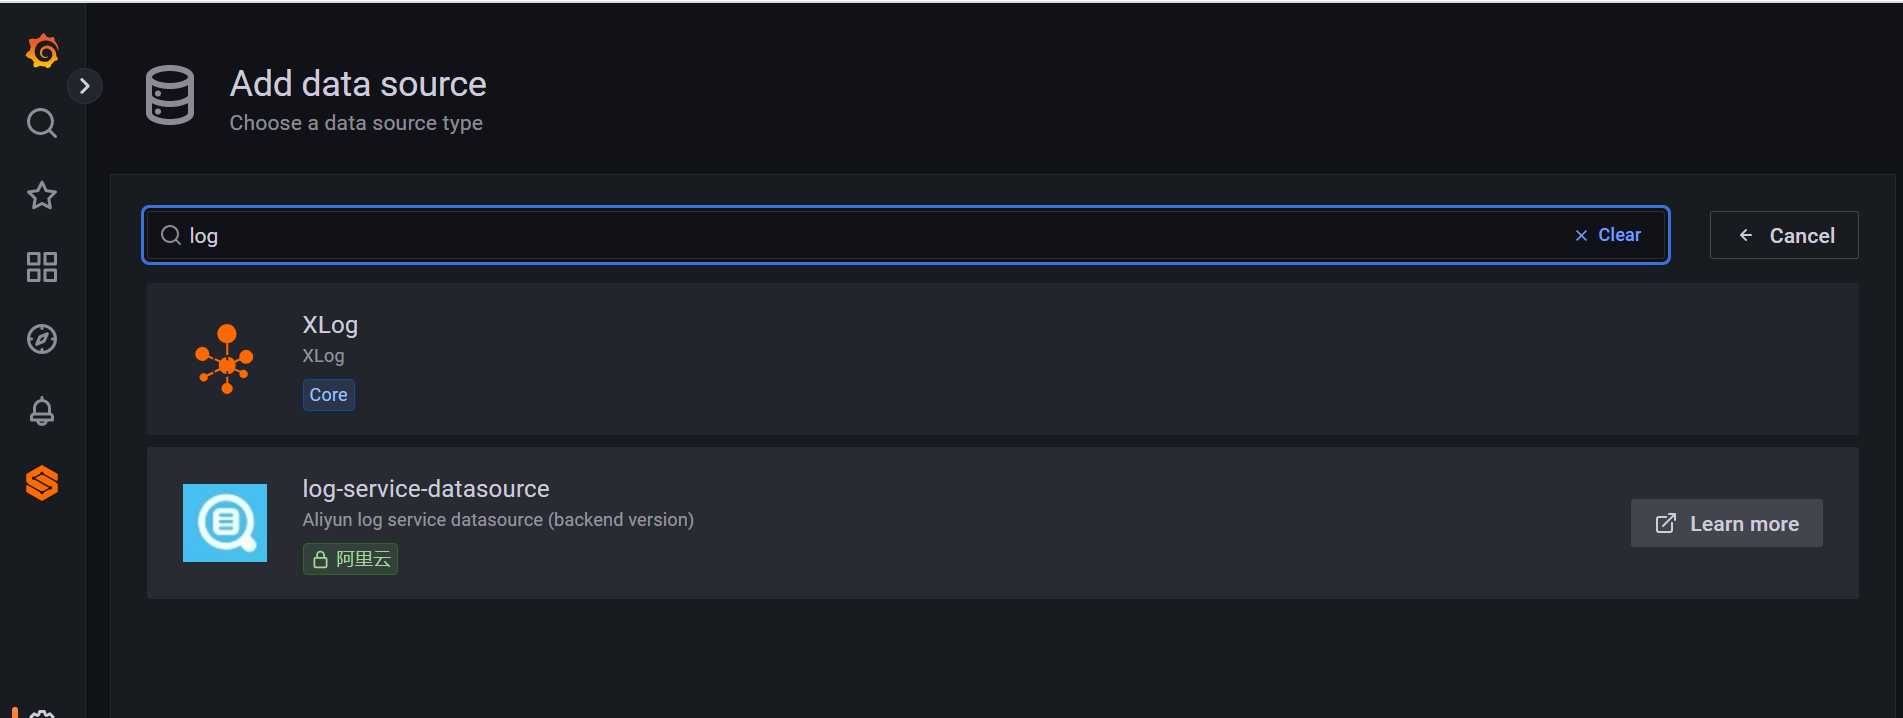
(5) Configure the data source.
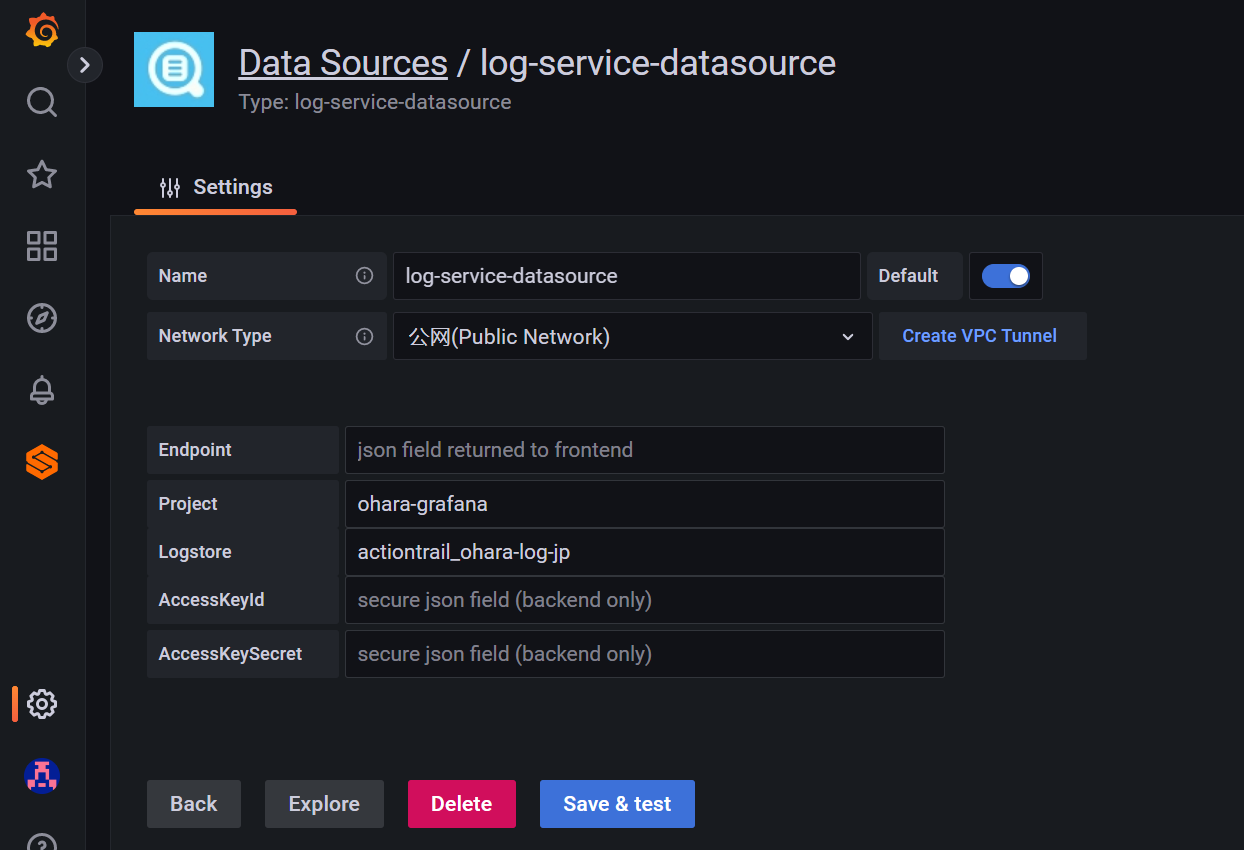
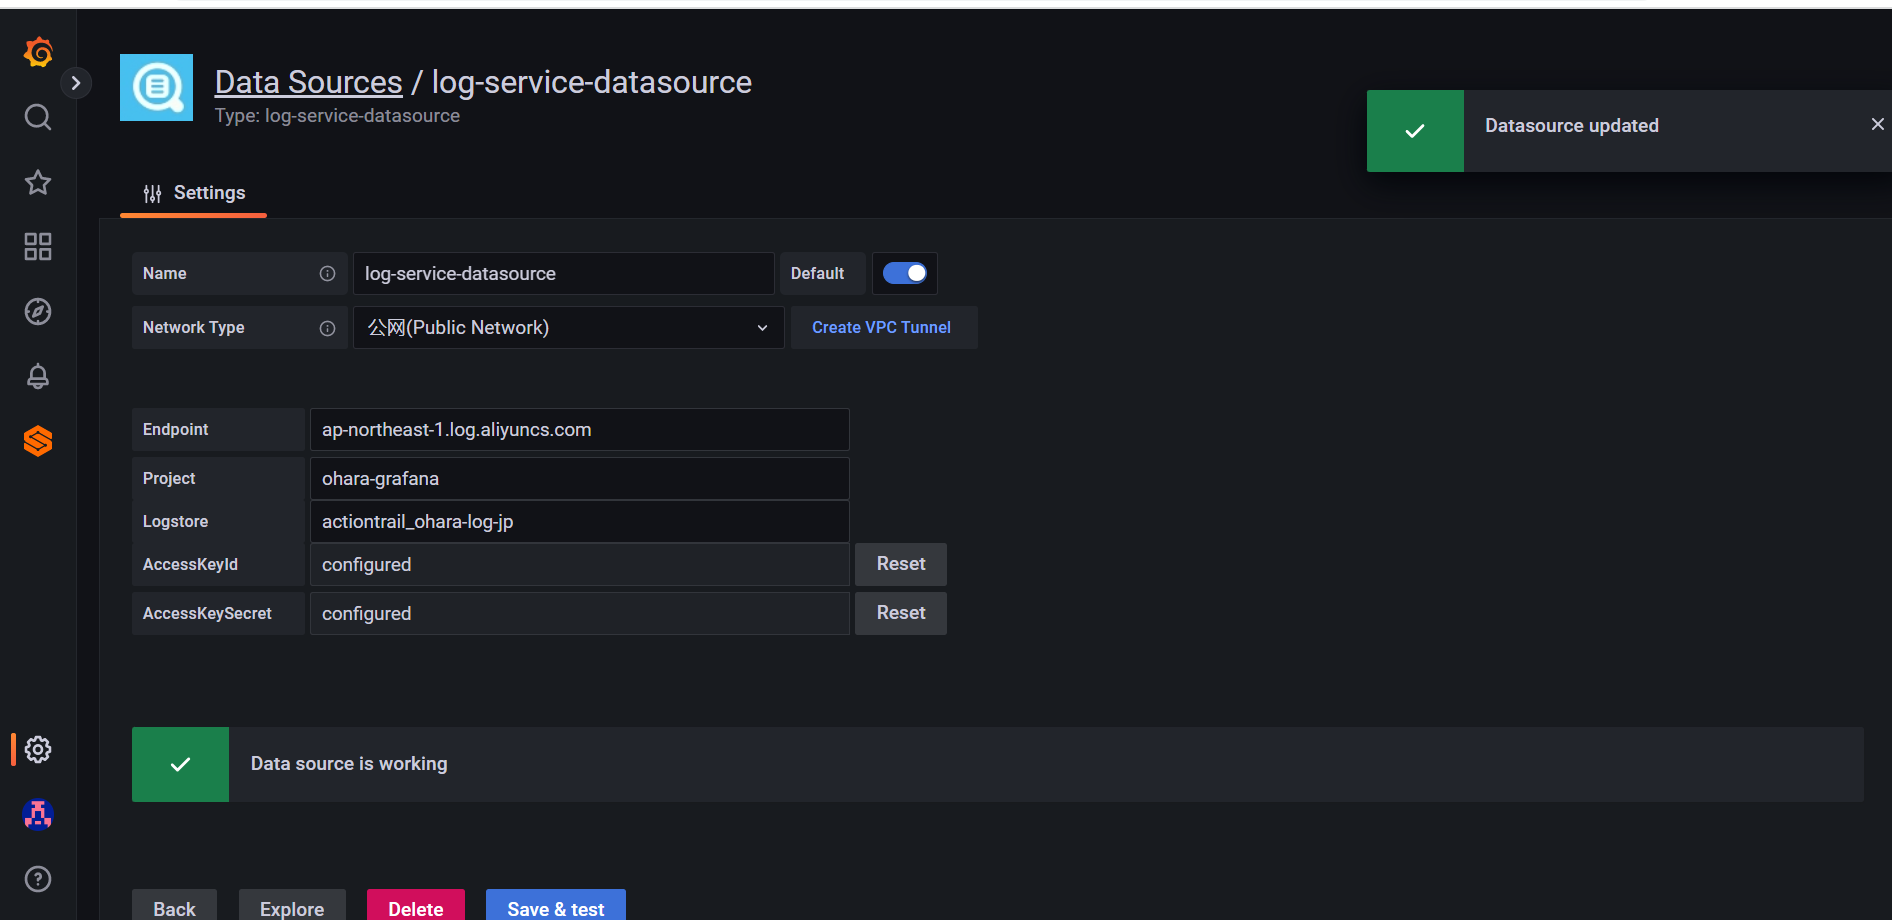
(6) After configuring the data source, save and test the data source.
(1) From the Explore menu, go to the Explore page of the Simple Log Service data source.

(2) Click Run query
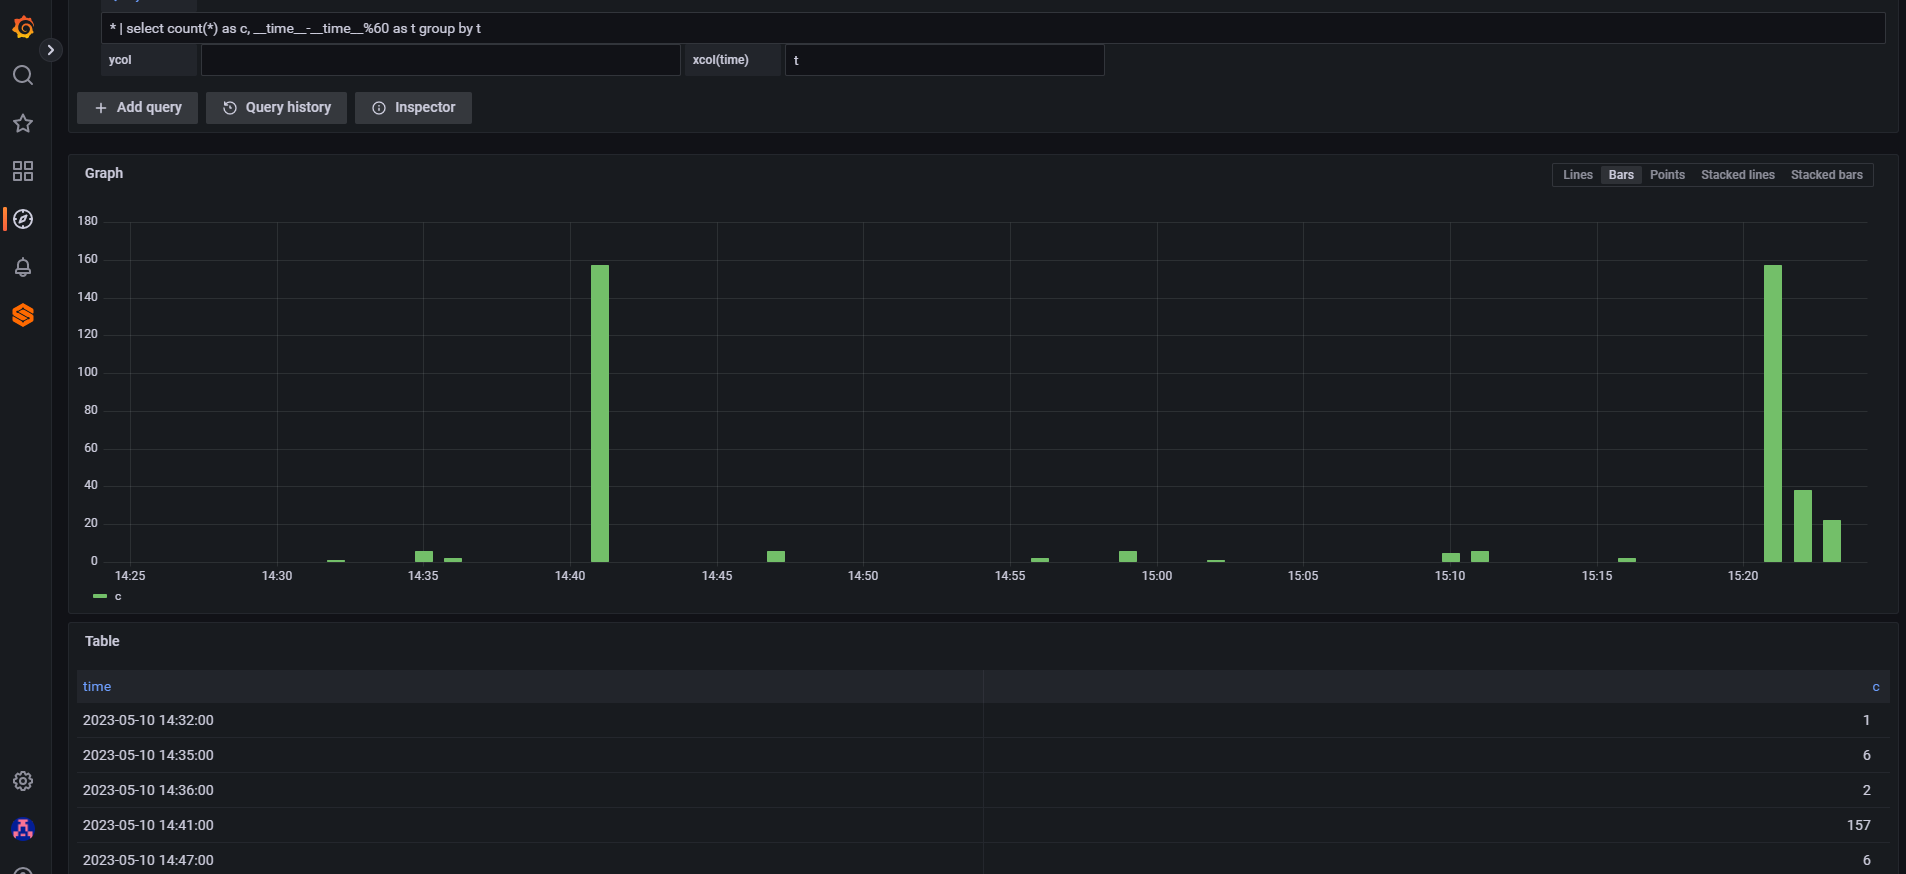
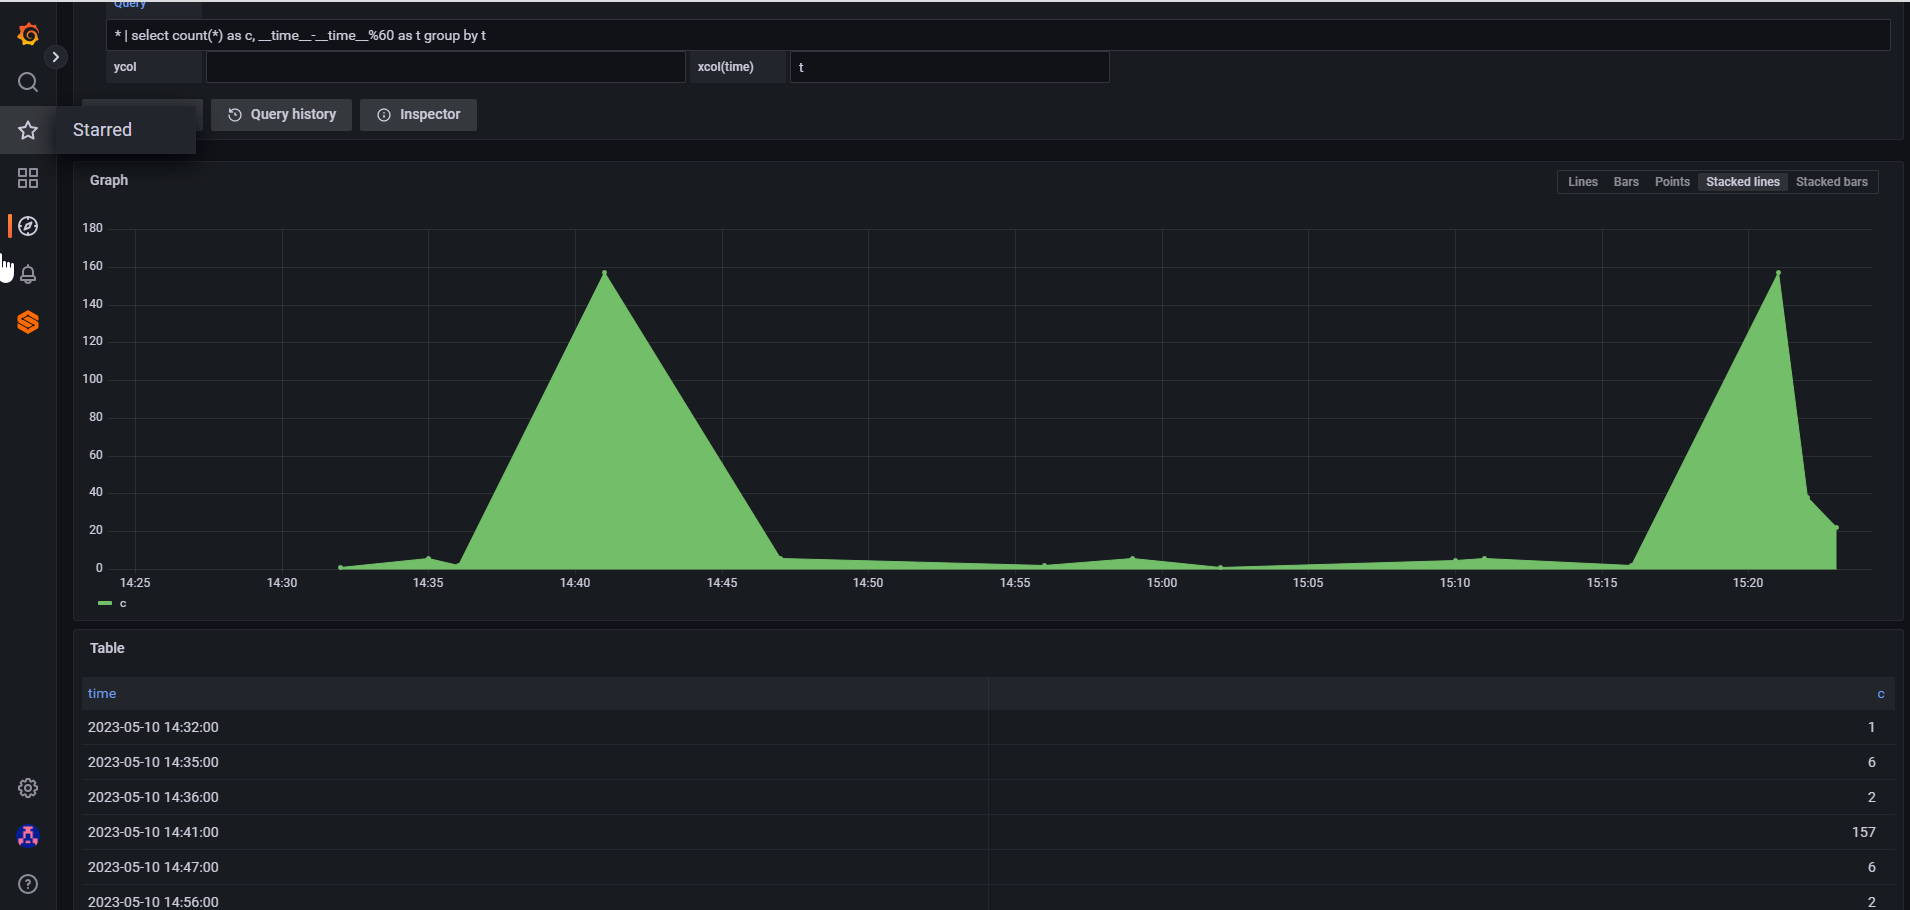
* | select count(*) as c, __time__-__time__%60 as t group by t
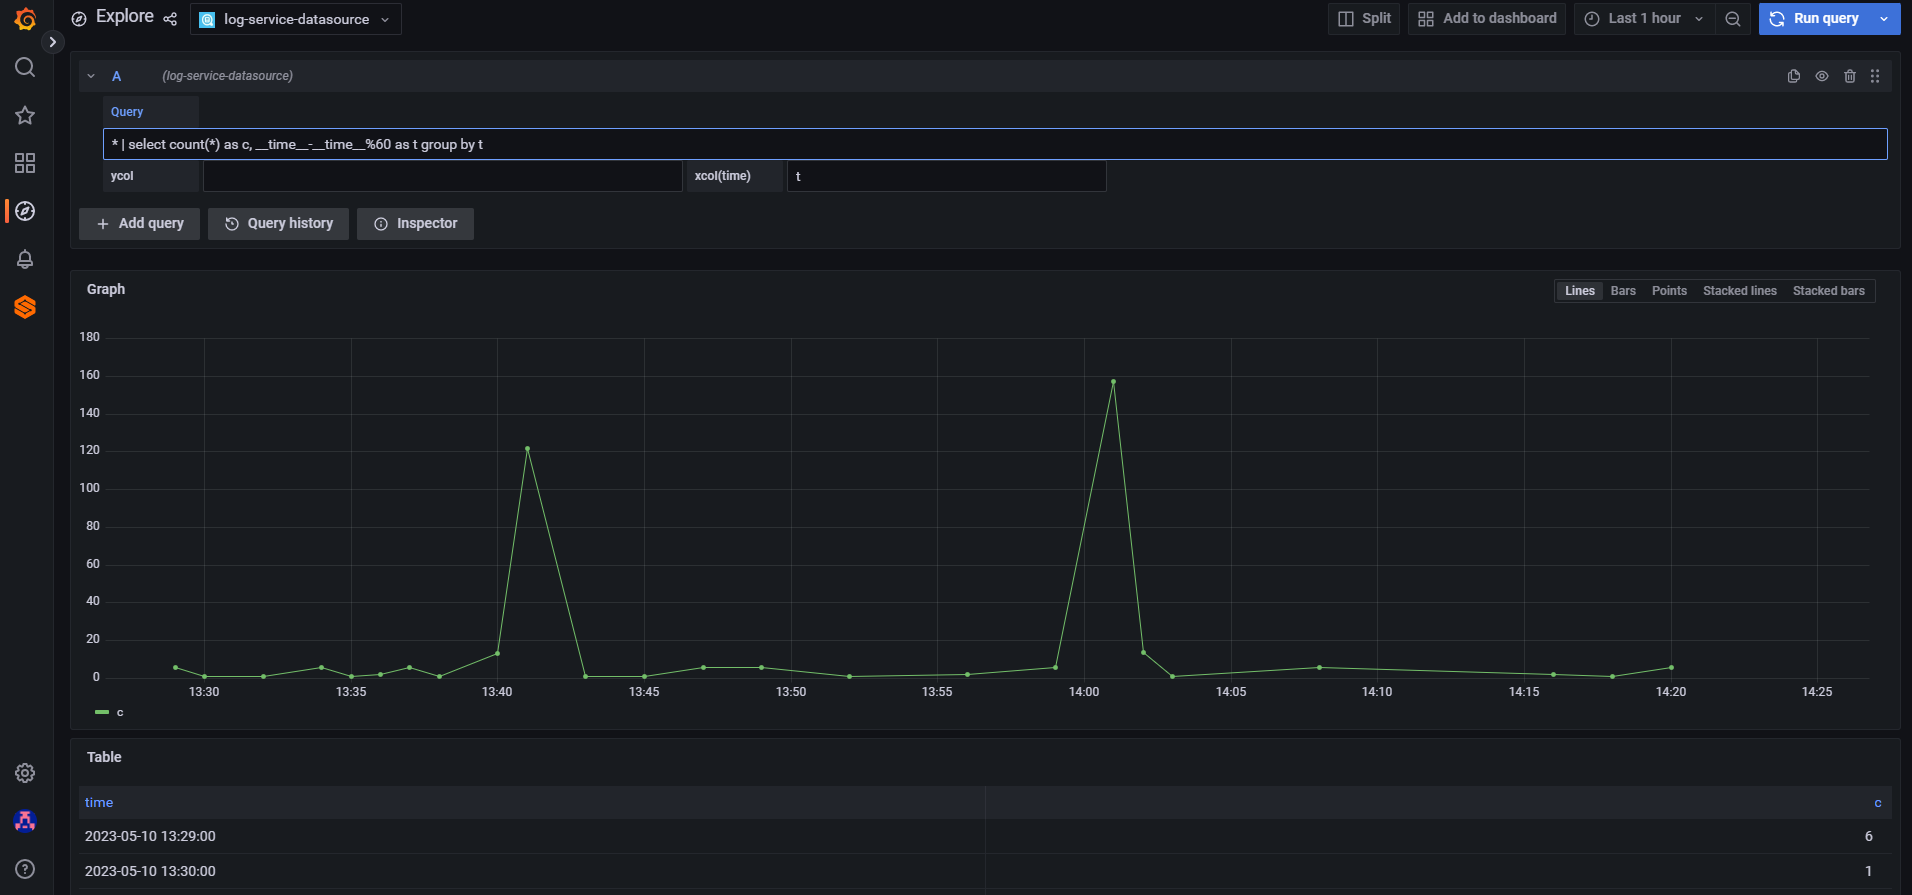
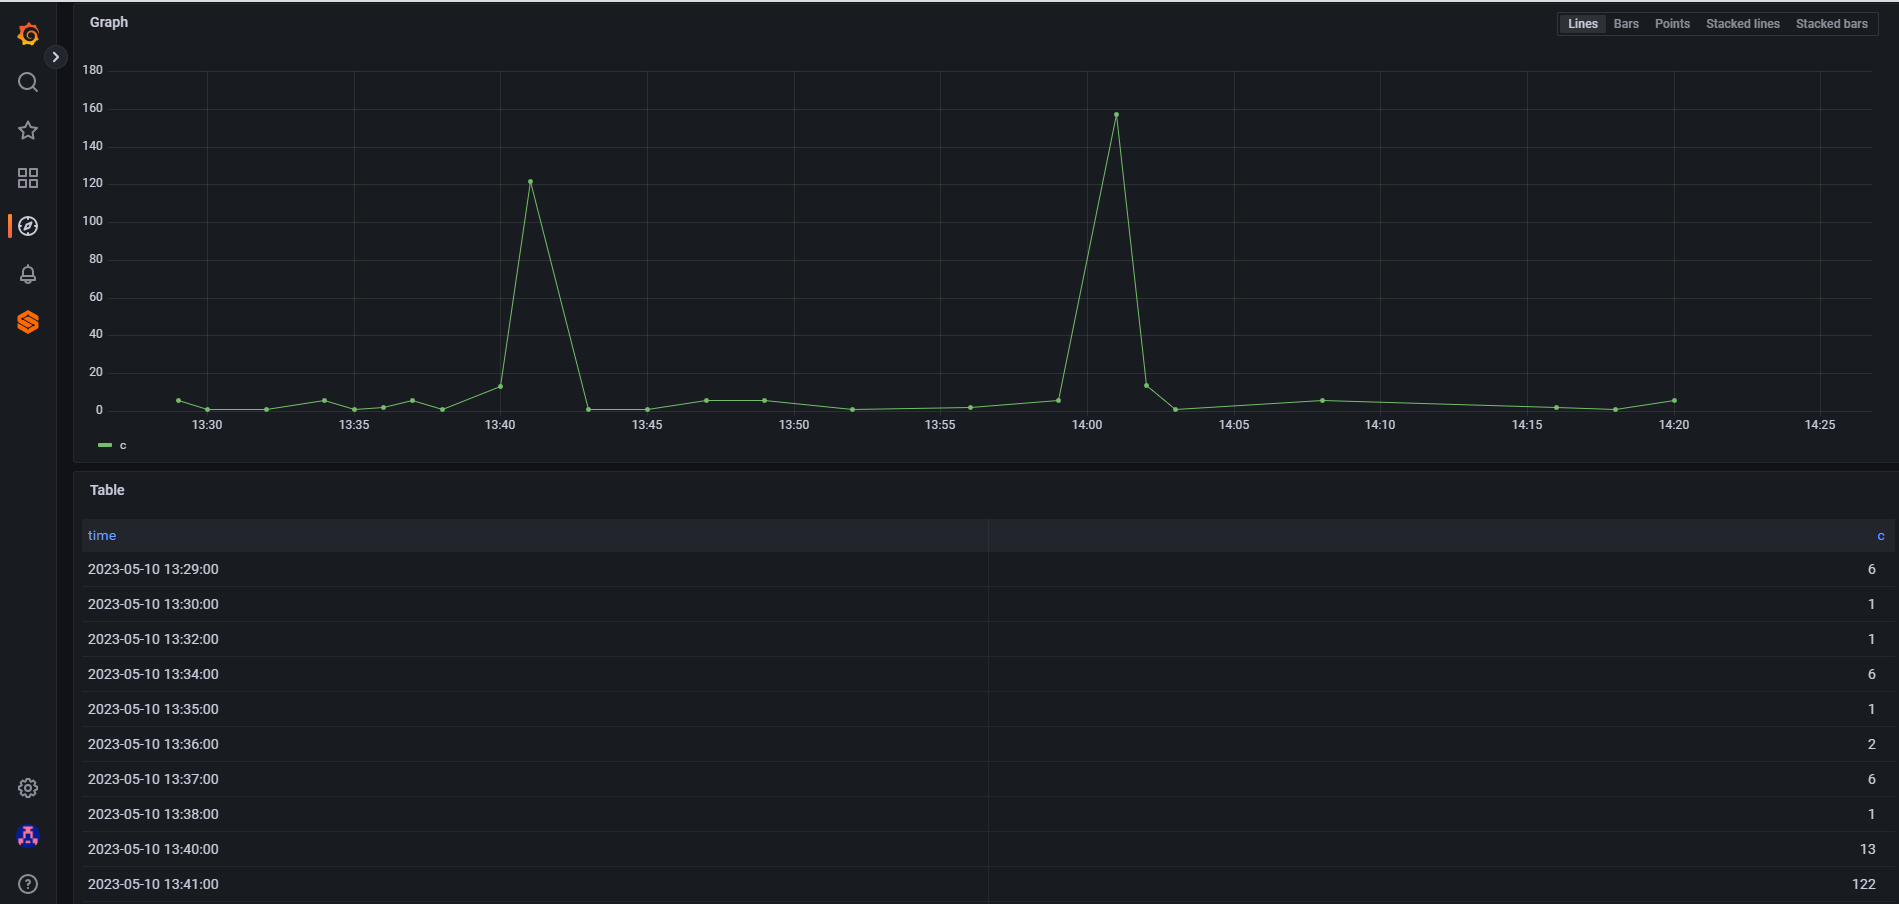
View data in bar graph.
Check the Stacked line graph.
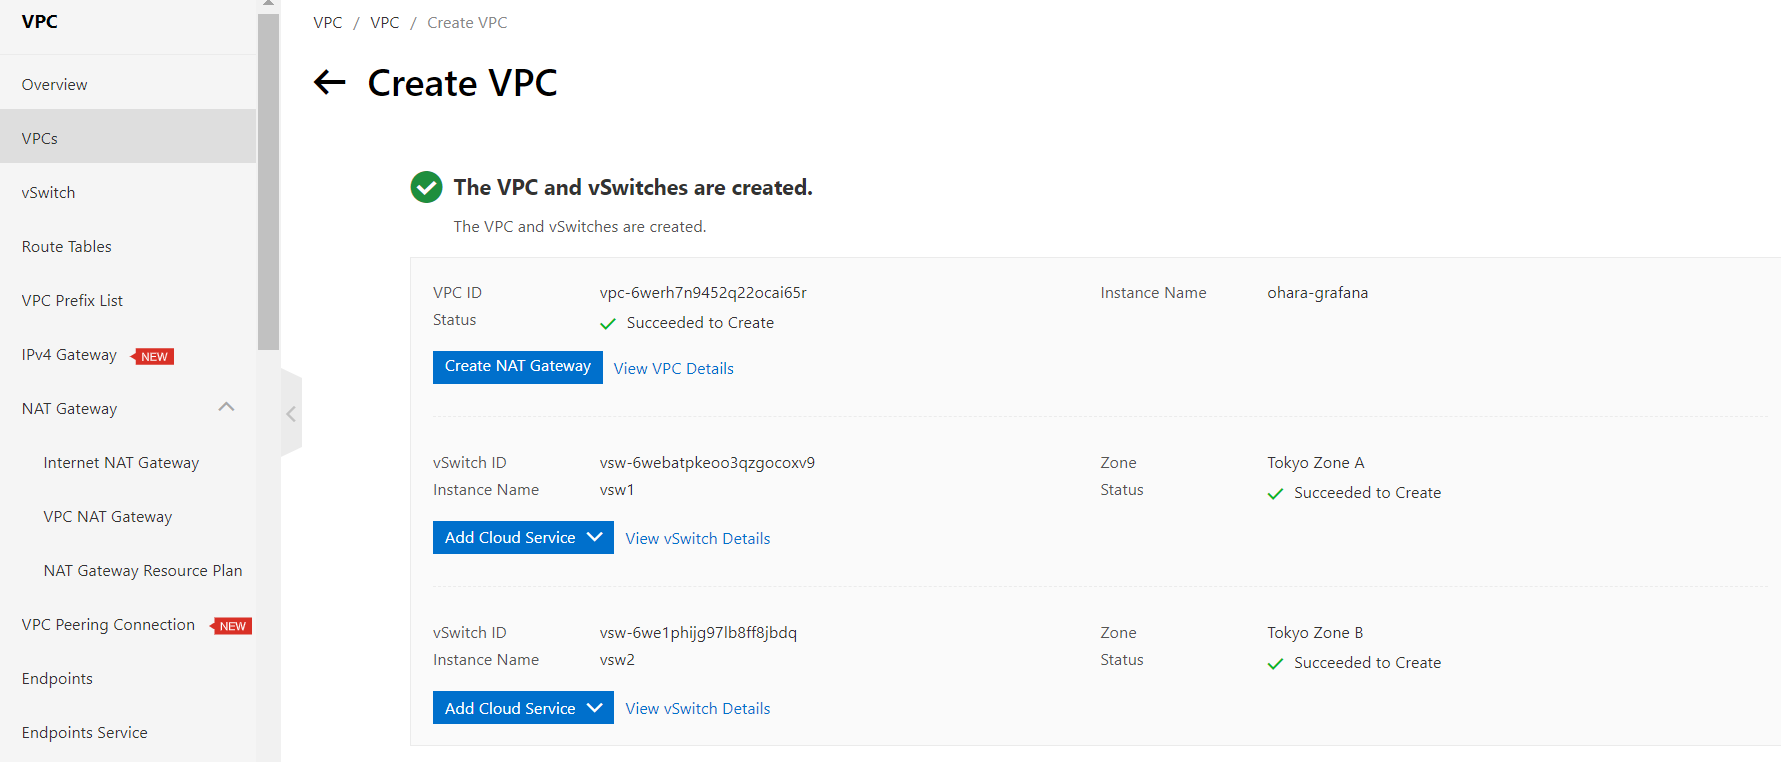
Create a VPC.

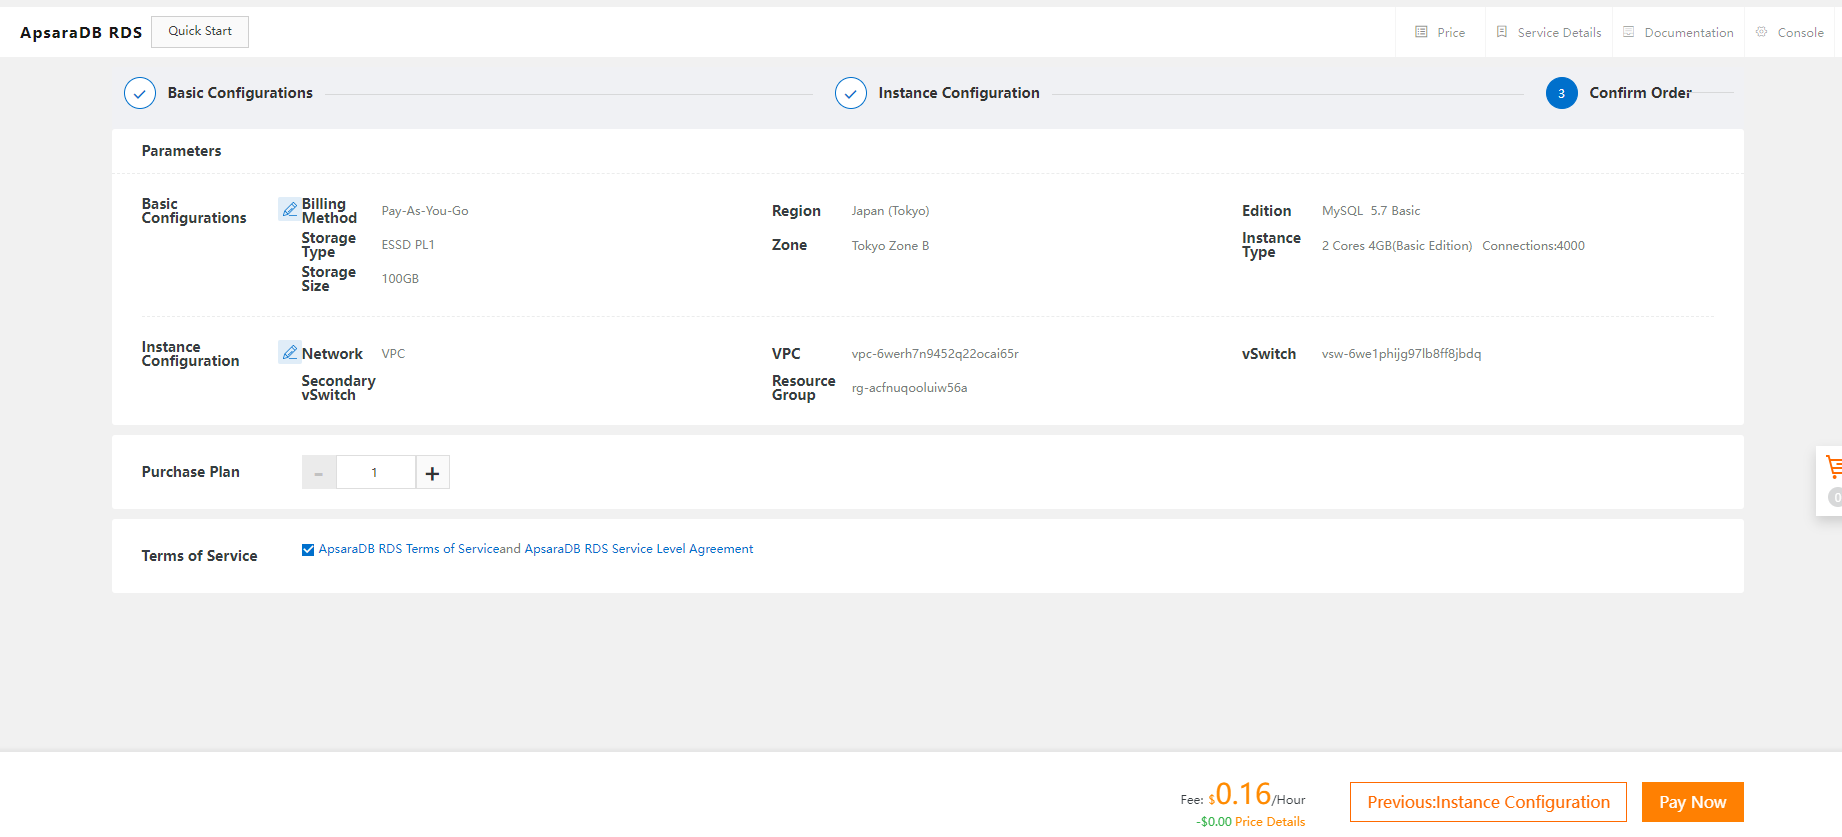
Create an ApsaraDB RDS for MySQL instance.

Prepare MySQL data.
(1) Create an account.
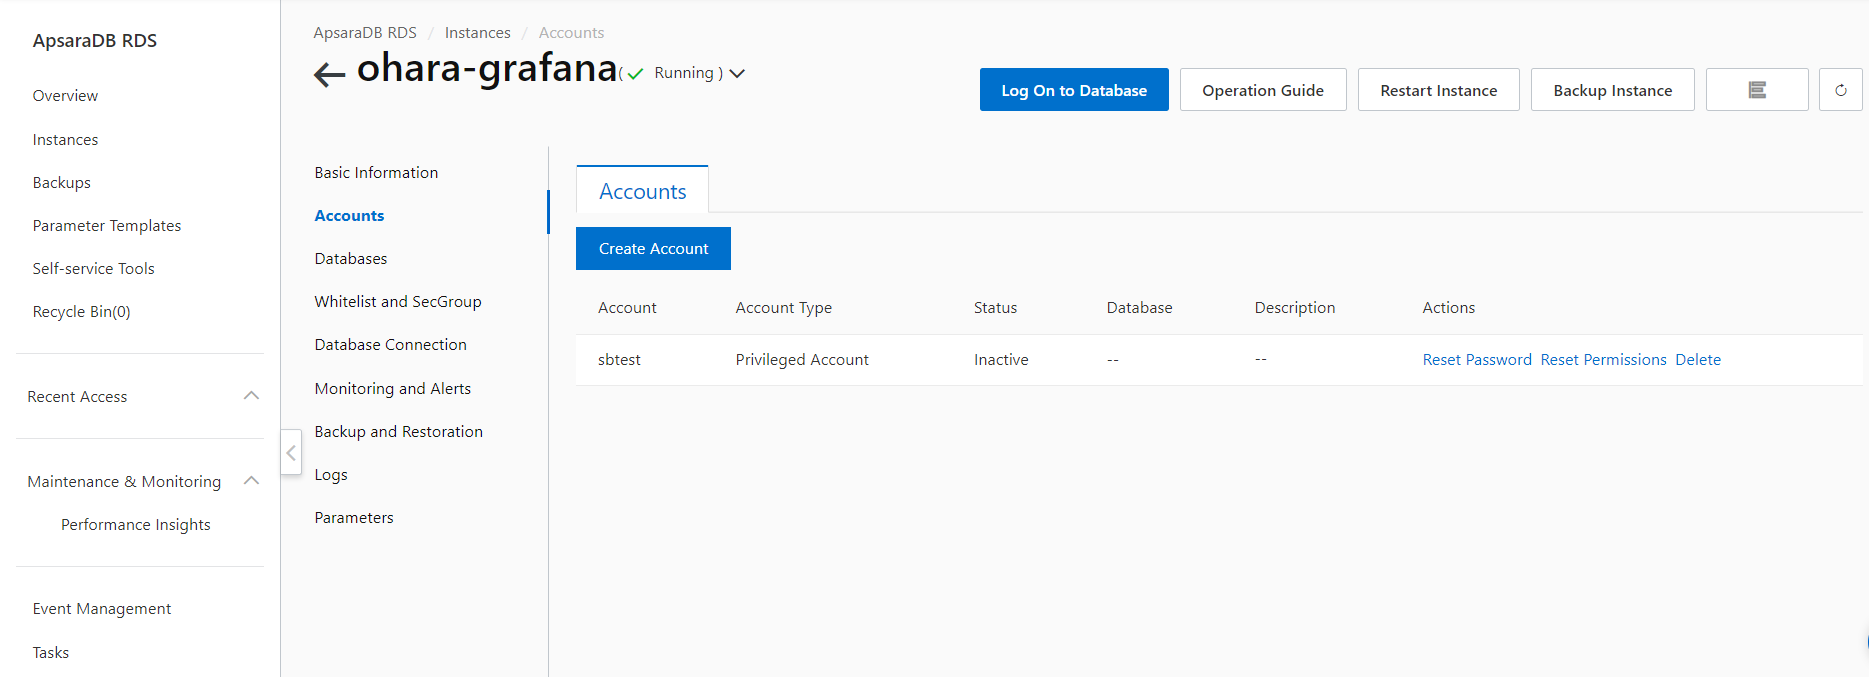
(2) Create a database.
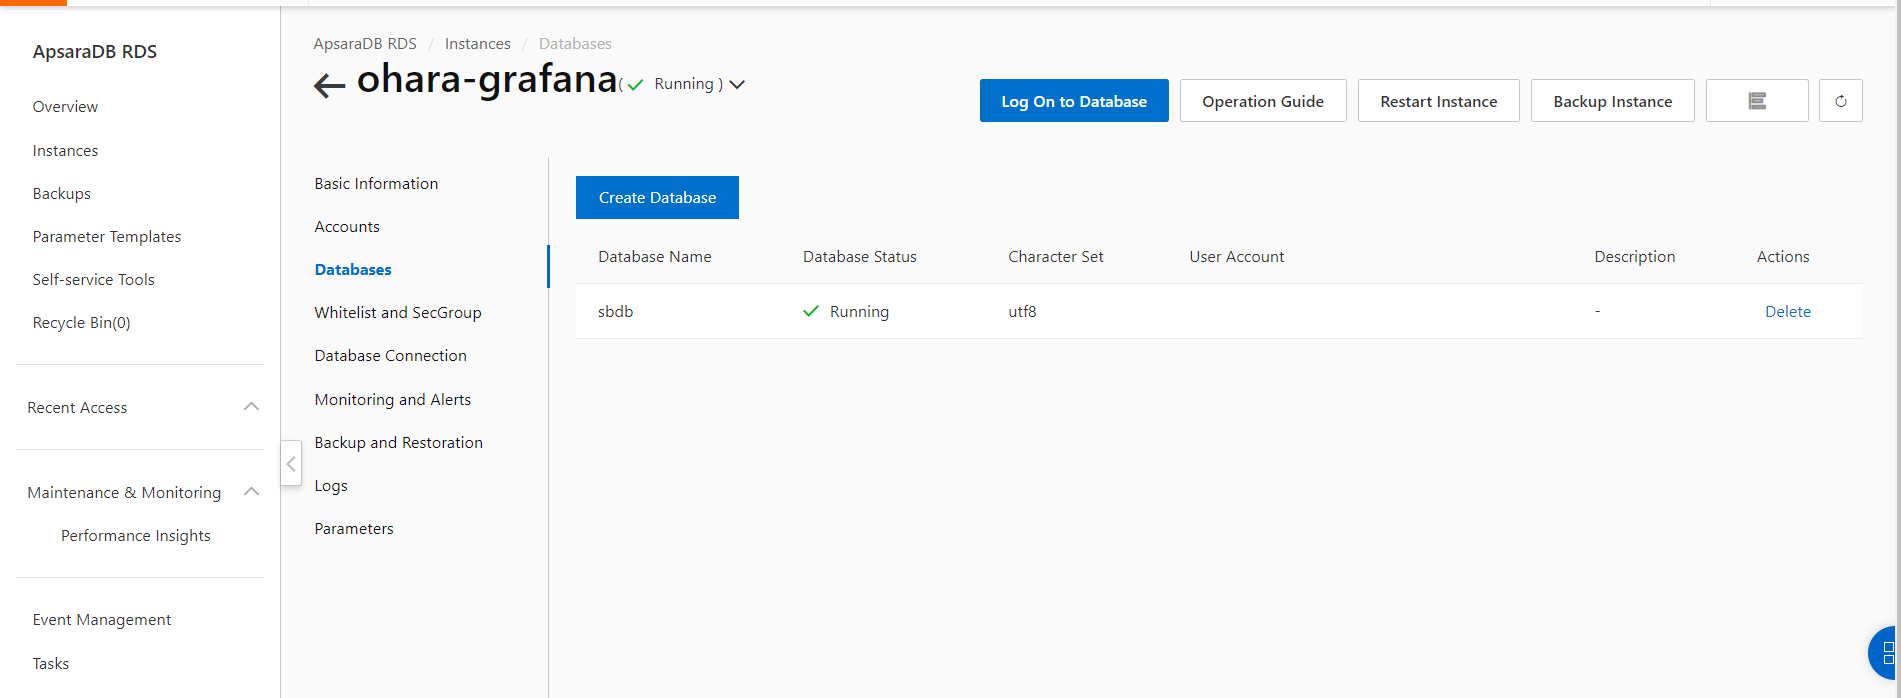
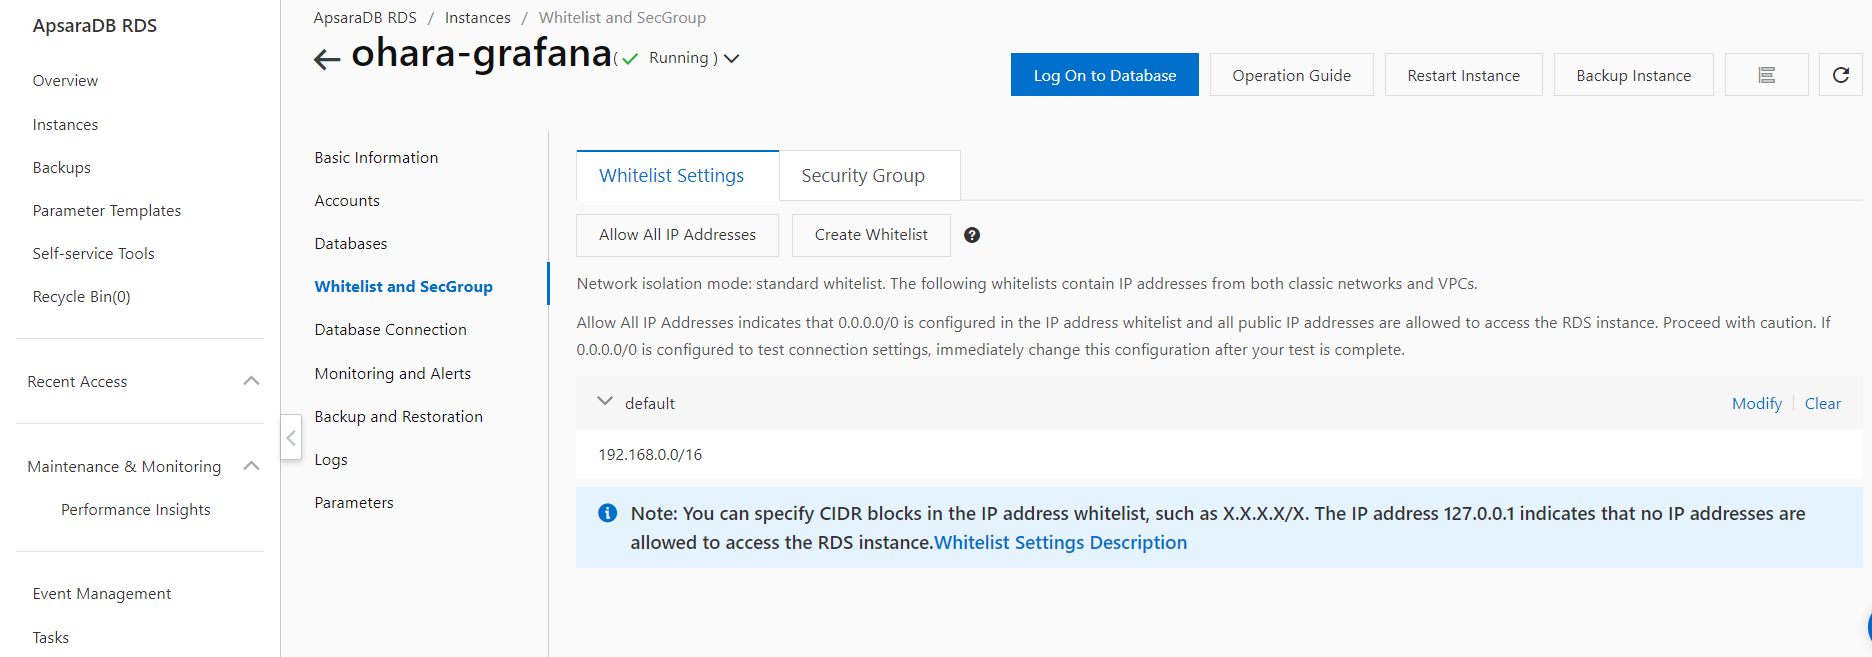
(3) Check the whitelist.
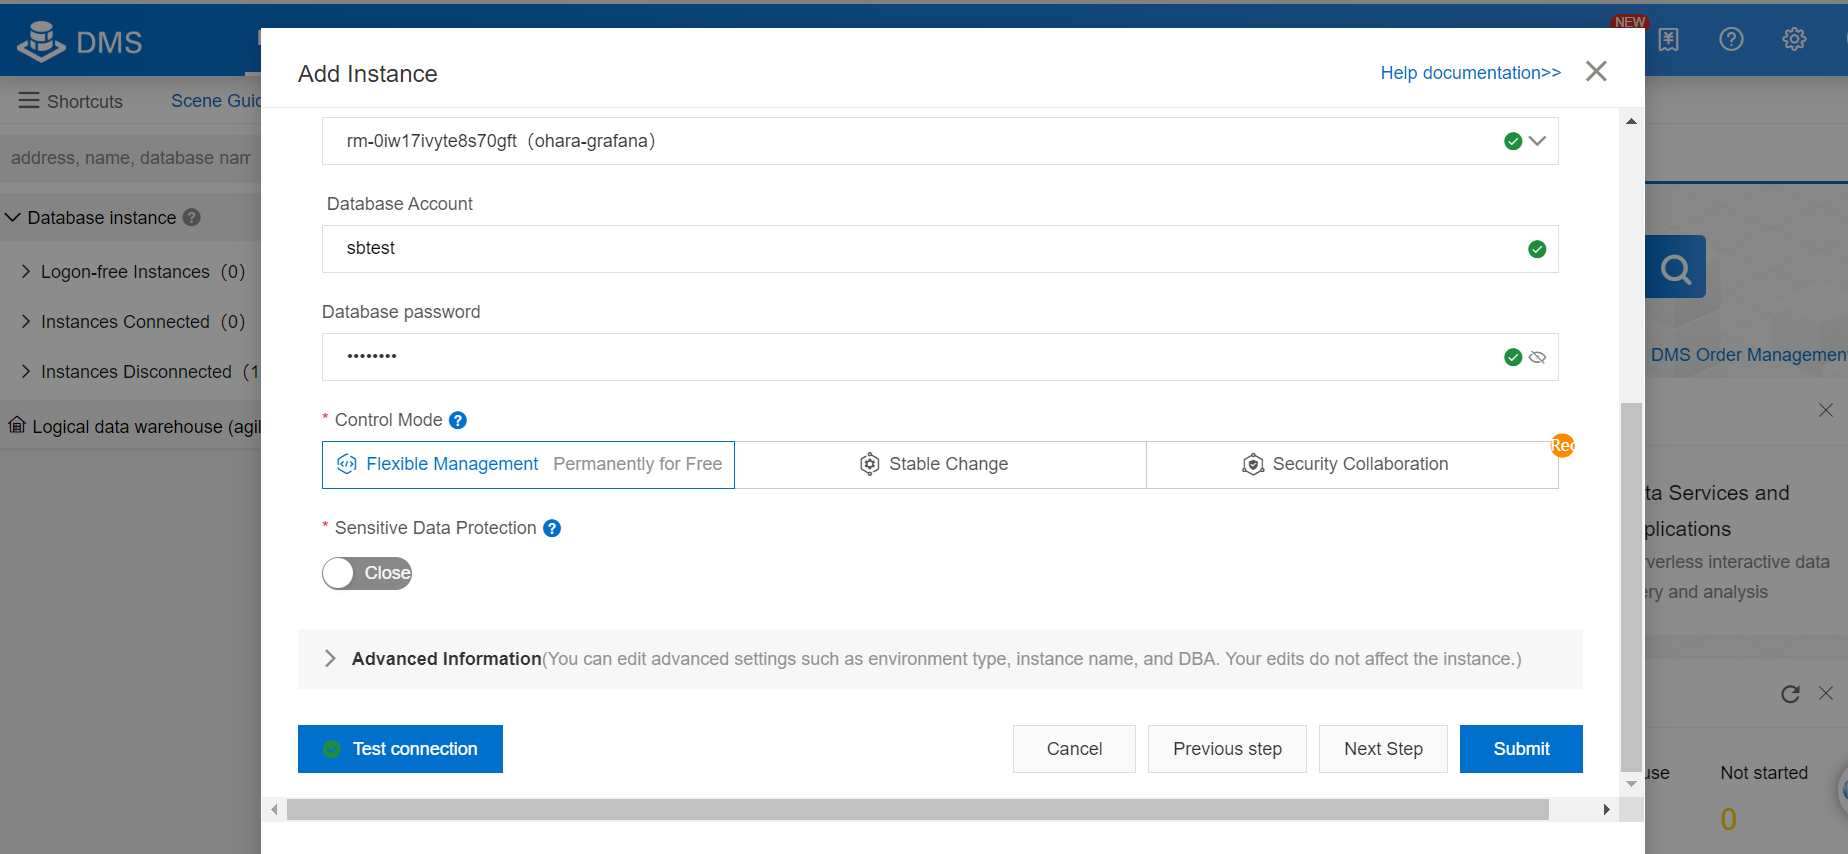
(4) Log on to the ApsaraDB RDS for MySQL instance.
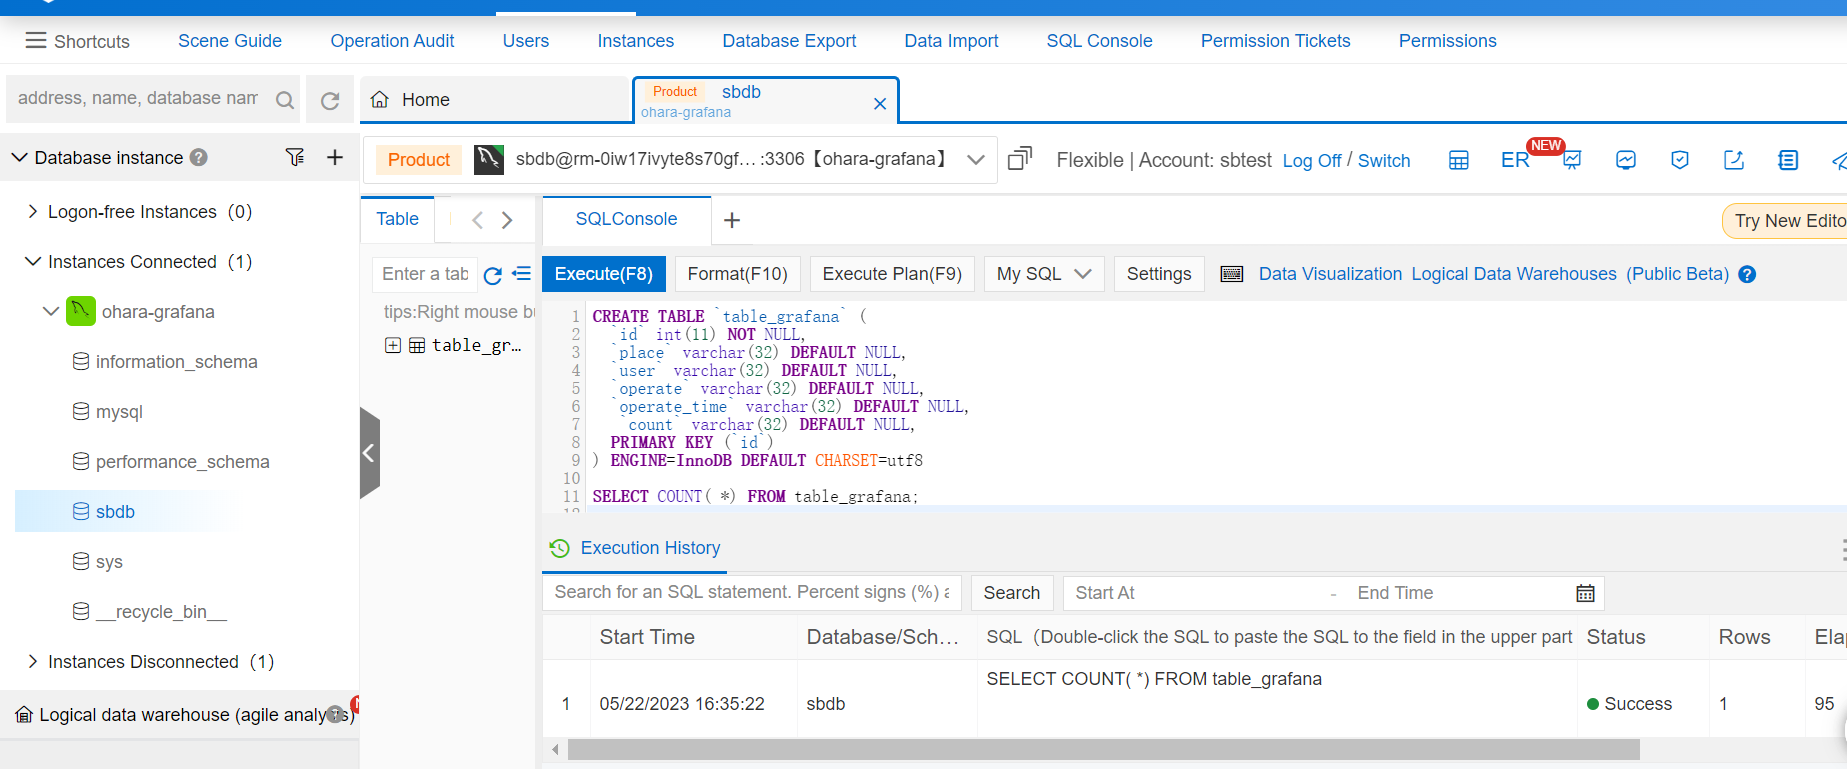
(5) Create a table.
CREATE TABLE `table_grafana` (
  `id` int(11) NOT NULL,
  `place` varchar(32) DEFAULT NULL,
  `user` varchar(32) DEFAULT NULL,
  `operate` varchar(32) DEFAULT NULL,
  `operate_time` varchar(32) DEFAULT NULL,
   `count` varchar(32) DEFAULT NULL,
  PRIMARY KEY (`id`)
) ENGINE=InnoDB DEFAULT CHARSET=utf8
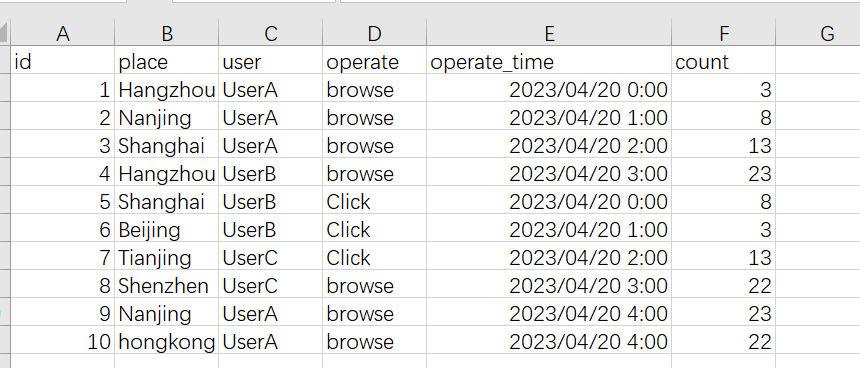
(6) Prepare CSV data.
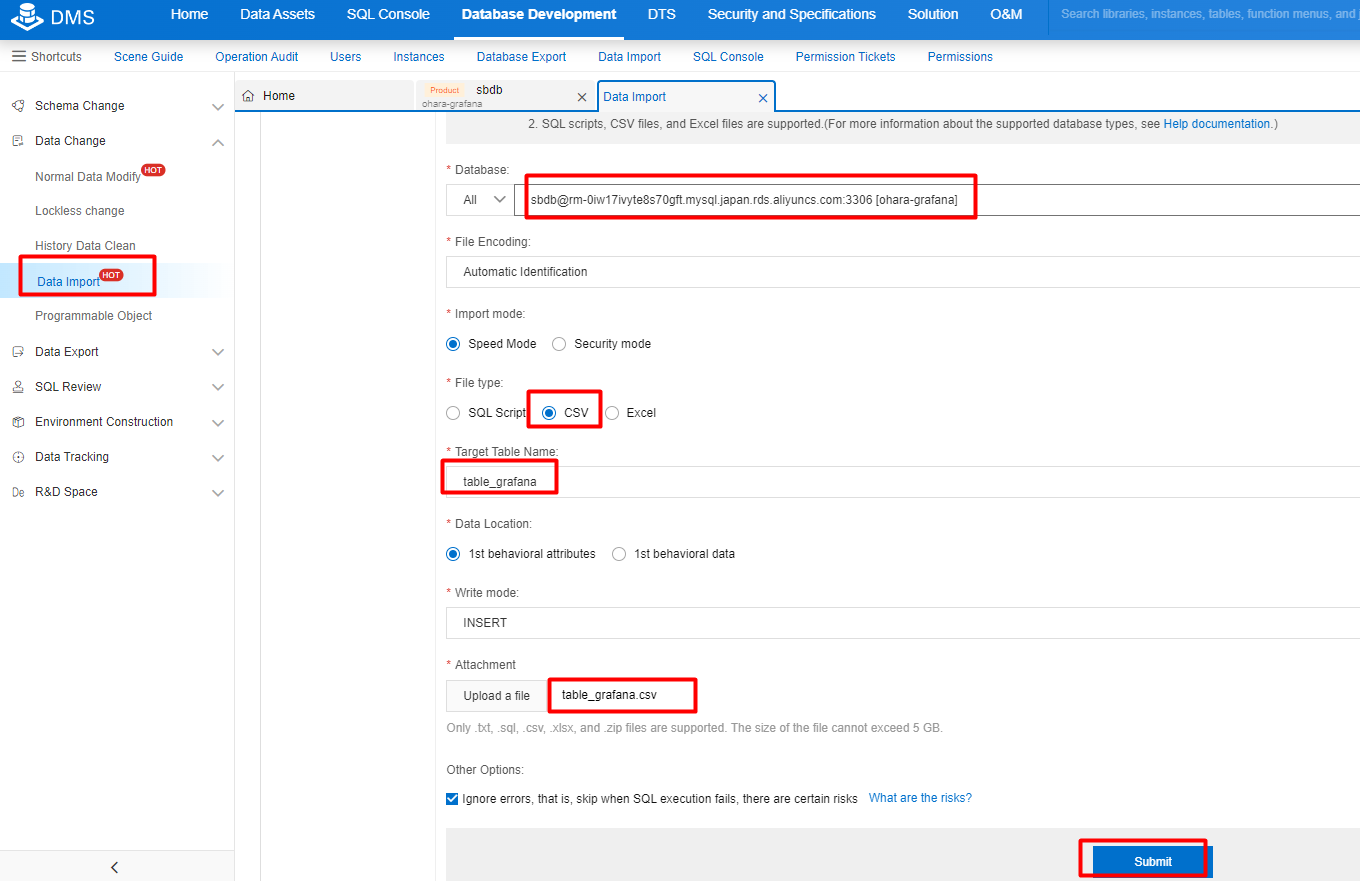
(7) Import data from CSV file.
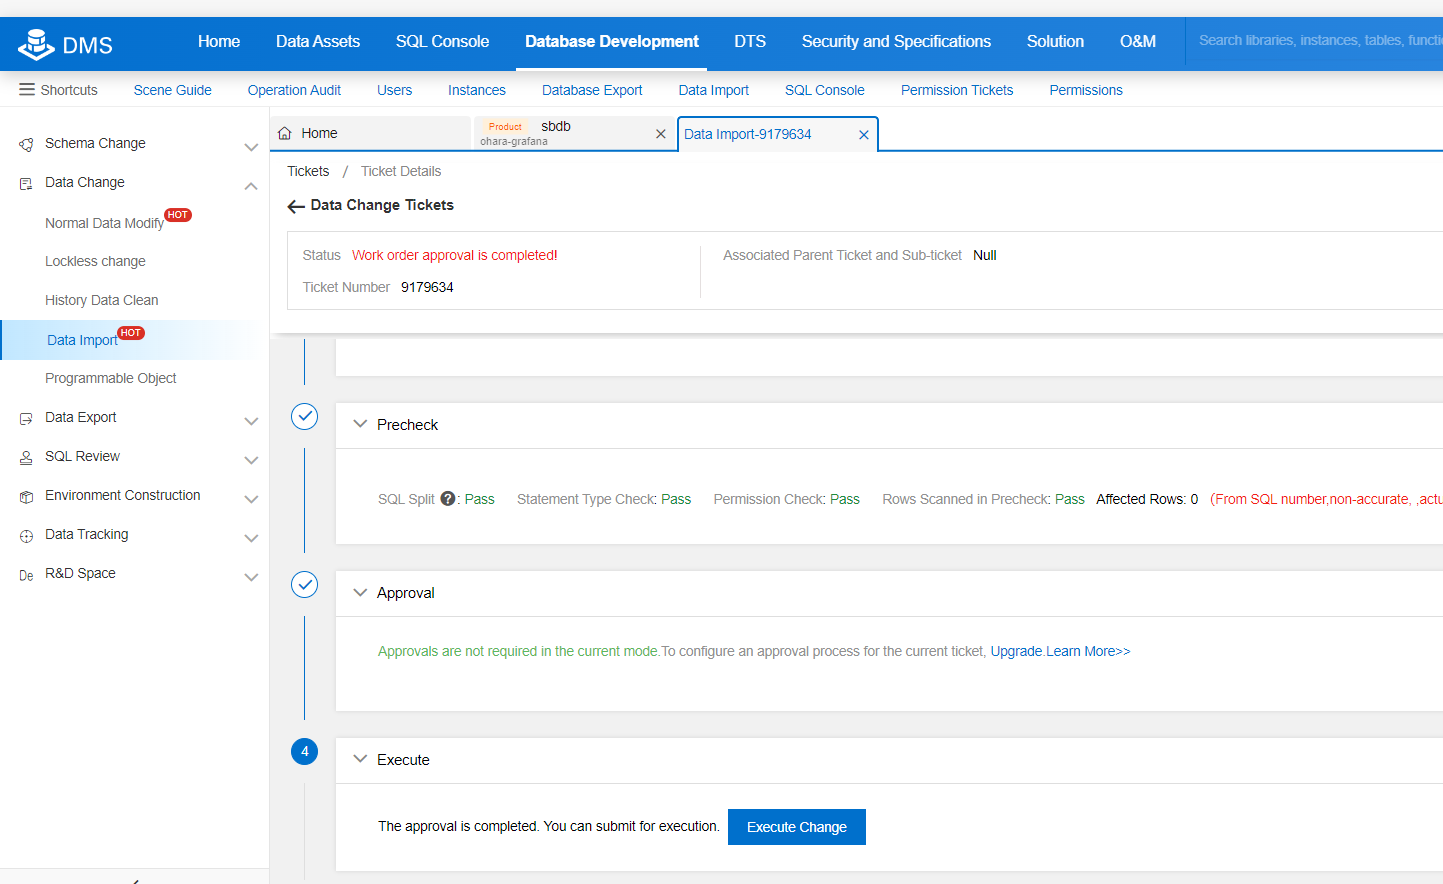
Click Execute Change.
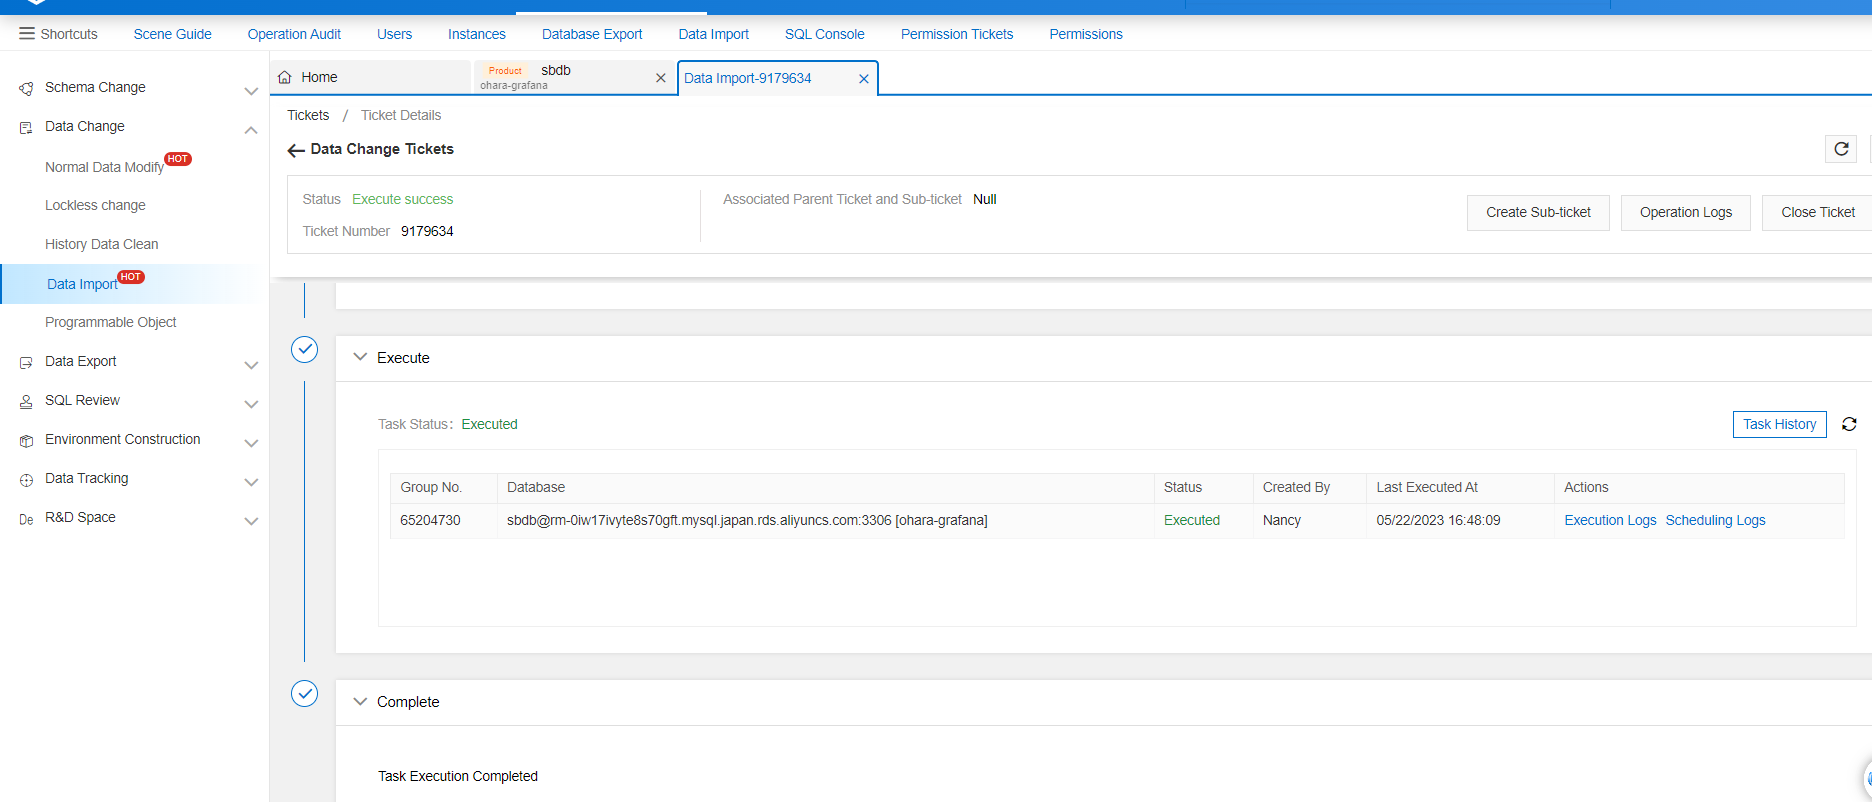
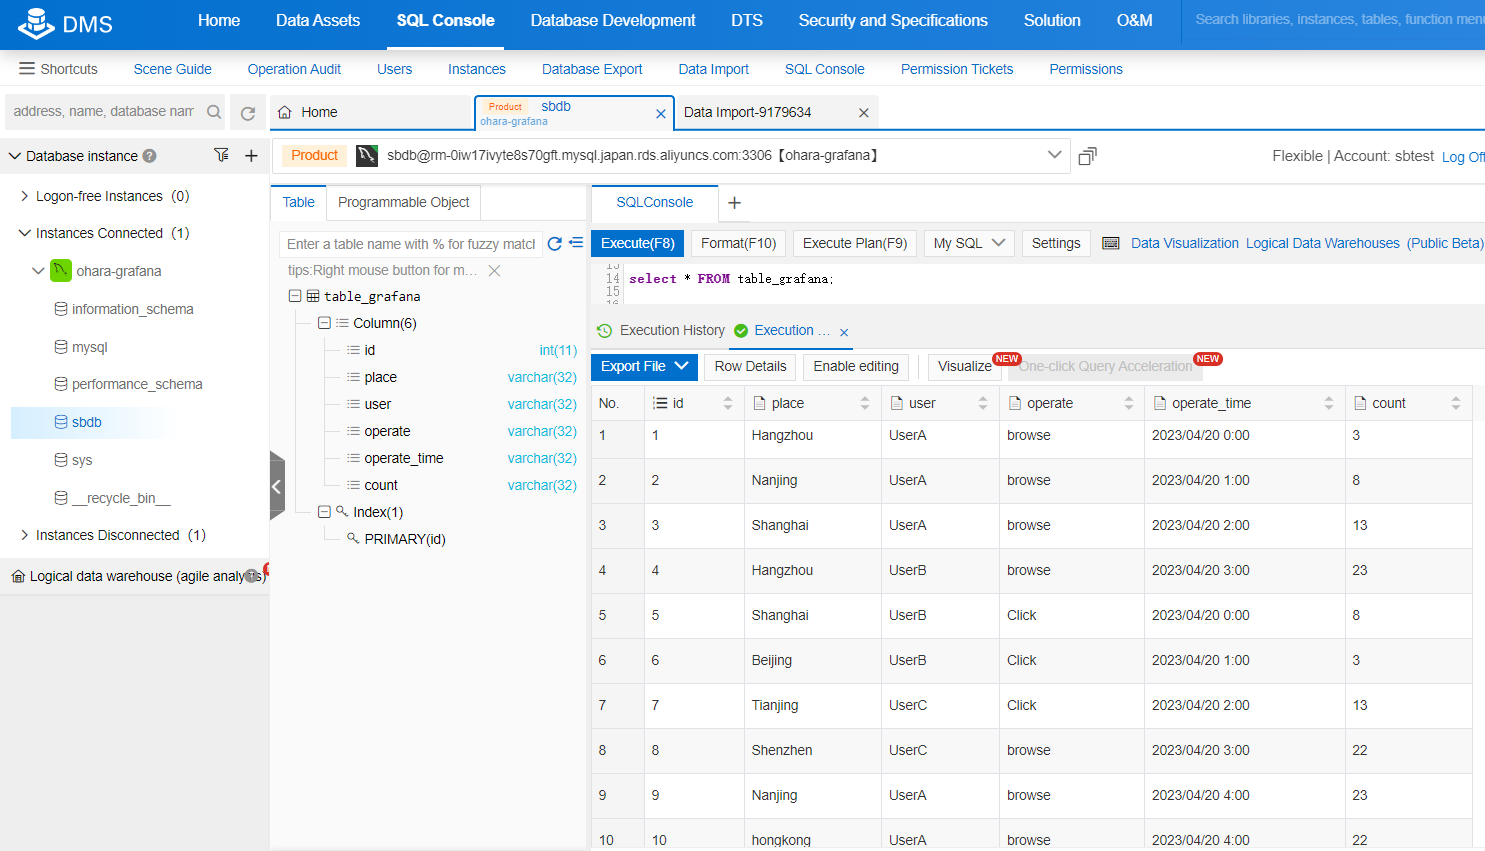
(8) Check the data.
Log on to the access URL of the Grafana instance.
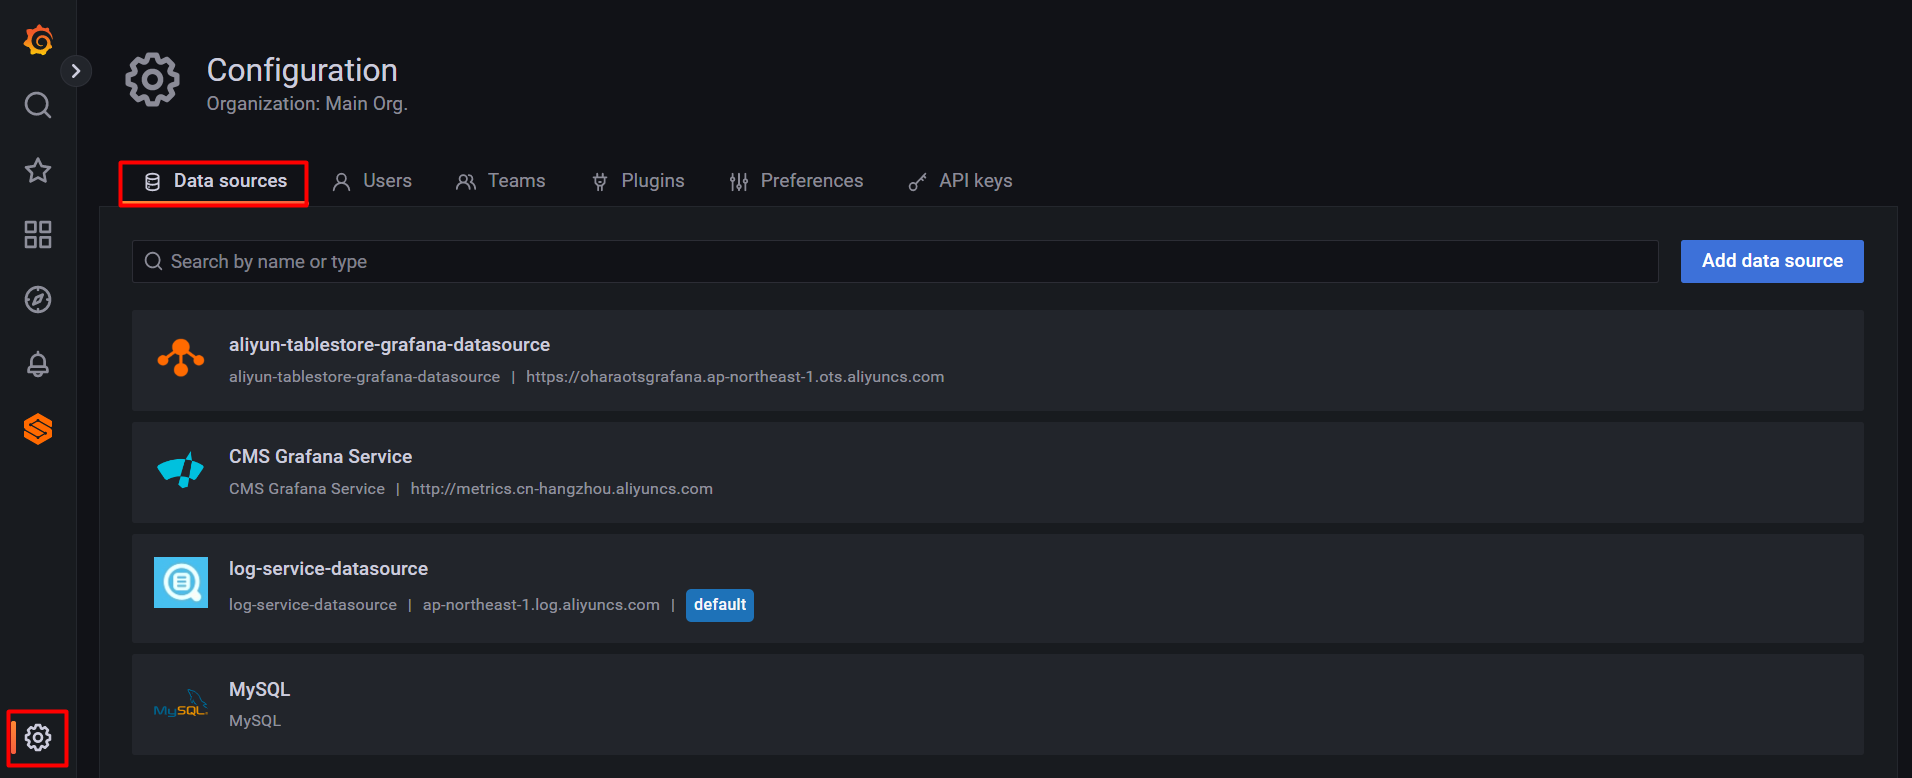
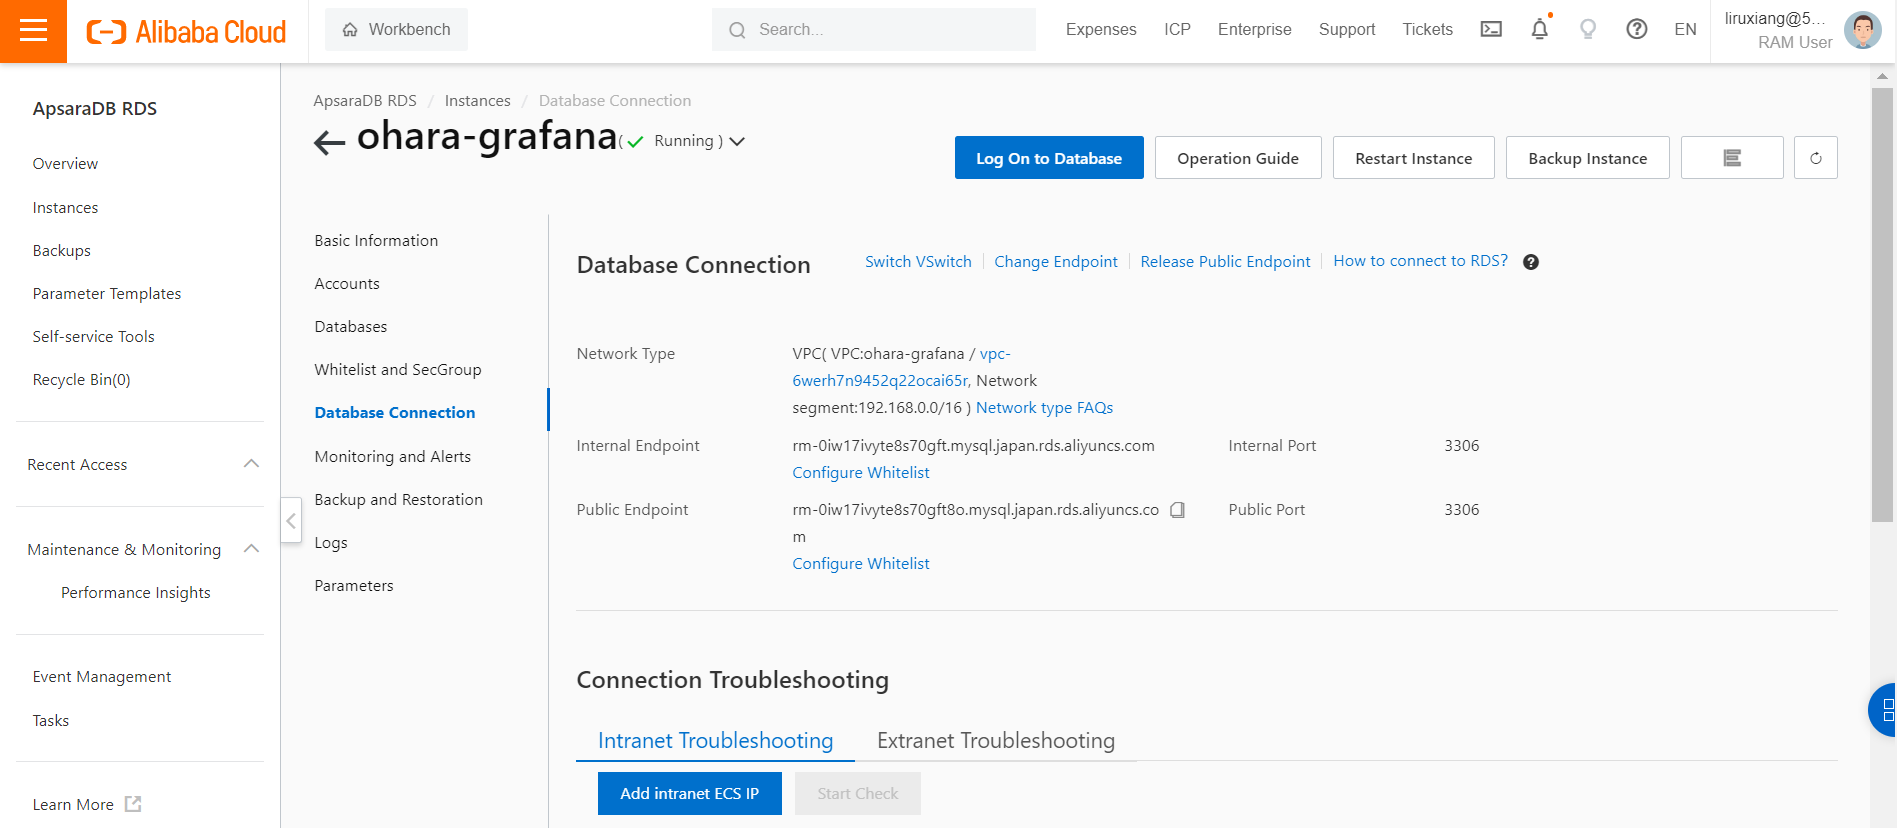
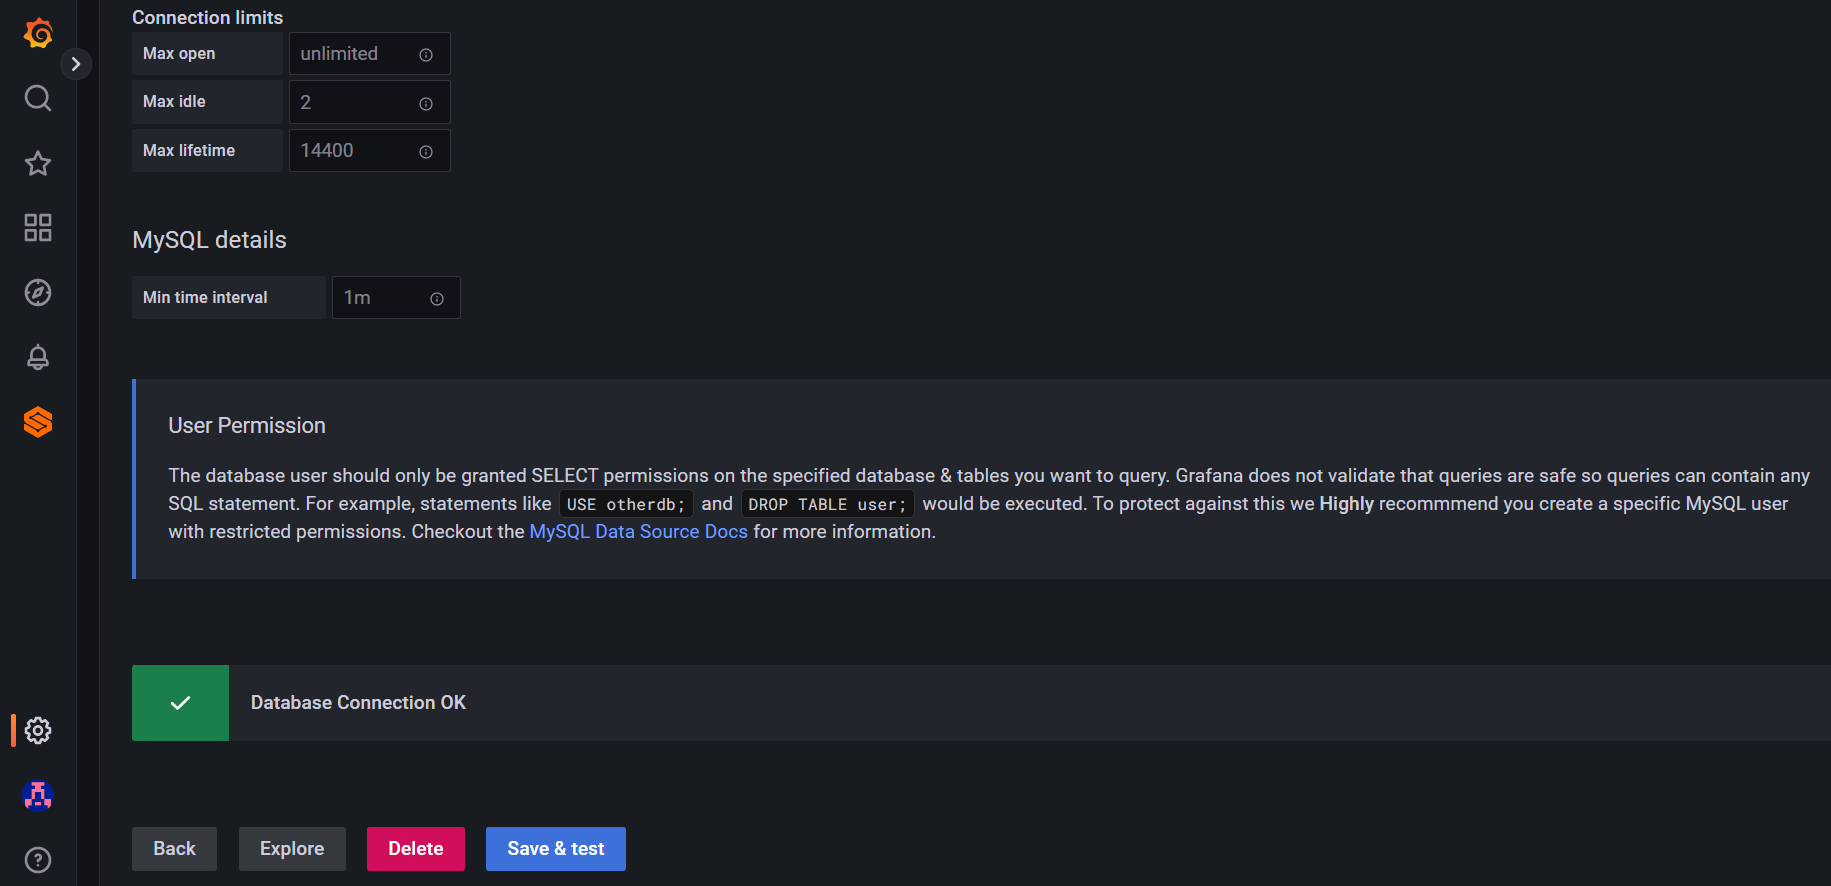
Add the MySQL data source.
Host: rm-0iw17ivyte8s70gft8o.mysql.japan.rds.aliyuncs.com:3306
Data source: SBDB
User: sbtest
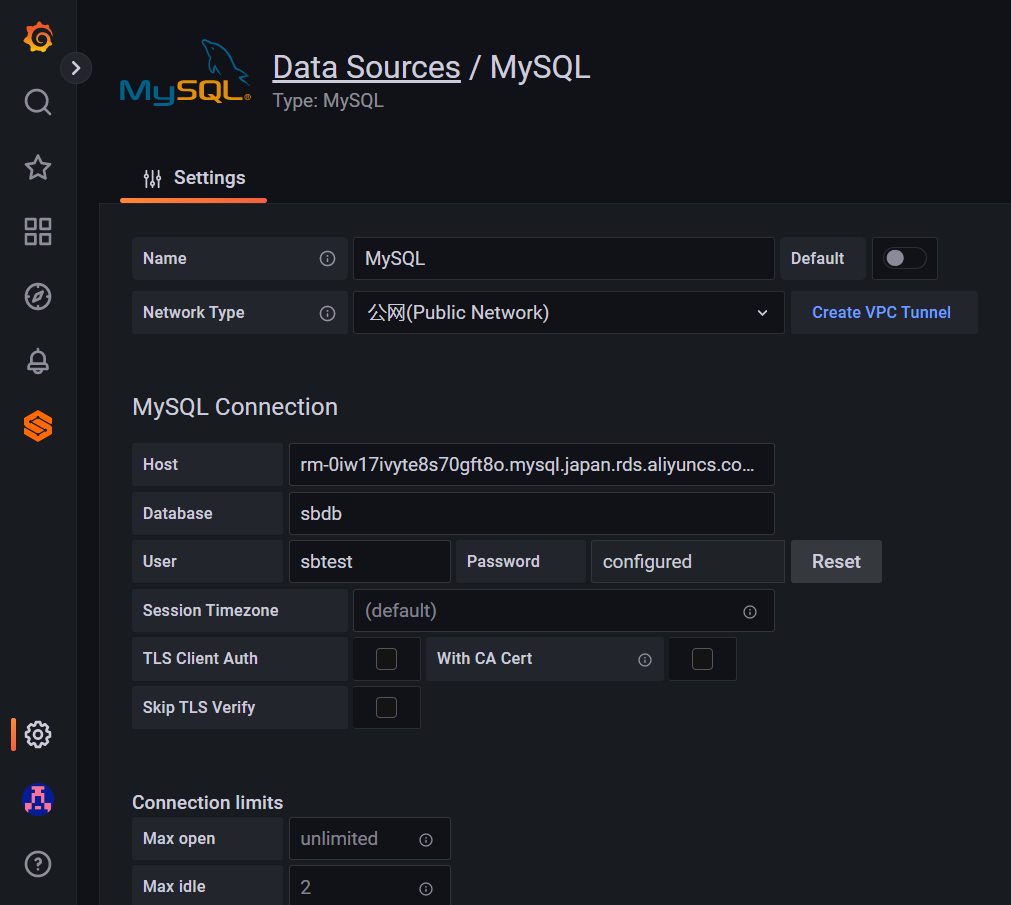
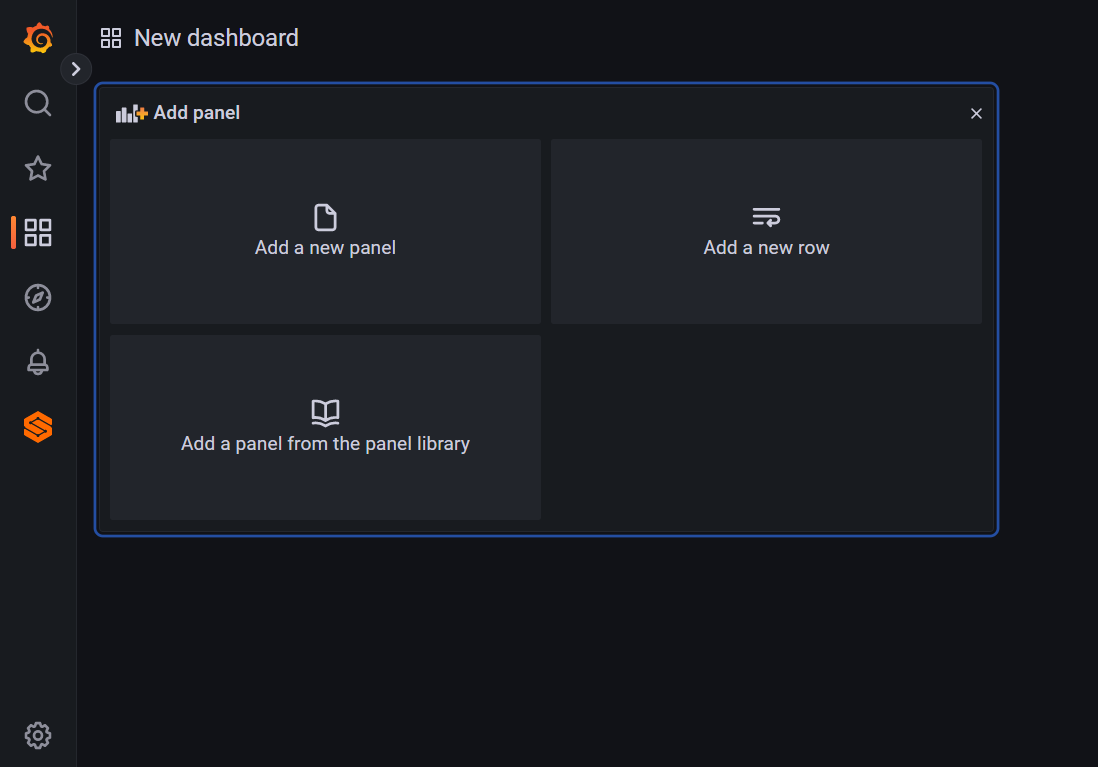
Create a dashboard.
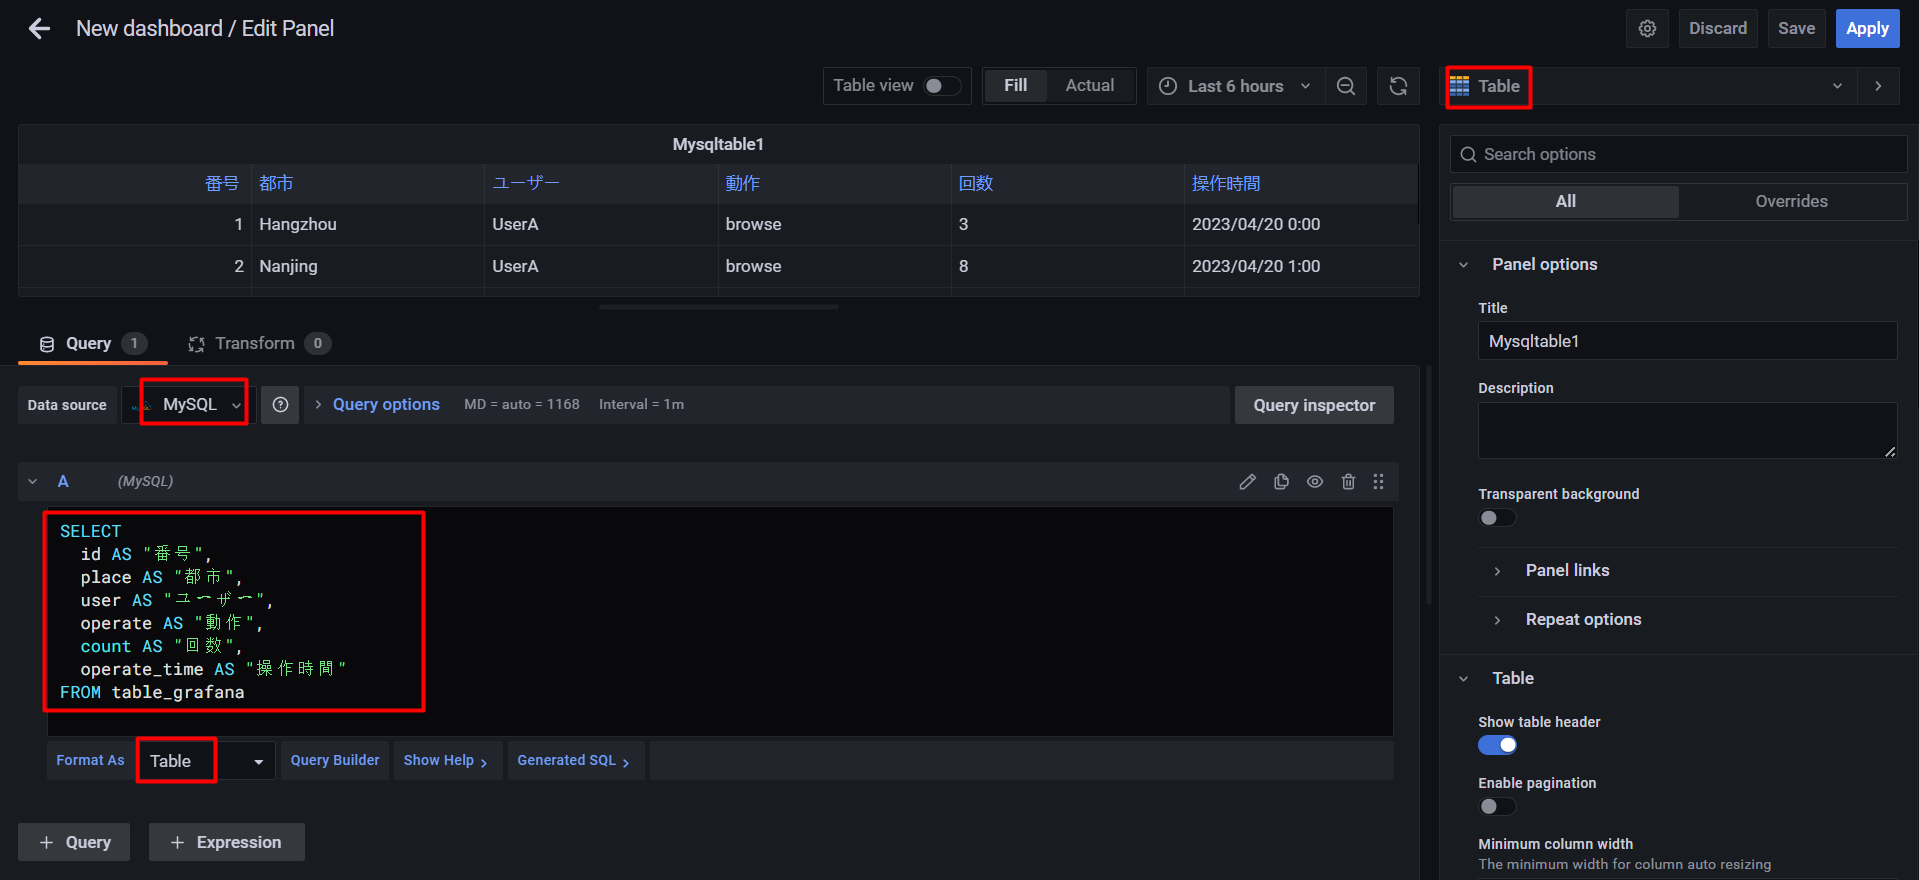
(1) Create a panel for the table.
SELECT
  id AS "Numbers",
  place AS "Cities",
  user AS "Users",
  operate AS "Actions",
  count AS "Counts",
  operate_time AS "Operation Time"
FROM table_grafana
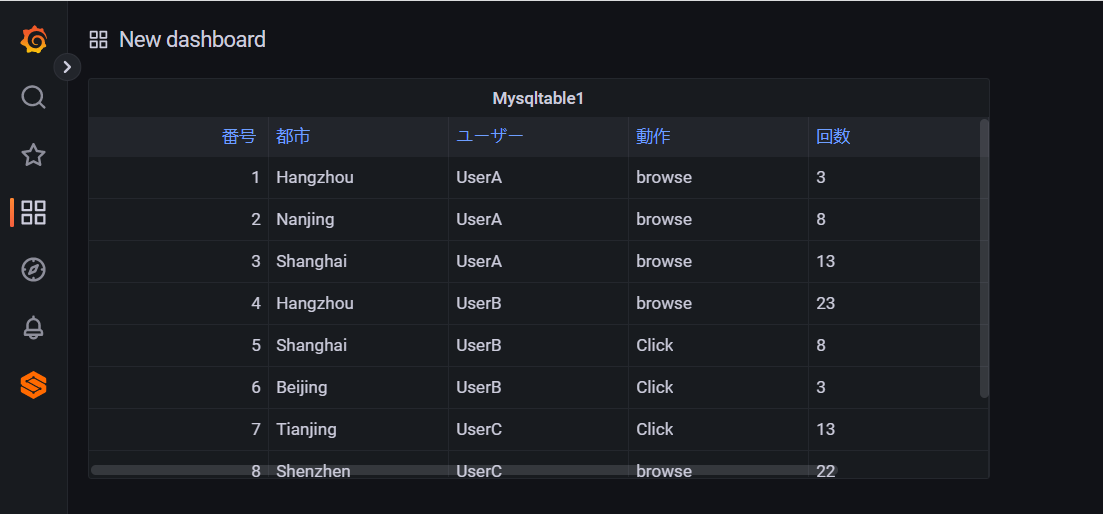
Click Apply.
(2) Create a chronological panel.
Data Source: MySQL
Panel: TimeSeries
Style: Bars
Opacity: 100
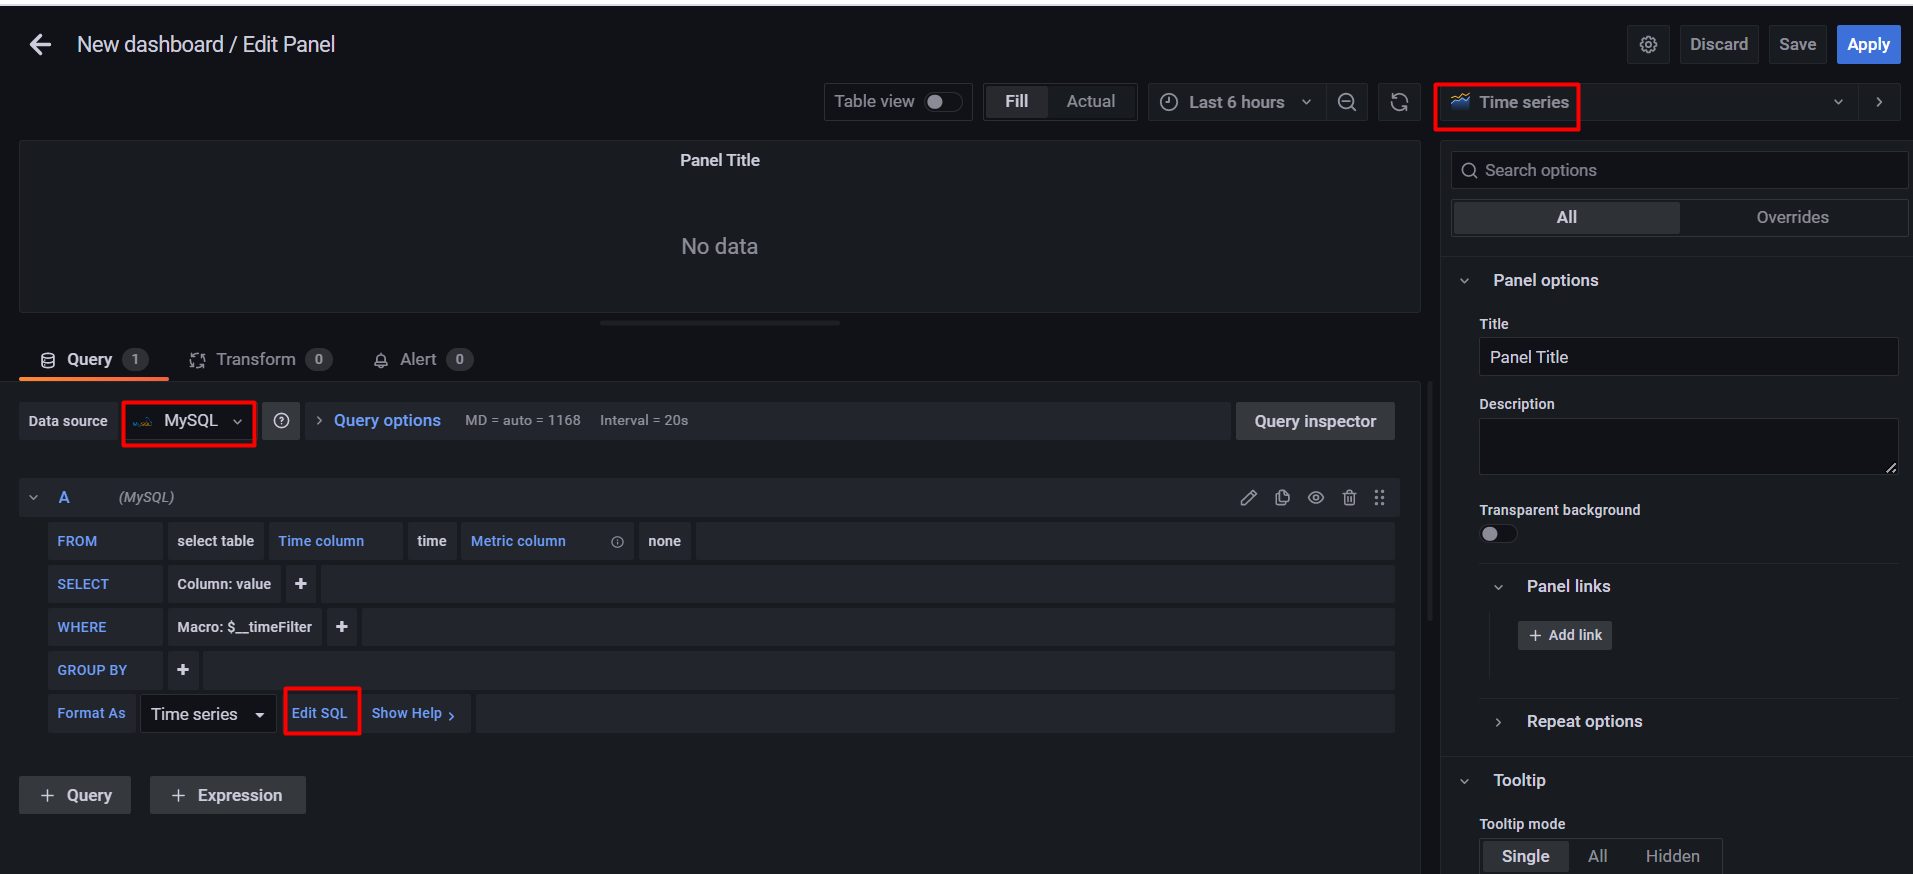
Click Edit SQL.
Run the following SQL query:
SELECT
  UNIX_TIMESTAMP(operate_time) DIV 3600 * 3600 AS "time",
  user AS metric,
  avg(count) AS "count"
FROM table_grafana
WHERE
  operate_time BETWEEN FROM_UNIXTIME(1681920000) AND FROM_UNIXTIME(    1681934400)
GROUP BY 1,2
ORDER BY UNIX_TIMESTAMP(operate_time) DIV 3600 * 3600
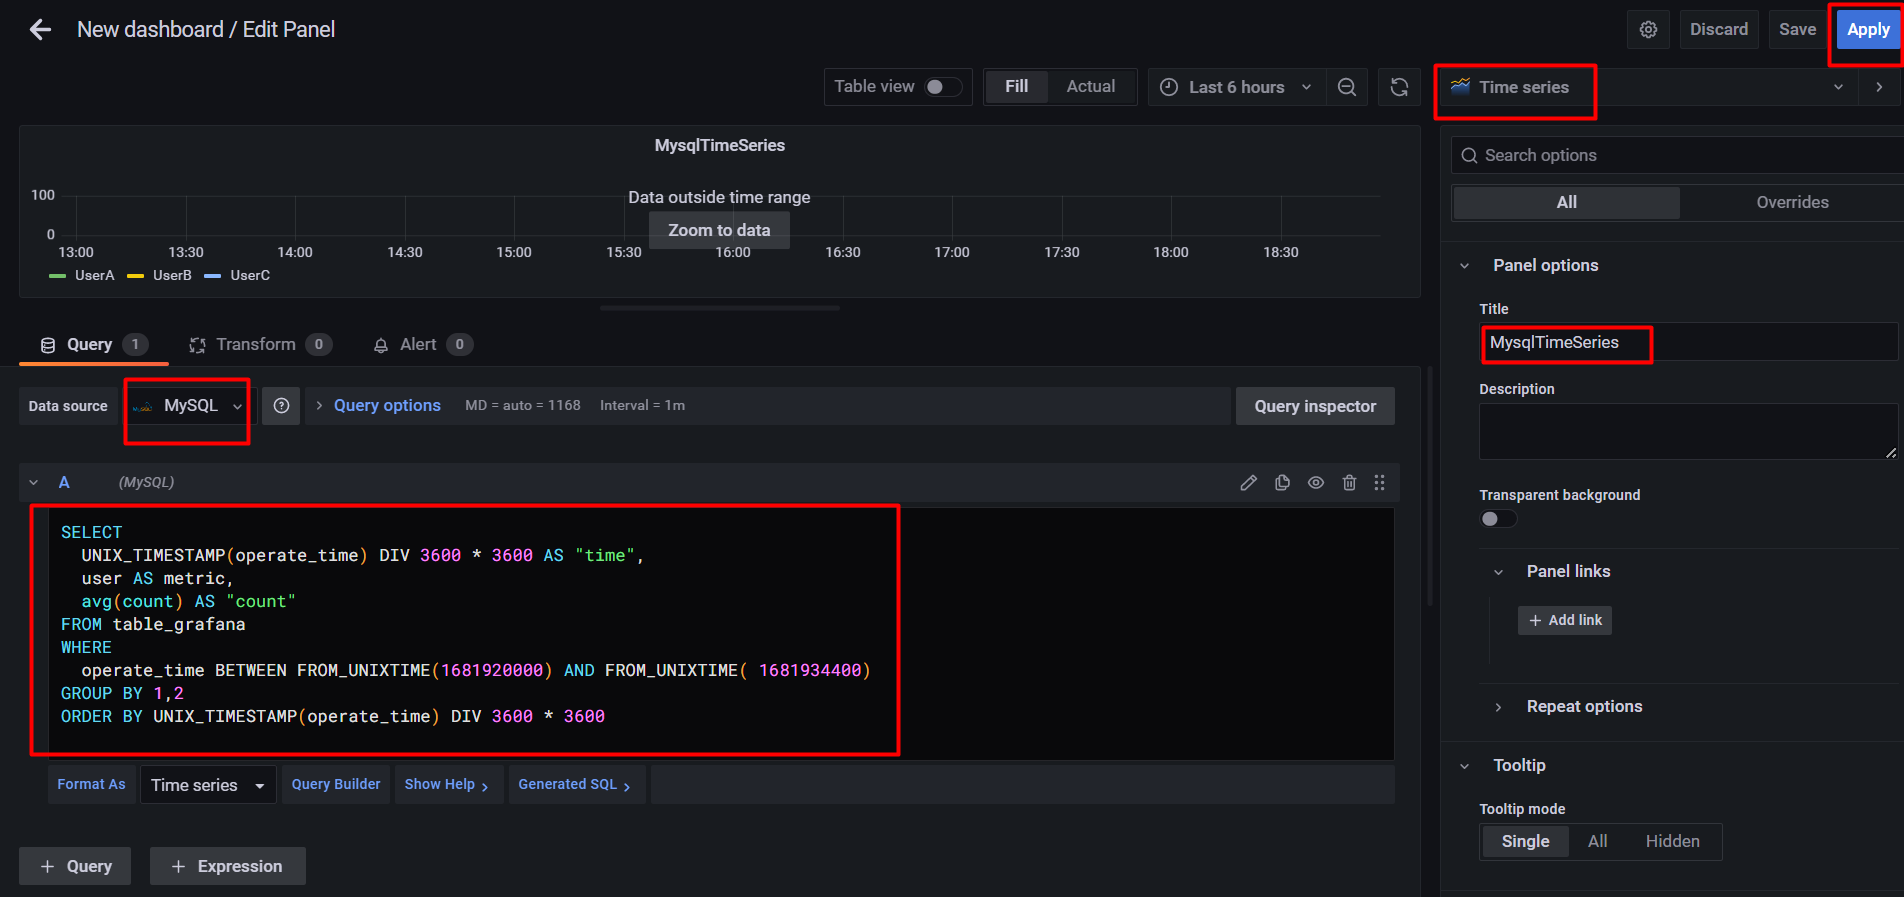
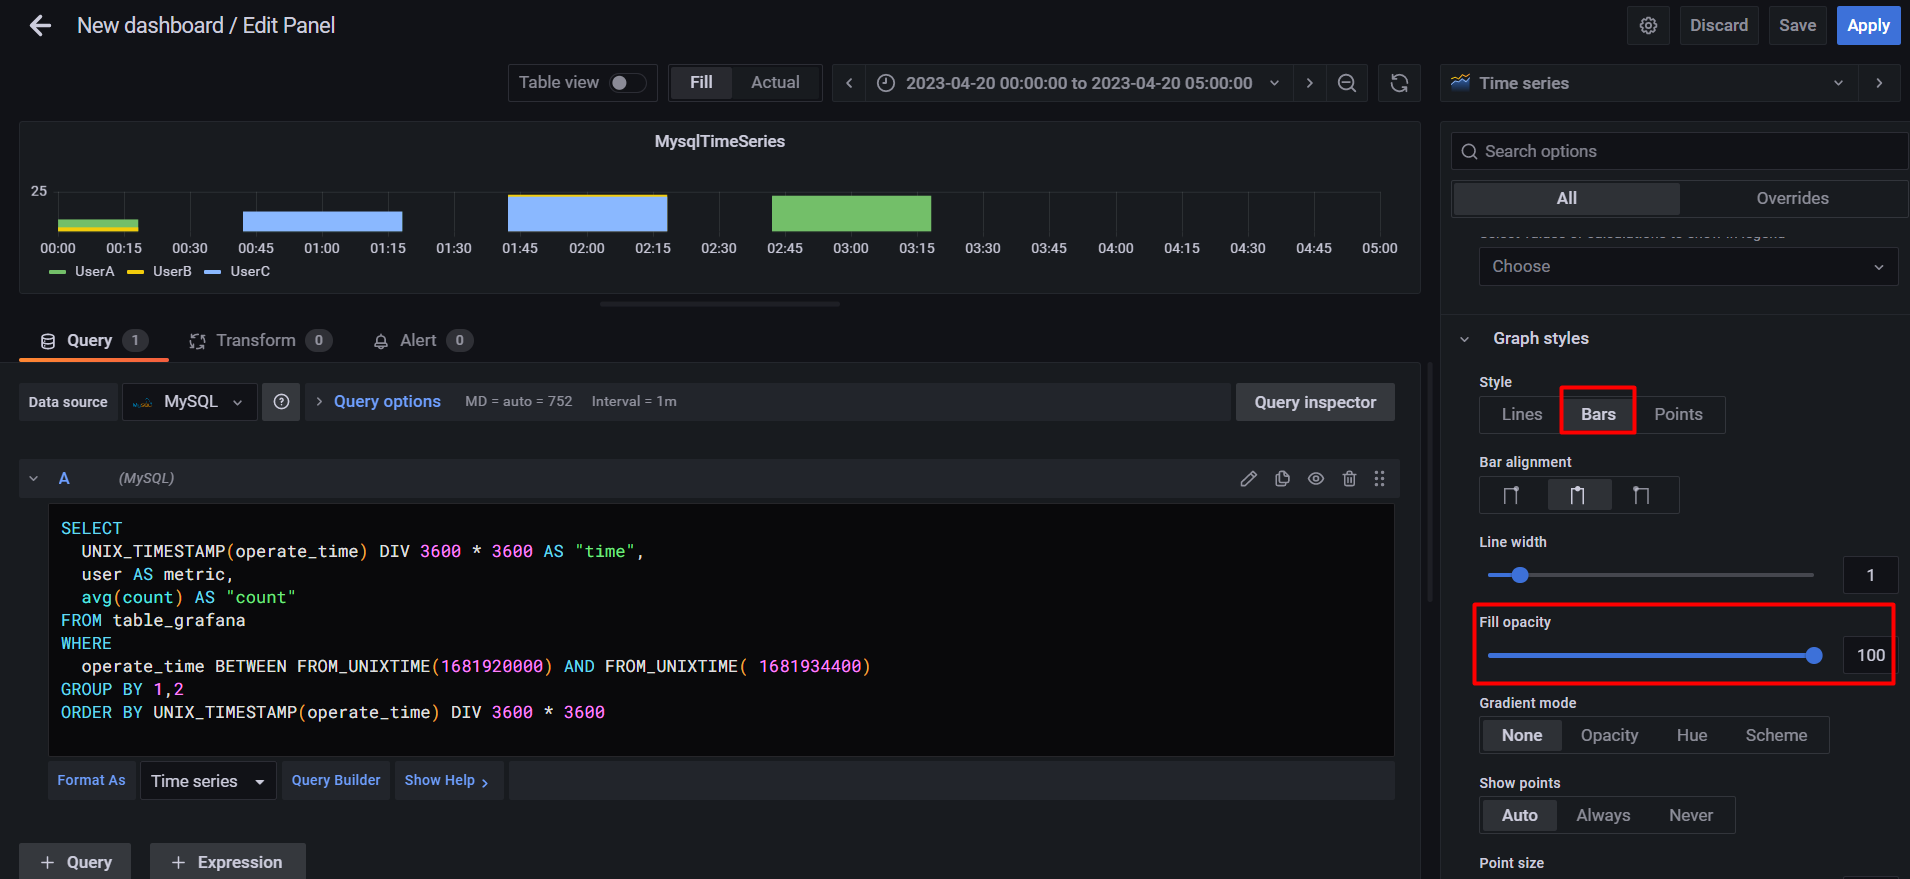
Click Apply.
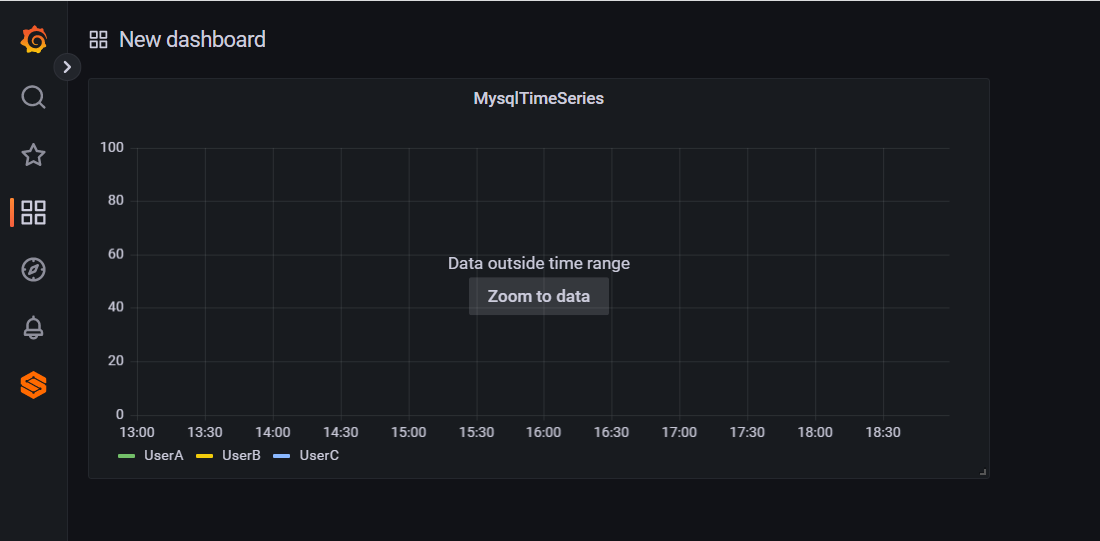
Click Zoom to data to display the graph.

Save the dashboard.
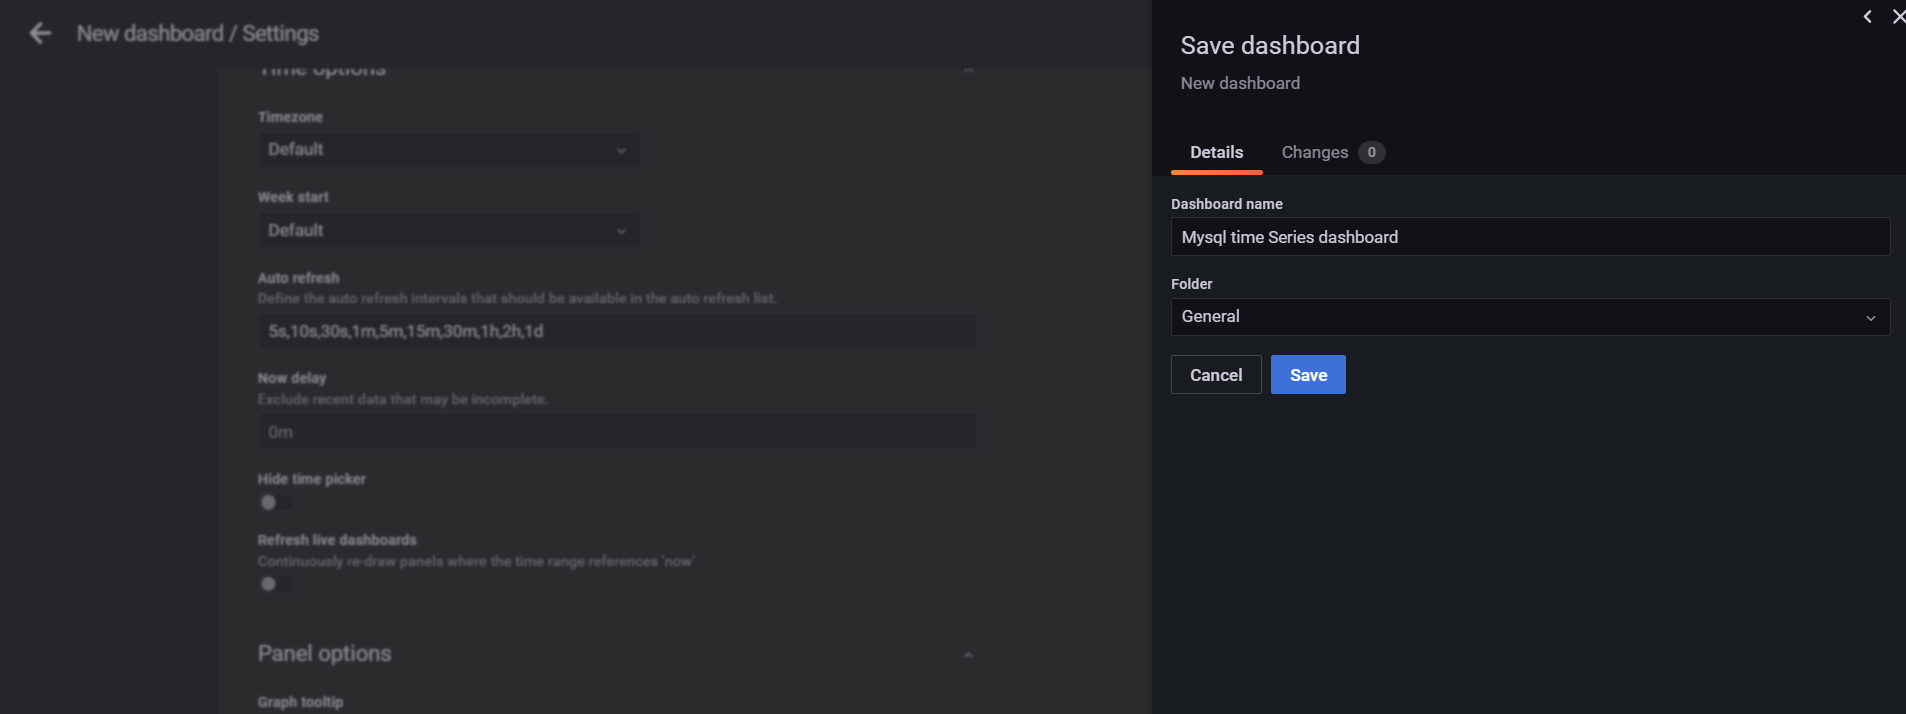
The dashboard has been saved.

Managed Service for Grafana is a cloud-native data visualization platformthat caters to the needs of data querying, data visualization, and setting alerts in various scenarios such as O&M monitoring, operational analysis, and report display. It supports a wide range of data sources. In concludion, we have introduced the basic use of the Managed Service for Grafana service.
This article is a translated piece of work from SoftBank:
https://www.softbank.jp/biz/blog/cloud-technology/articles/202309/alibaba-grafana/
https://www.softbank.jp/biz/blog/cloud-technology/articles/202309/alibaba-grafana2/
Disclaimer: The views expressed herein are for reference only and don't necessarily represent the official views of Alibaba Cloud.
Introducing Alibaba Cloud ApsaraDB for MyBase - An IaaS Relational Database
Alibaba Cloud Native - November 6, 2024
Alibaba Cloud Native - May 20, 2024
Alibaba Cloud Native - August 20, 2024
5544031433091282 - October 8, 2023
OpenAnolis - September 21, 2022
Alibaba Cloud Native Community - December 29, 2023
 Quick BI
A new generation of business Intelligence services on the cloud
Learn More Managed Service for Grafana
Managed Service for Grafana displays a large amount of data in real time to provide an overview of business and O&M monitoring.
Learn More Cloud Migration Solution
Secure and easy solutions for moving you workloads to the cloud
Learn More Cloud Data Transfer
Unified billing for Internet data transfers and cross-region data transfers
Learn MoreMore Posts by H Ohara