By Zhixin Huo
As the main operating system in the AI era, Kubernetes carries the vast majority of LLM training and inference workloads. The popularity of these LLM workloads has driven growing demand for refined performance detection and tuning in AI training and inference. This raises a critical question: How can we conduct refined profiling on an online AI workload to identify online issues and optimize performance?
Based on eBPF and dynamic process injection, ACK AI Profiling can analyze the performance of AI applications in Kubernetes without user intrusion, or service interruption, and the overhead is low. It provides data collection capabilities across five dimensions: Python processes, CPU utilization, system calls, CUDA libraries, and CUDA kernel functions. By analyzing the collected profiling data, users can better locate the performance bottleneck in the application container, master the degree of resource utilization, and then locate the problem and optimize the performance of the application.
Starting from a general customer issue, this article describes how to troubleshoot a problem from pre-troubleshooting to in-depth analysis using AI Profiling, culminating in problem resolution and business execution analysis. This way, it shows a detailed analysis process from black box to transparency.
An inference service that uses vLLM to deploy large models is configured with the parameter --gpu-memory-utilization 0.95, which occupies 95% of the GPU memory in advance when the inference service starts. After sustained operation, the inference service experiences an OOM error.
This inference service is monitored in the test environment. Multiple stress tests reveal a consistent increase in GPU memory usage when processing requests. This observation raises three critical questions:
In the test environment, we deploy the QwQ-32B model to reproduce the problem scenario and troubleshoot it.
Model: QwQ-32B
GPU: NVIDIA L20 * 2
Parameter: --gpu-memory-utilization 0.95
(By setting this parameter, vLLM occupies the specified proportion of GPU memory in advance to ensure that sufficient KV Cache space is available when processing requests. This reduces latency in dynamic memory allocation and avoids memory fragmentation caused by real-time allocation.)
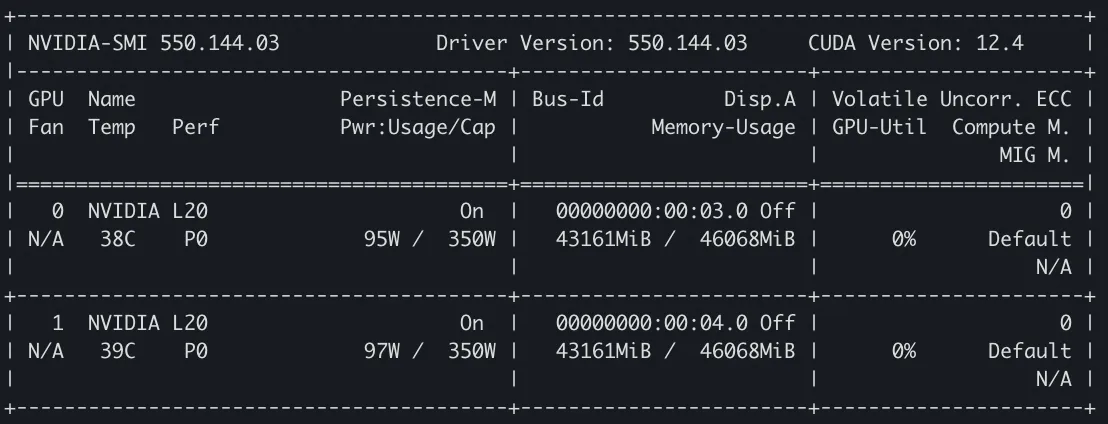
First, reproduce the scenario and observe the GPU memory usage. Restart the inference service, and submit an inference request to simulate the scenario. When the vLLM inference service is started, the memory usage is observed by nvidia-smi. It can be seen that the service requests memory for loading the model and reserving KV Cache, with each GPU occupying 43,161 MiB of memory:
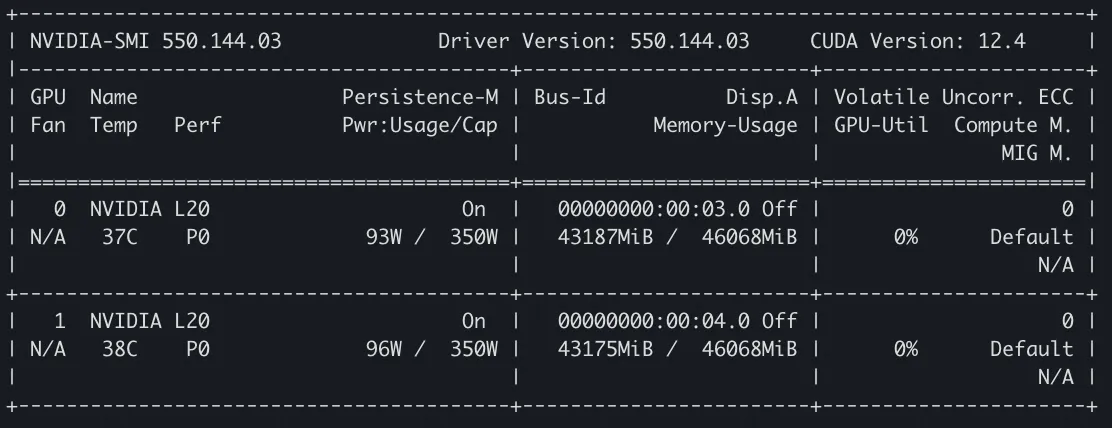
After the inference request is initiated, we again monitor the GPU memory usage via nvidia-smi. The memory allocation on both GPUs increases by 26 MiB and 14 MiB respectively compared with that when the service is started:
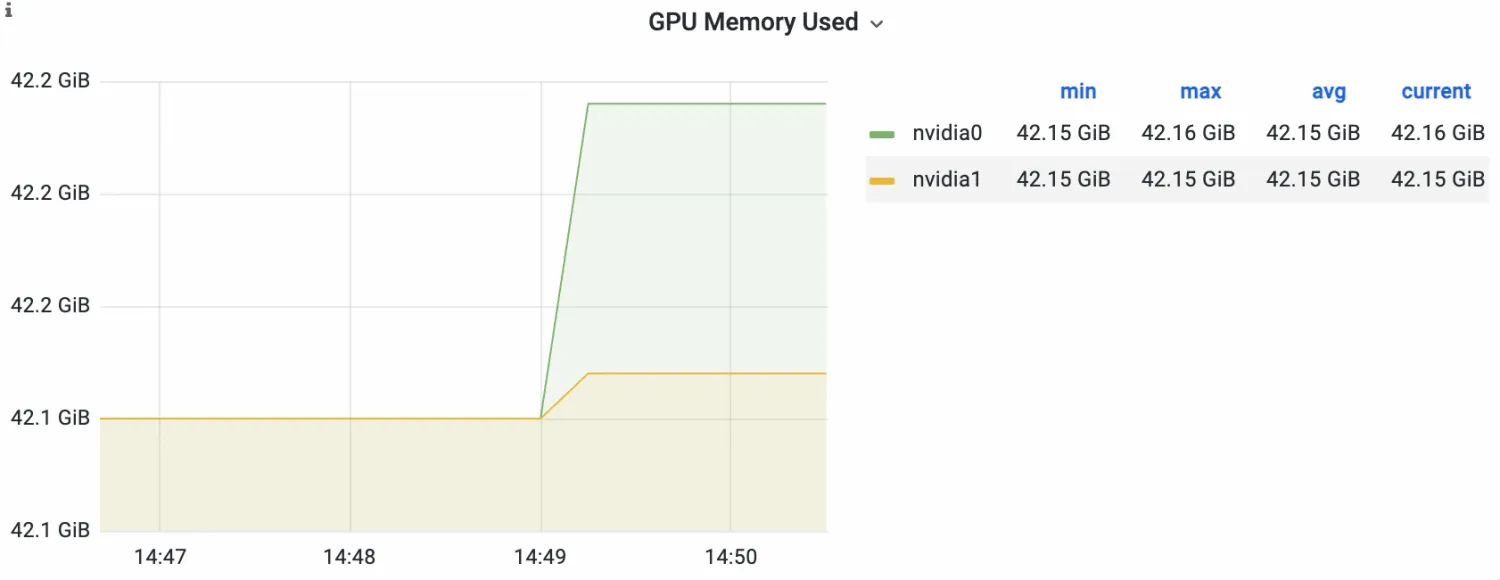
Then, observe the DCGM-based GPU monitoring. On the monitoring dashboard, we can see that the inference service has a significant increase in memory after receiving the request, and the growth value is consistent with the phenomenon observed in the above nvidia-smi. After maintaining an extended observation period, we find that this part of the occupied memory has not been released.
Based on the observed phenomenon, it is doubted whether the memory request is caused by an overfilled KV Cache. The following figure shows the log of KV Cache utilization during inference request processing. The low utilization rate (consistently within 10%) indicates that there is no extra memory occupation due to insufficient memory of KV Cache.

Refer to the AI Profiling Process User Guide on the official website of ACK AI Profiling to perform AI Profiling on the running vLLM inference service. Configure the Profiling items to Python, CPU, and CUDA Kernel, and use SysOM to display and view the results. Here, we conduct profiling on a complete inference request.
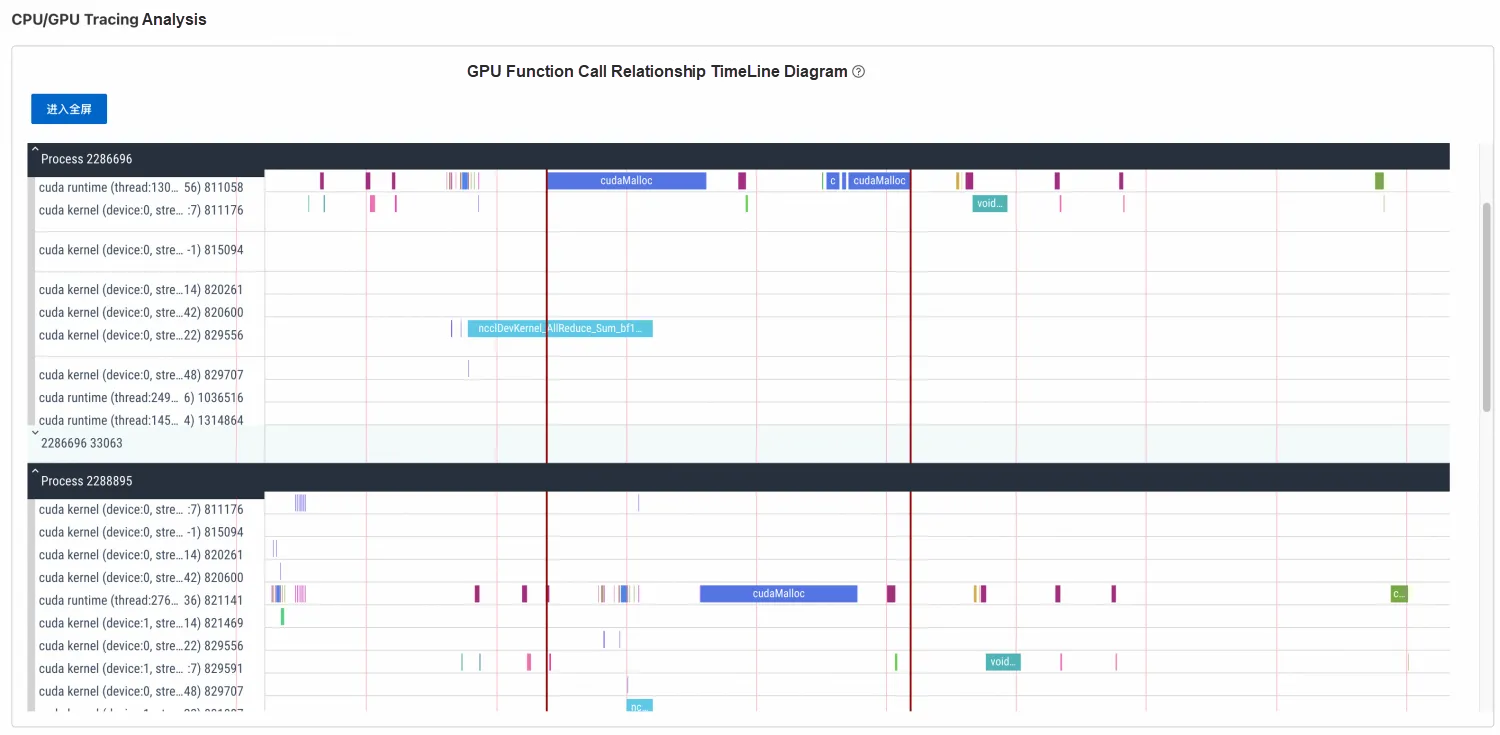
Throughout the inference process, by observing the TimeLine of the CUDA Kernel, we can identify the cudaMalloc operation on each GPU. Check the details to find the number of bytes of the specific memory request. After calculation, the value aligns closely with the memory increase observed from the monitoring. Therefore, it can be confirmed that this is the source that triggers the memory increase.

Use the annotation line to mark the cudaMalloc time segment on the TimeLine, as shown in the following figure:
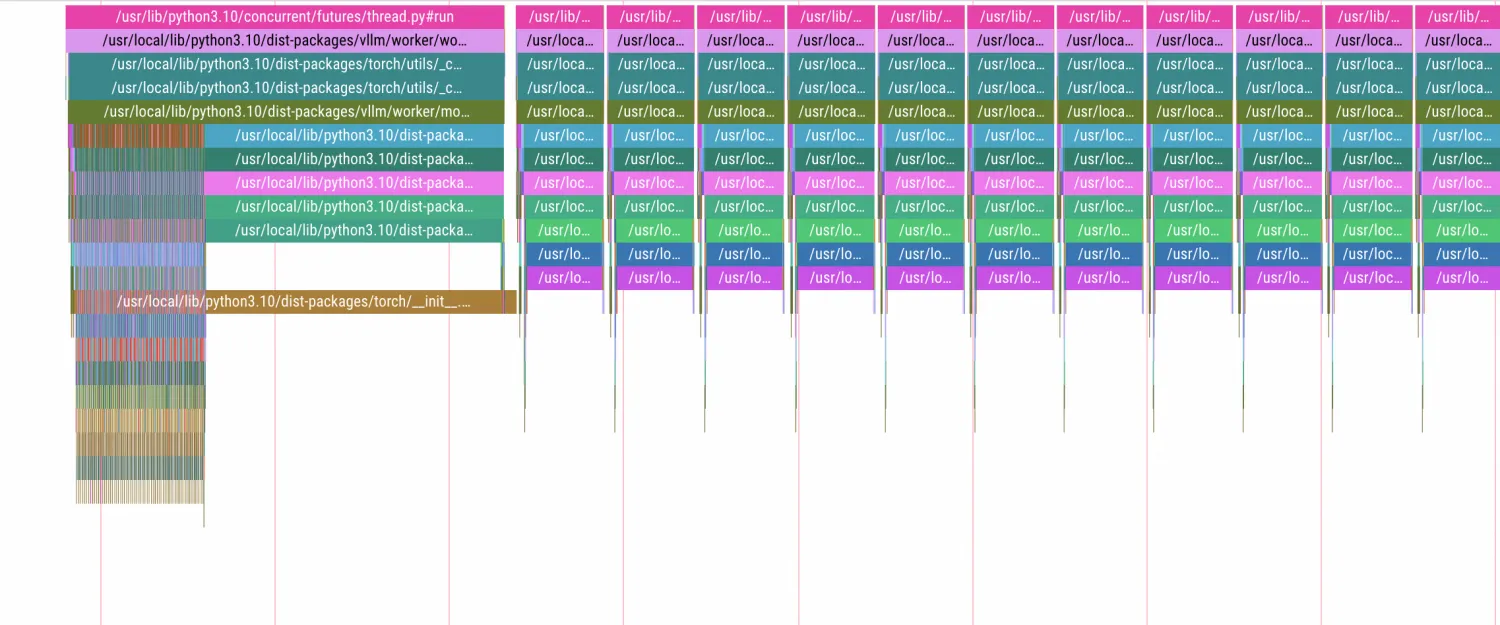
Depending on the location of the annotation line, navigate to the TimeLine section of Python. Zoom in on the corresponding annotated part on TimeLine and analyze the two processes distributed across two GPUs respectively, as shown in the following figure.
GPU 0: Process 1

GPU 1: Process 2

The details of Python's call stack can be clearly seen. During the memory request period, Python's method stack is thread.run() -> llm_engine.step() -> worker.execute_model() -> model_runner.execute_model() -> decorate_context(). Notably, the decorate_context method is the basic method in the Pytorch library. Further analysis of decorate_context() in PyTorch's source code reveals that it finally executes the with ctx_factory() call.
def decorate_context(*args, **kwargs):
with ctx_factory():
return func(*args, **kwargs)
ctx_factory() is the context manager of PyTorch. It is used to manage GPU resources, monitor performance, and handle exceptions. Since vLLM's memory request has ended during the startup of the inference service, the additional memory request here is triggered during inference request processing. Therefore, it can be concluded that this phenomenon is related to Pytorch.
Based on the management details of Pytorch's memory cache (not repeated here), we can draw a conclusion related to Pytorch's memory cache management mechanism: the increased GPU memory in the inference process stems from Pytorch's memory cache mechanism reserving a certain amount of memory. The memory usage value displayed by nvidia-smi represents the sum of the reserved_memory and torch context memory. In the inference process, although this reserved memory will not be actively released, as the number of cache blocks increases, a large number of new requests will use the existing idle blocks, and the growth rate will become slower and eventually reach a steady state. Therefore, this phenomenon is normal. We need to allocate sufficient memory request space for PyTorch to avoid CUDA OOM errors.
According to the conclusion, we propose several corresponding suggestions to reduce the demand for memory or release memory. For example:
Minimize memory fragmentation: When enough memory remains but continuous allocation fails, you can reduce the impact of memory fragmentation by using the environment variable CUDA_PYTORCH_CUDA_ALLOC_CONF to adjust the max_split_size_mb parameter.
Try other optimization strategies: In addition to adjusting max_split_size_mb, you can also consider other optimization strategies to reduce memory fragmentation, such as using memory cleanup tools like torch.cuda.empty_cache() or adjusting the model and data loading strategies.
You can also obtain more information from the profiling results by referring to the preceding troubleshooting procedure. This section briefly presents an overview of the profiling data for a complete inference cycle, outlining its key steps.
By examining the TimeLine overview after receiving an inference request, you can see the main steps of the entire inference process in the following TimeLine of Python Profiling: input preprocessing -> model forward calculation step -> result generation and return. For details of each method call, you can zoom in to specific segments. No additional description here.
Then, combined with the following TimeLine observation of the CUDA Kernel, we can see the preprocessing phase corresponding to the above Python call and the subsequent vLLM calculation step, which includes the specific GEMM operations and the cuMemcpyDtoH memory transmission call returned by the data result. Because it is an inference service deployed by two GPUs, there are also specific operations (kernels such as broadcast, allreduce, and sendRecv) that use NCCL to perform data transmission between GPUs in steps.

After each calculation step is completed, we will find a brief idle period during which no kernel operation is executed on the GPU. Upon zooming in for detailed inspection, we can find that this period mainly includes the response to HTTP requests and the calculation and reporting of service metrics, as shown in the following figure.

Finally, looking at the GPU kernel function calculation statistics chart, we can observe that the calls are primarily concentrated in the first three methods:
std::enable_if::type internal::gemvx::kernel
vllm::paged_attention_v2_kernel
ncclDevKernel_AllReduce_Sum_bf16_RING_LL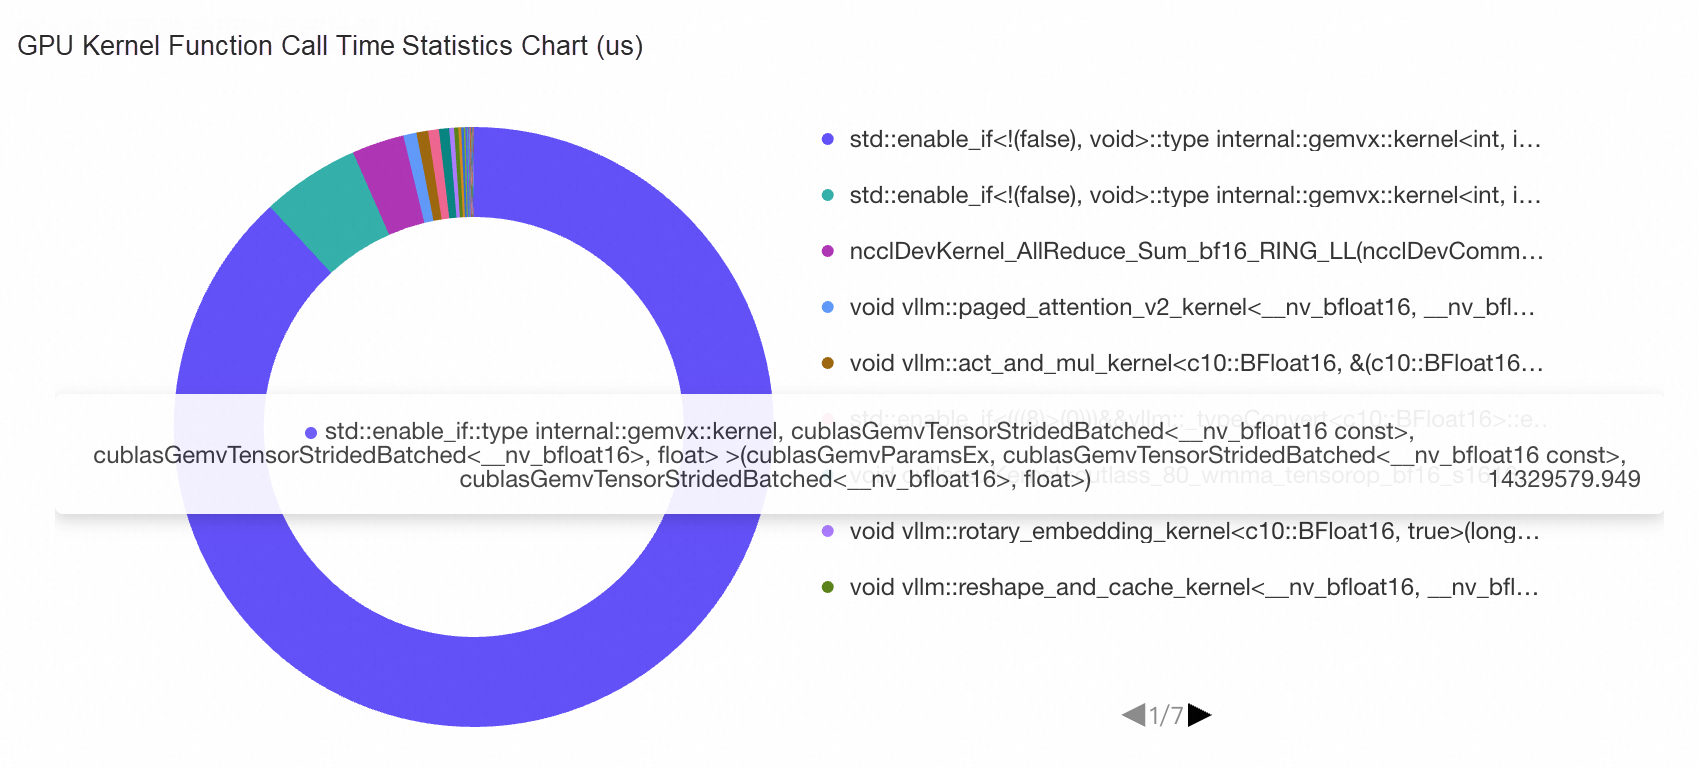
It can be seen that the majority of GPU calculation time is dedicated to gemvx matrix operations, which constitute specific inference operations. There are some paged_attention methods implemented in the vLLM framework, along with ncclDevKernel_AllReduce communication operations required when the multi-GPU inference service is deployed. This statistical chart can clearly analyze the busyness of the GPU and the time proportion of specific operations, enabling effective bottleneck analysis. For example, excessive time consumption by ncclDevKernel indicates that GPU communication is the part that can be optimized, with similar diagnostic principles applying to other patterns.
ACK AI Profiling capabilities provide more possibilities and options for fine-grained analysis of online applications. By combining the collected metric data with business details, we can locate problems and analyze performance in detail, thus bringing greater value to the observability of AI Infra.
StrmVol Volumes: Boosting Kubernetes Object Storage Performance for Small Files

229 posts | 34 followers
FollowAlibaba Container Service - November 15, 2024
Alibaba Cloud Native - September 12, 2024
Alibaba Cloud Native - November 29, 2023
Alibaba Cloud Community - February 11, 2022
Alibaba Cloud Native - July 29, 2024
Alibaba Cloud Native Community - January 20, 2026

229 posts | 34 followers
Follow Container Compute Service (ACS)
A cloud computing service that provides container compute resources that comply with the container specifications of Kubernetes
Learn More Container Service for Kubernetes
Alibaba Cloud Container Service for Kubernetes is a fully managed cloud container management service that supports native Kubernetes and integrates with other Alibaba Cloud products.
Learn More ACK One
Provides a control plane to allow users to manage Kubernetes clusters that run based on different infrastructure resources
Learn More Container Registry
A secure image hosting platform providing containerized image lifecycle management
Learn MoreMore Posts by Alibaba Container Service