Q Chat lets dashboard viewers ask data questions in natural language and get instant answers, making data analysis accessible to everyone.
Currently available only in China (Hong Kong), Malaysia (Kuala Lumpur), and Singapore. Support for other regions is being rolled out.
Limits
Dashboards embedded in third-party systems through the enhanced embedding solution do not support Q Chat.
Configure Q Chat
-
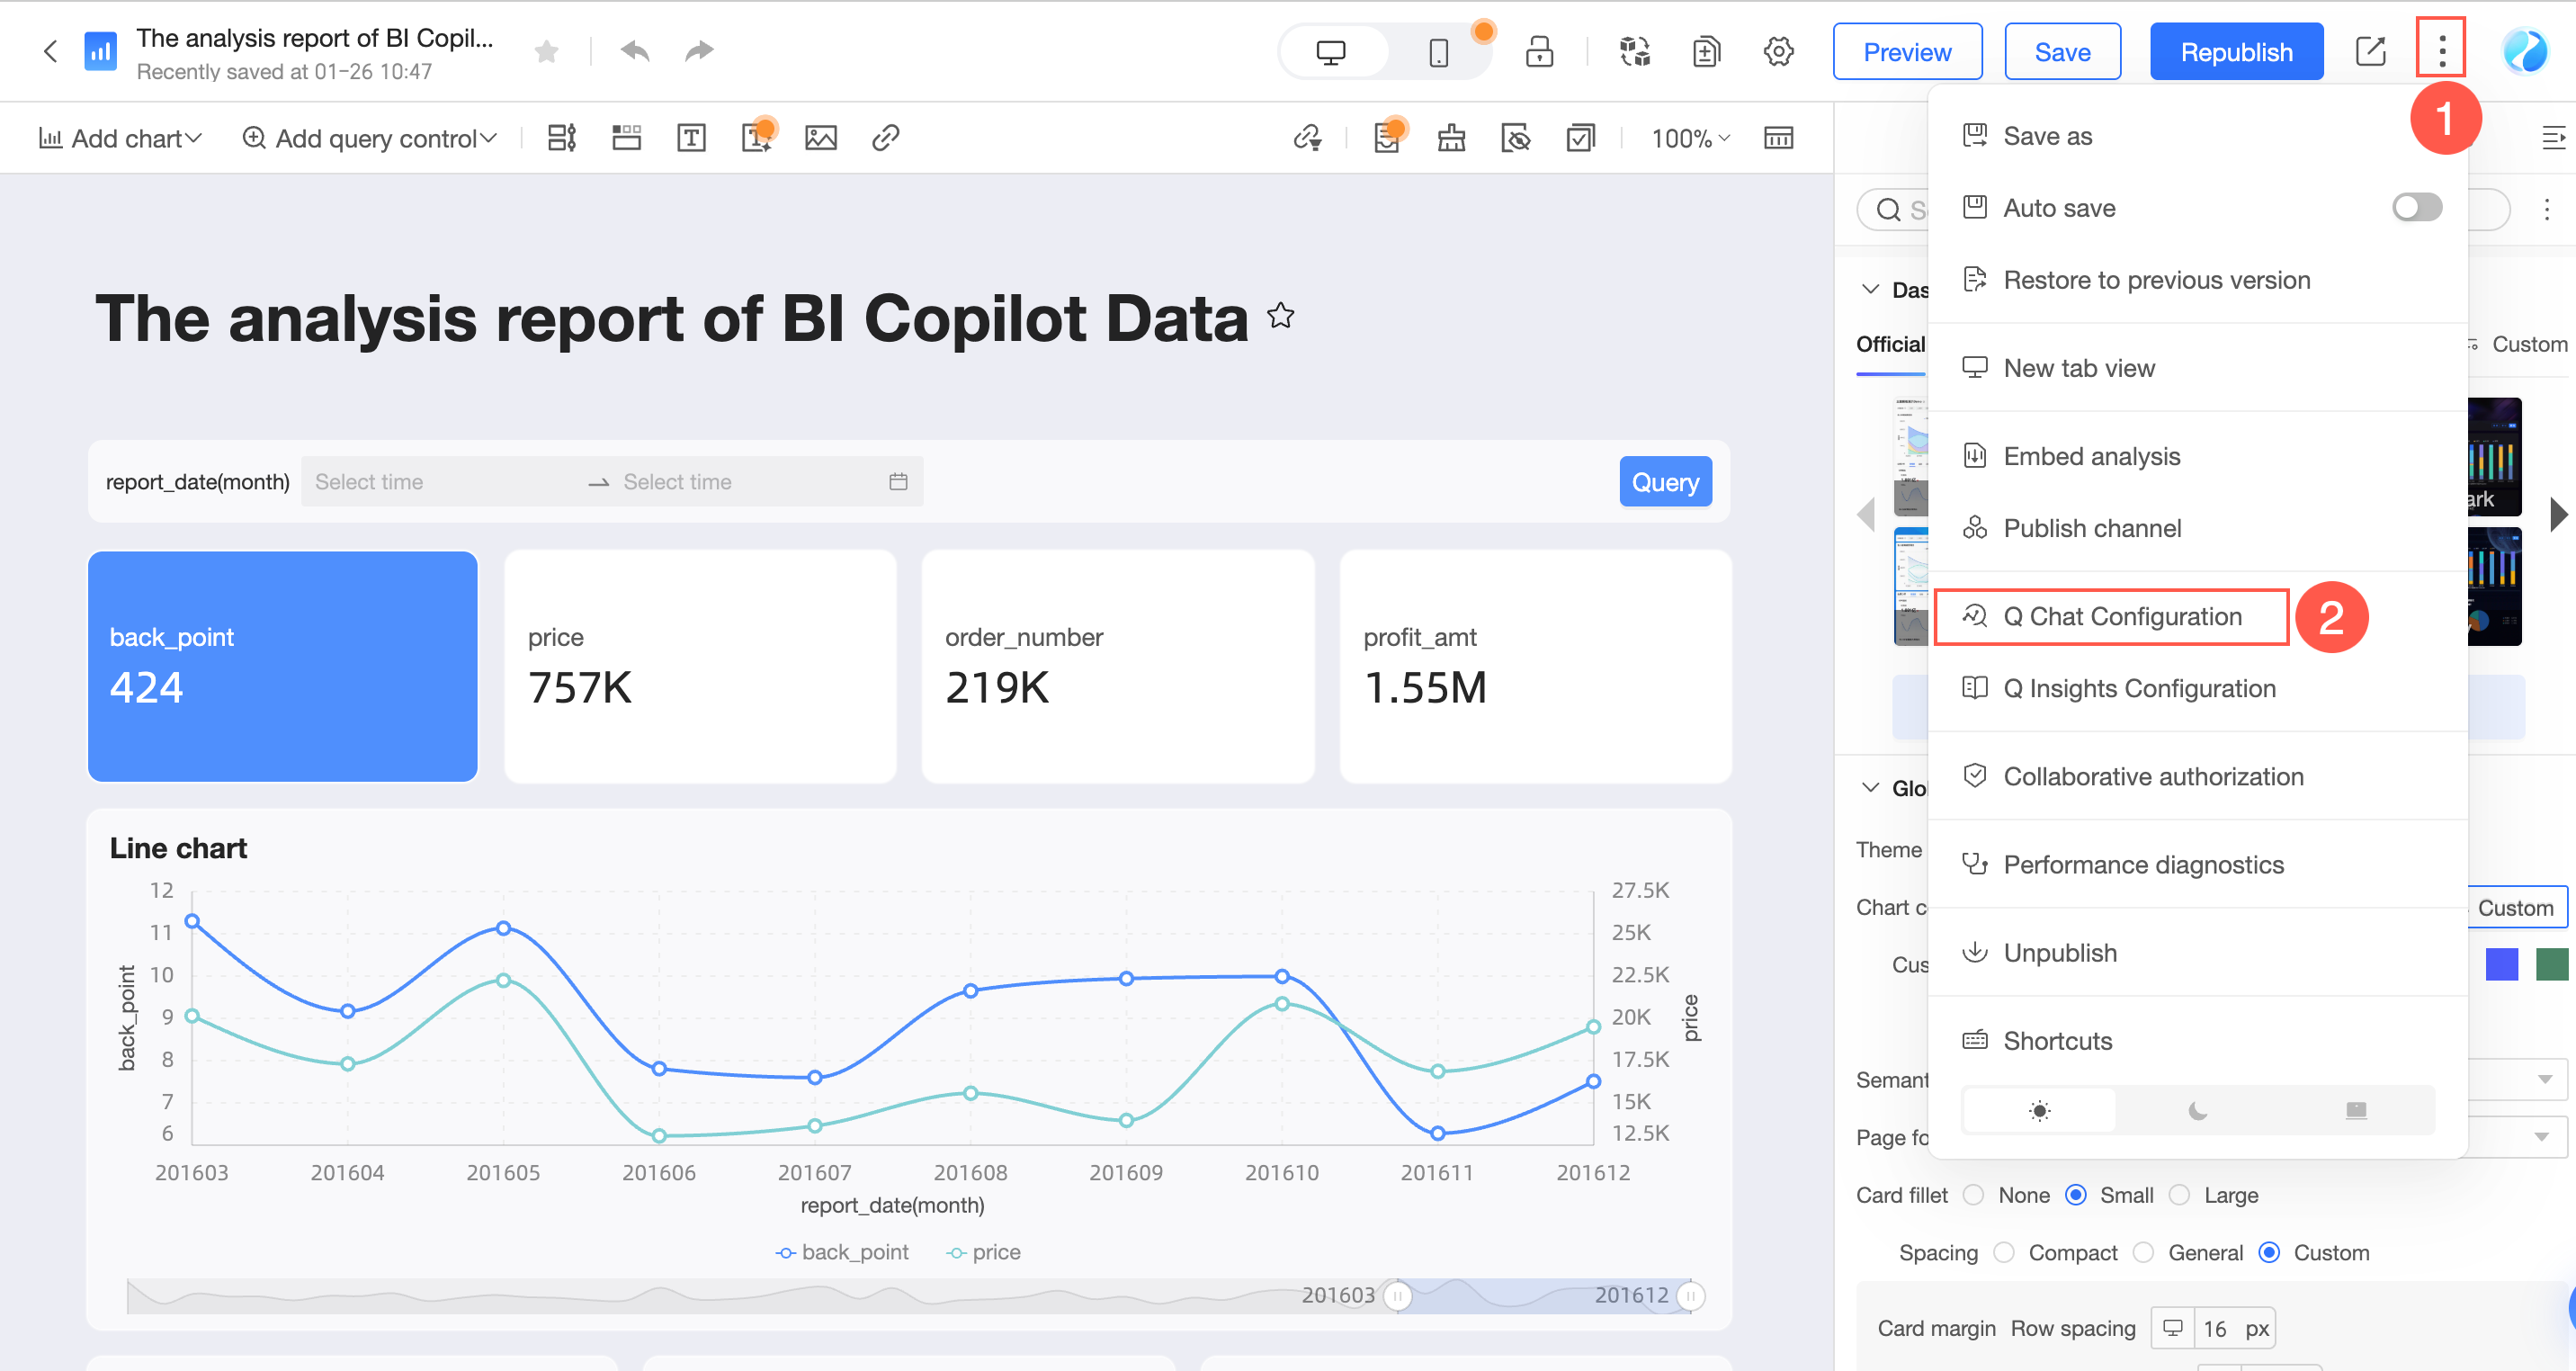
On the dashboard edit page, open the Q Chat Configuration panel as shown.
-
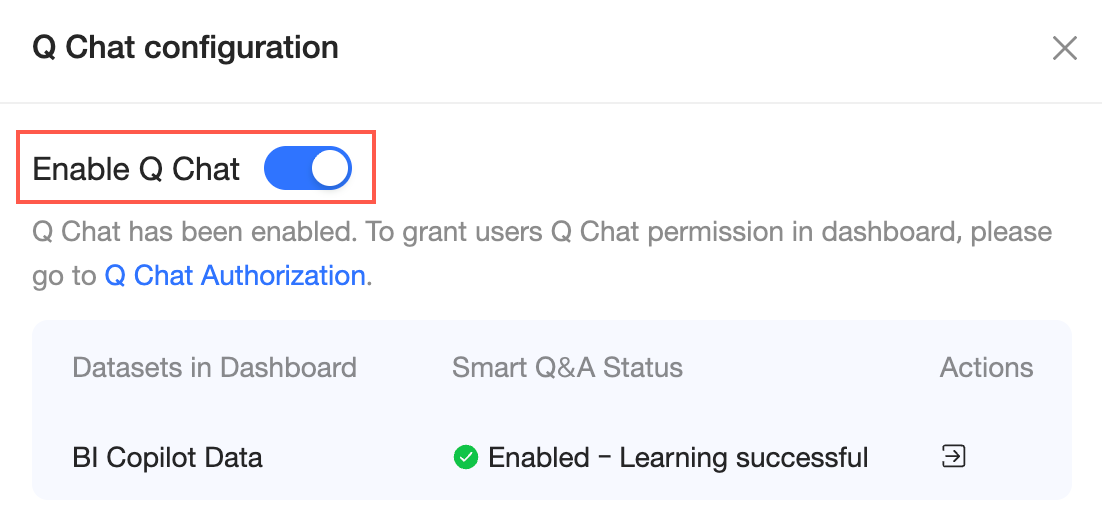
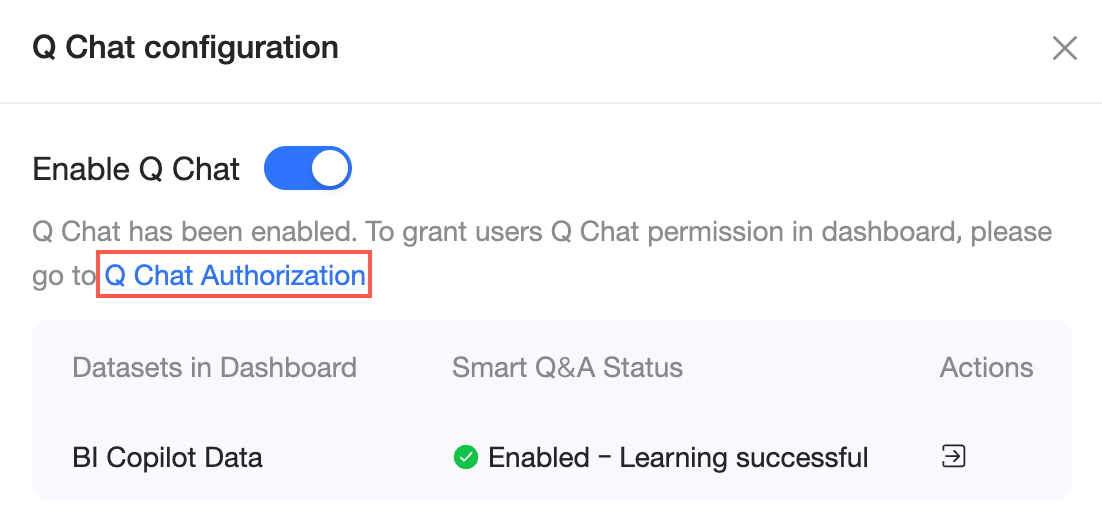
Click Enable Q Chat.
-
On the Q Chat configuration page, review the enablement and learning status for each dataset. Configure settings and permissions as needed.
Note-
Enabled datasets join the Q Chat resource pool. Users can query these datasets in natural language.
-
Disabled datasets are excluded from Q Chat. This means no user can ask questions about these datasets.
Ensure that at least one dataset is enabled.
-
Configure Q Chat and permissions for datasets
In the Operations column, click the
 icon to go to the dataset and configure Q Chat settings and permissions.
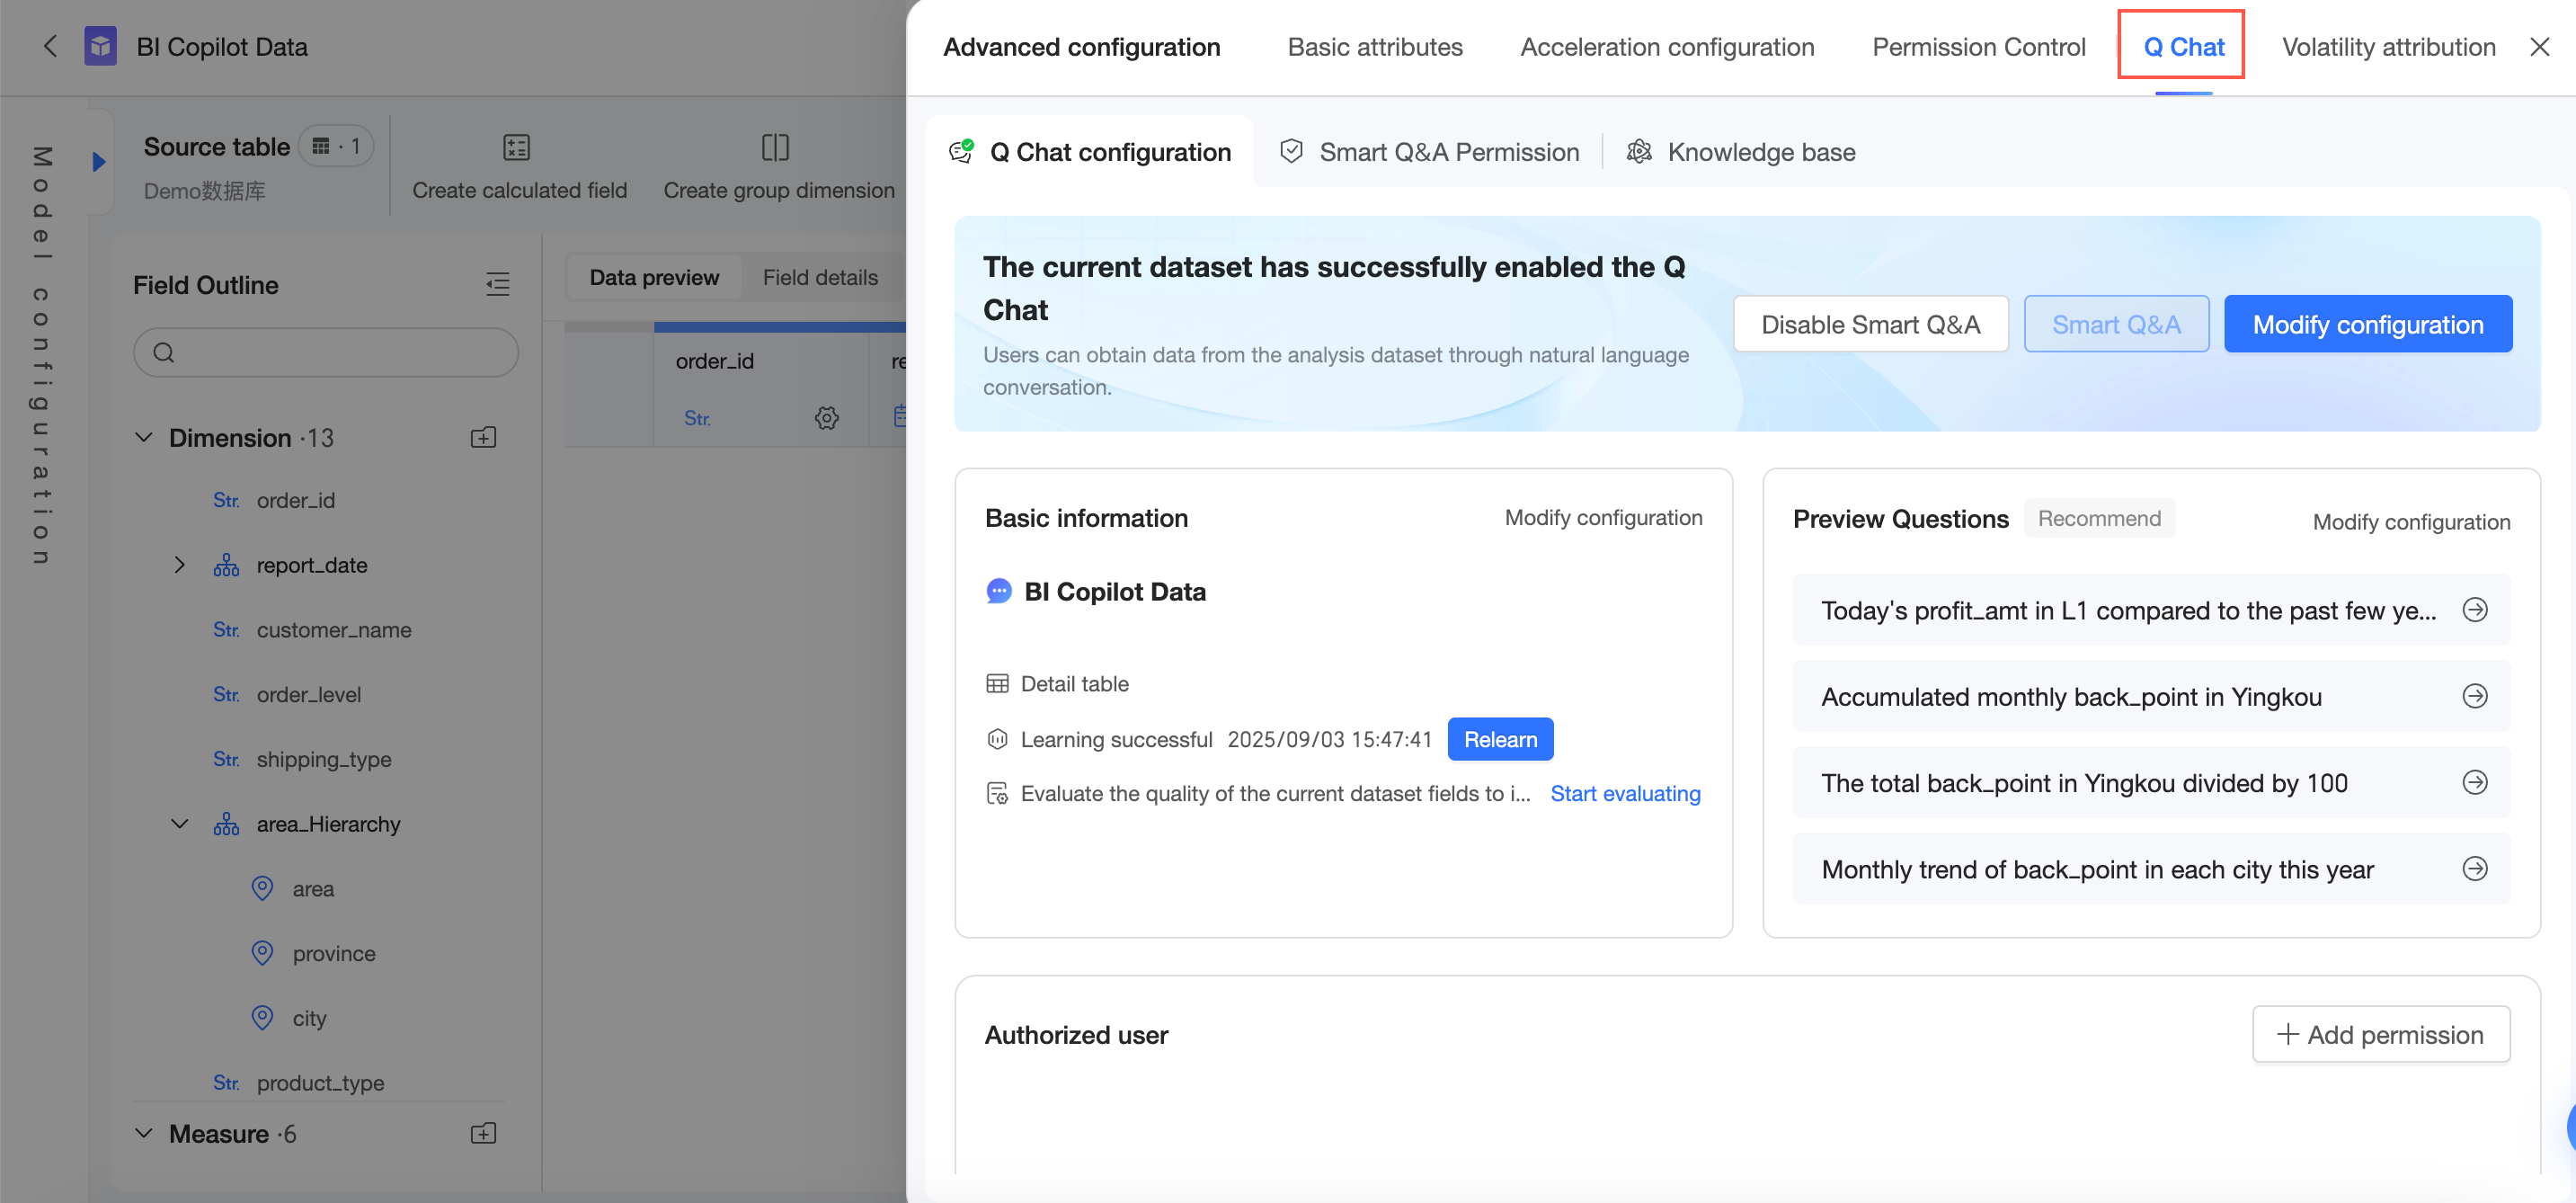
-
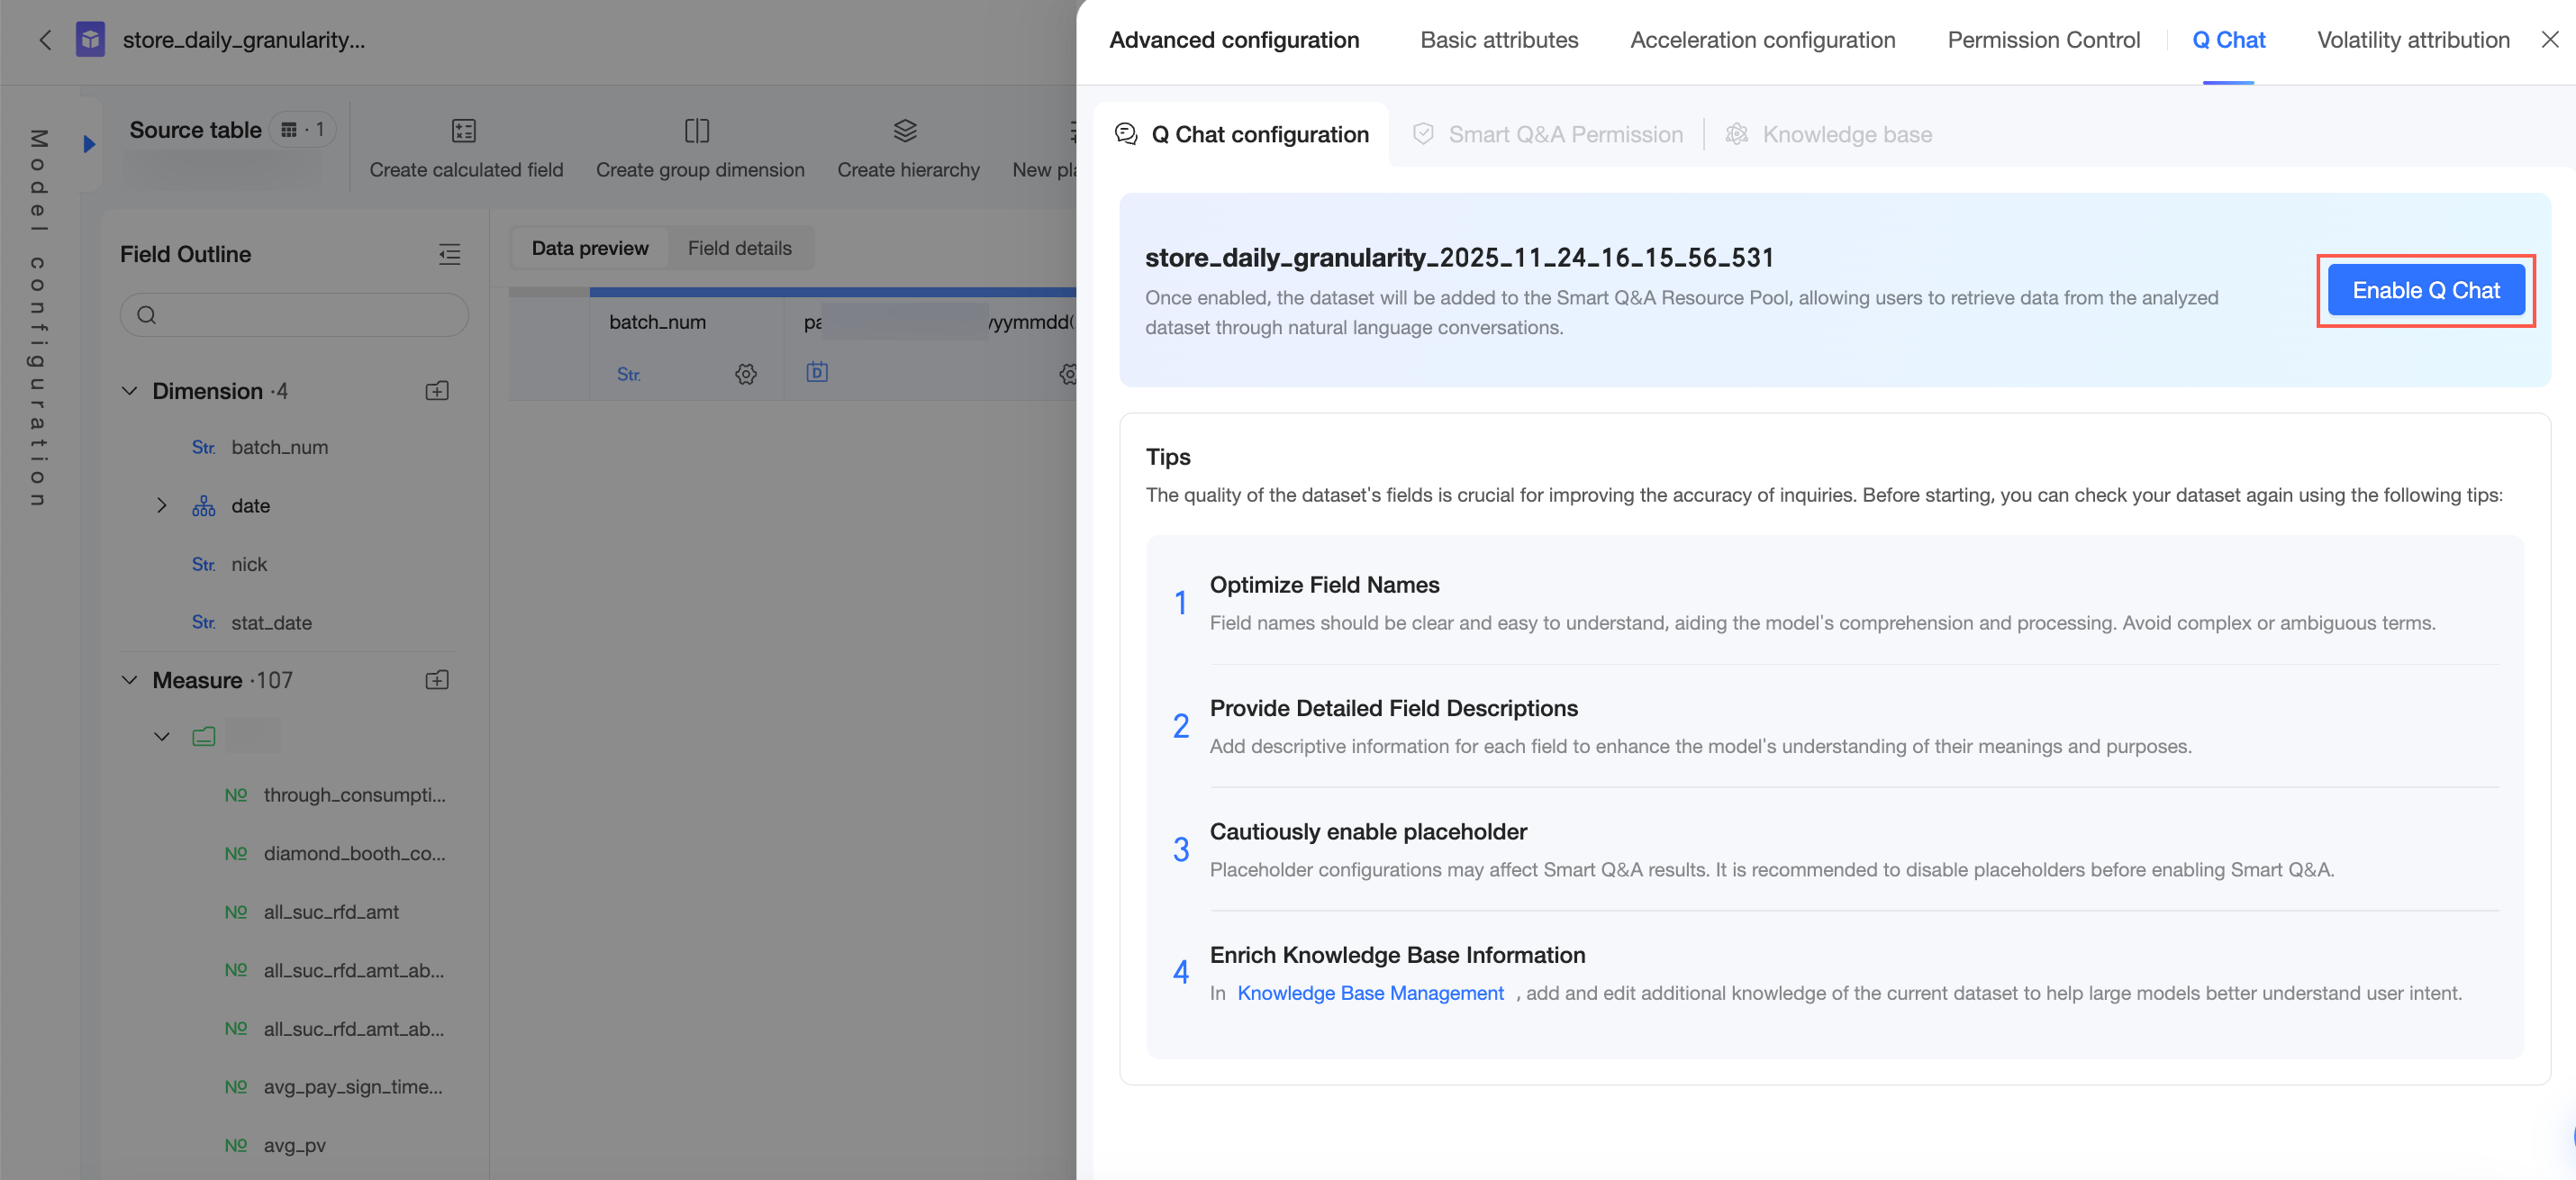
If Q Chat is not yet enabled for a dataset, click Enable Q Chat and configure the Q Chat settings. Skip this step if Q Chat is already enabled.
-
After enabling and configuring Q Chat, click Add Authorization in the Q Chat Permissions section.
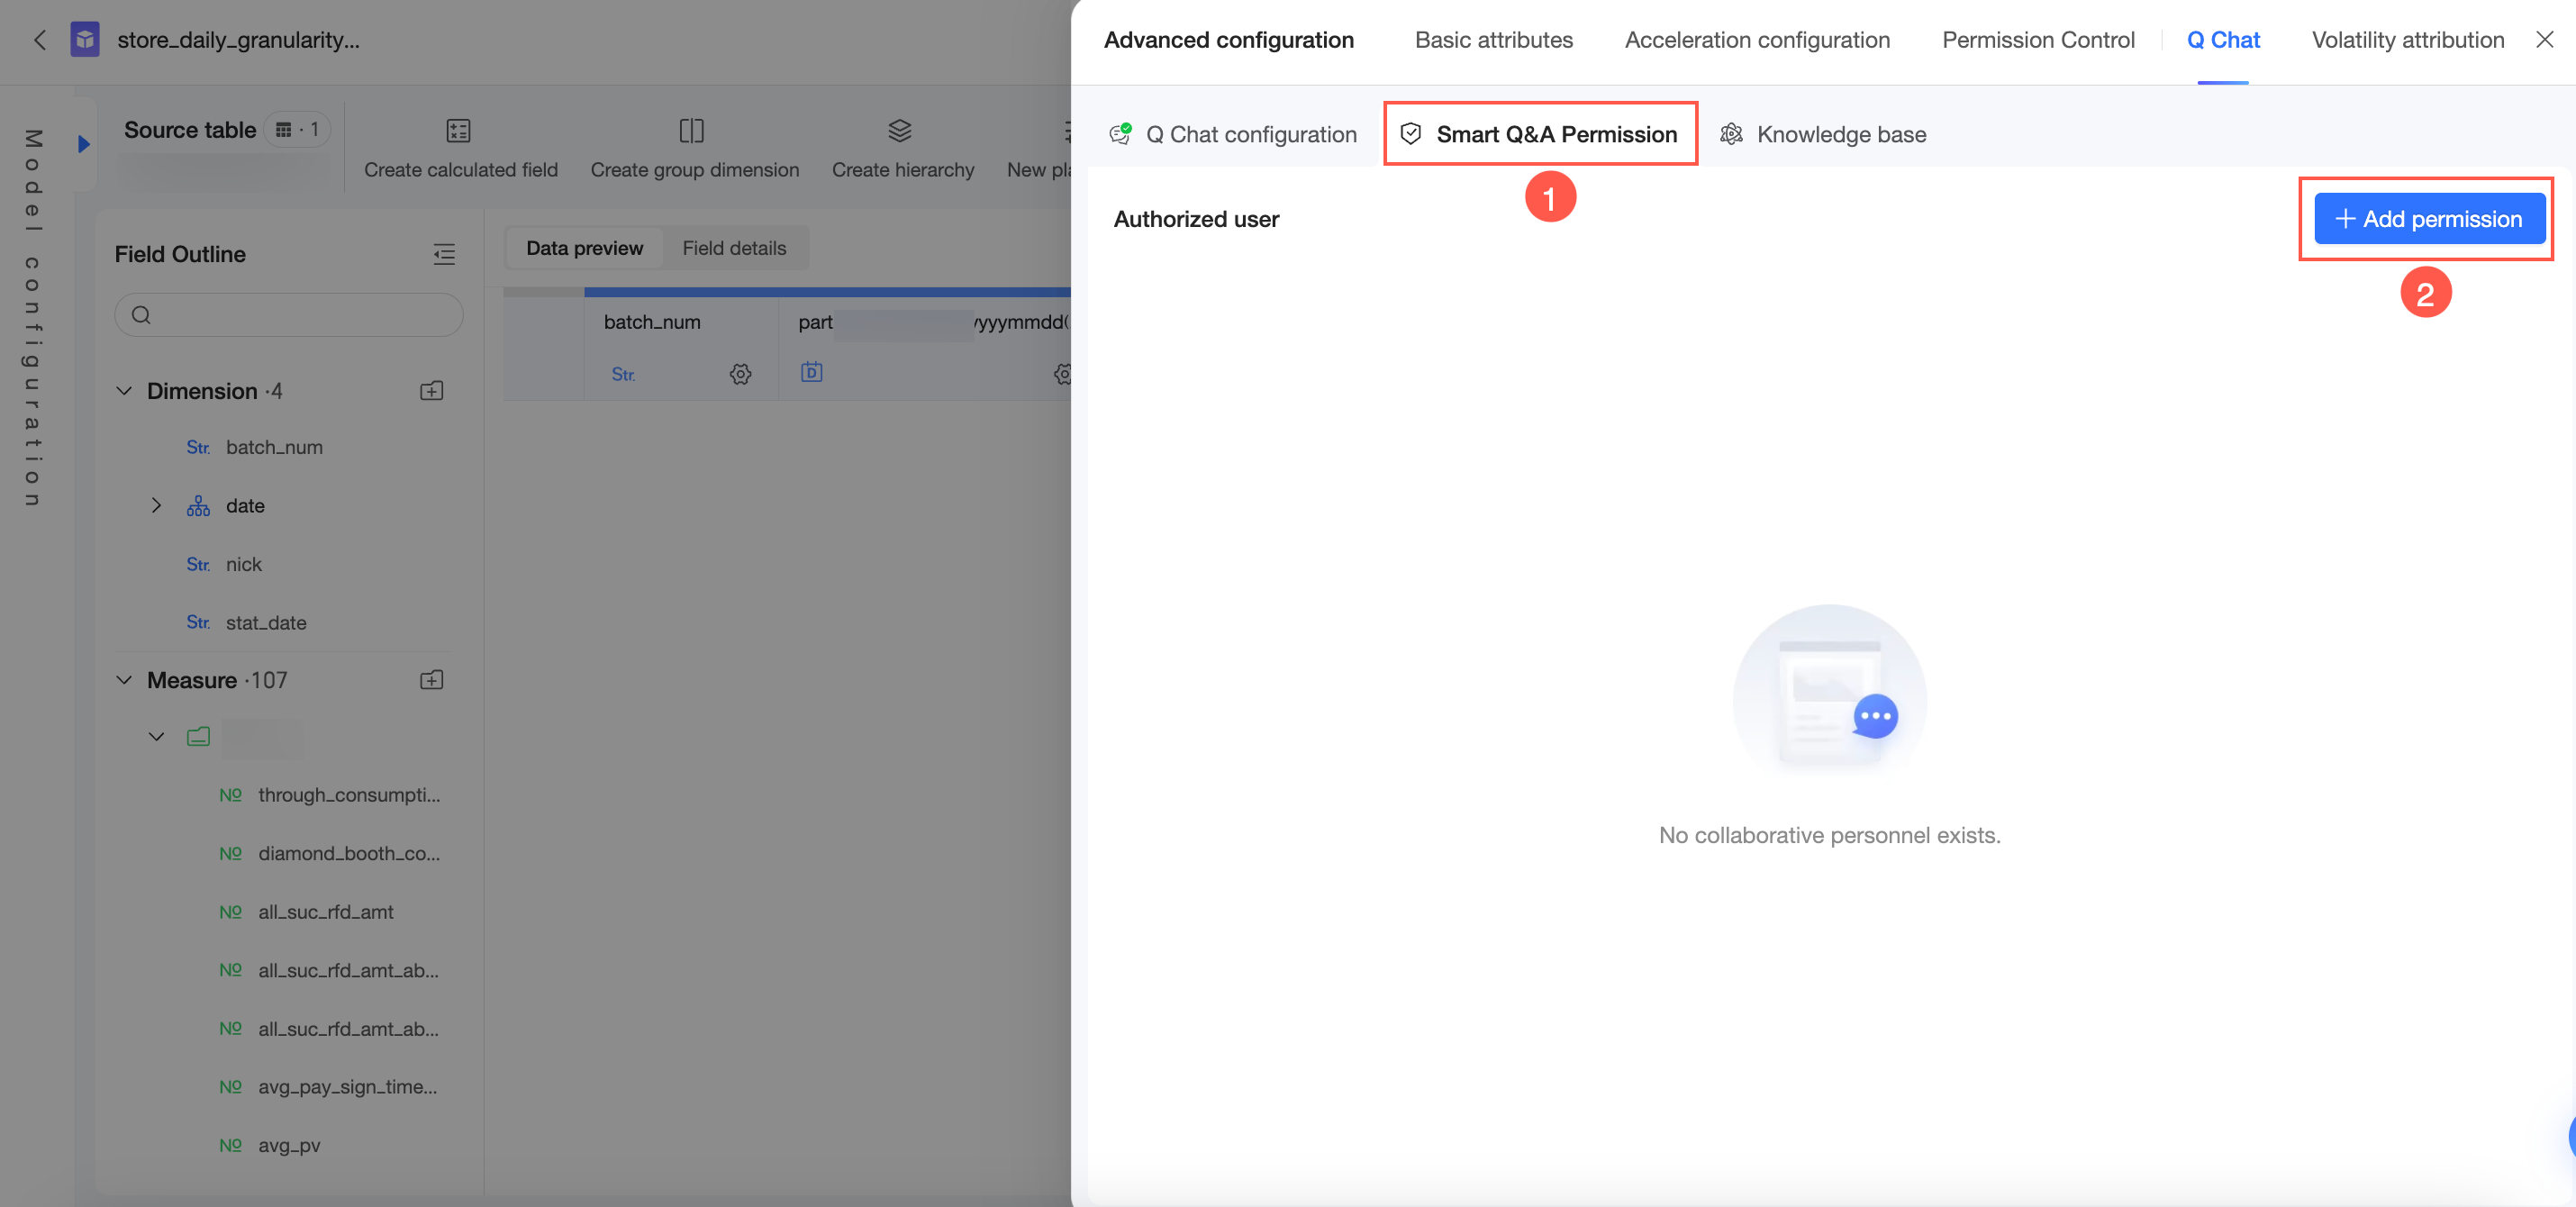
-
Select the users and set an expiration date.
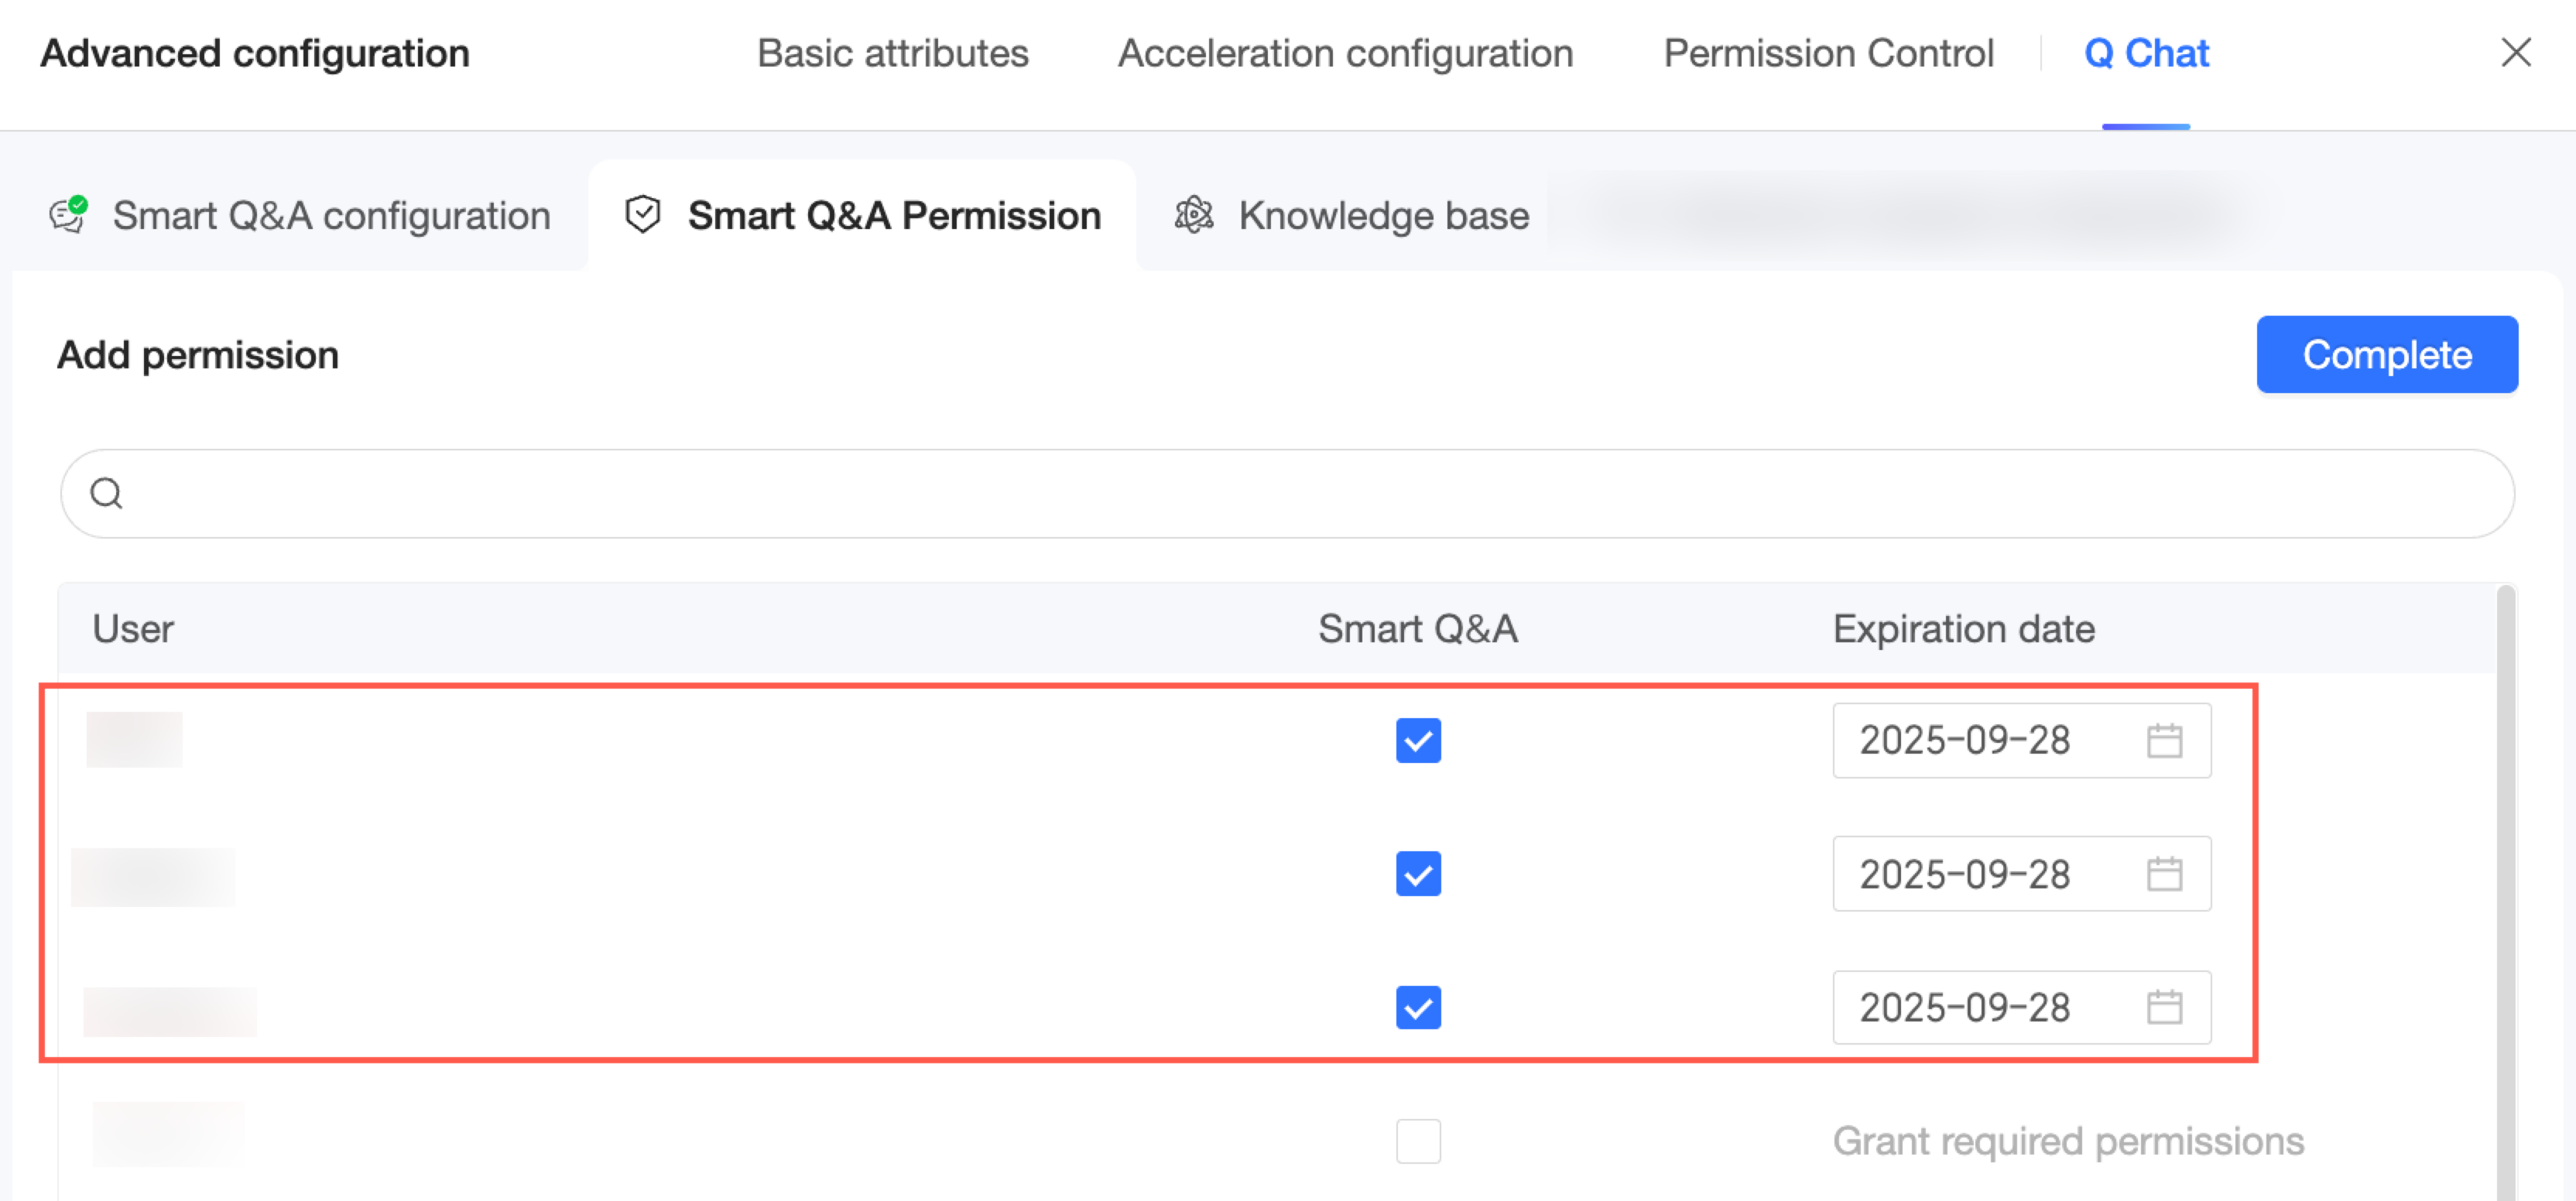
-
Click Done. You can then view and manage authorized users for this dataset.
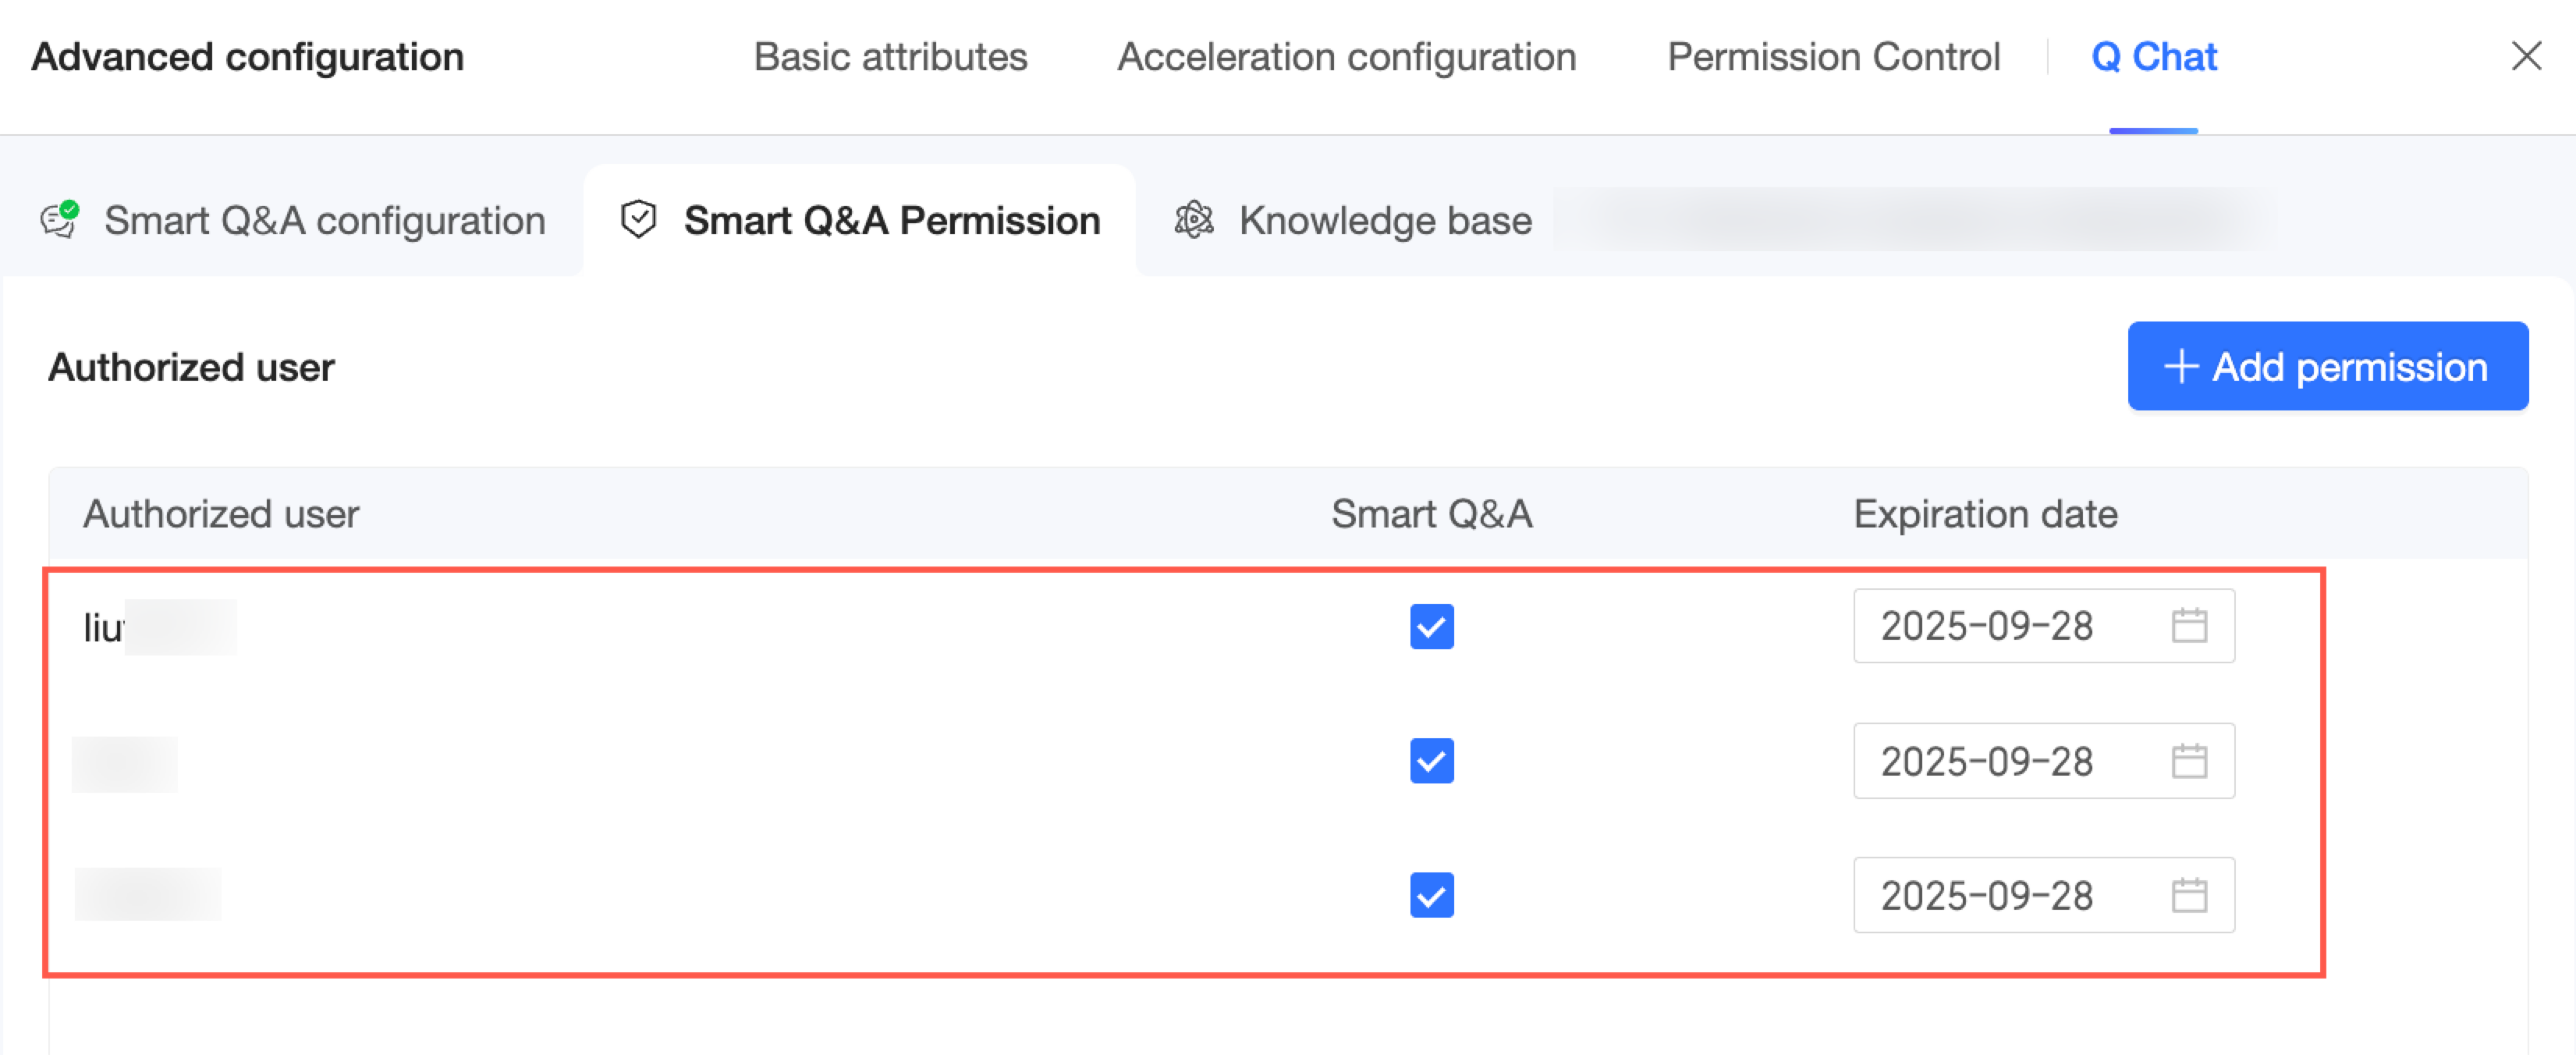
-
-
Manage Q Chat permissions for the dashboard
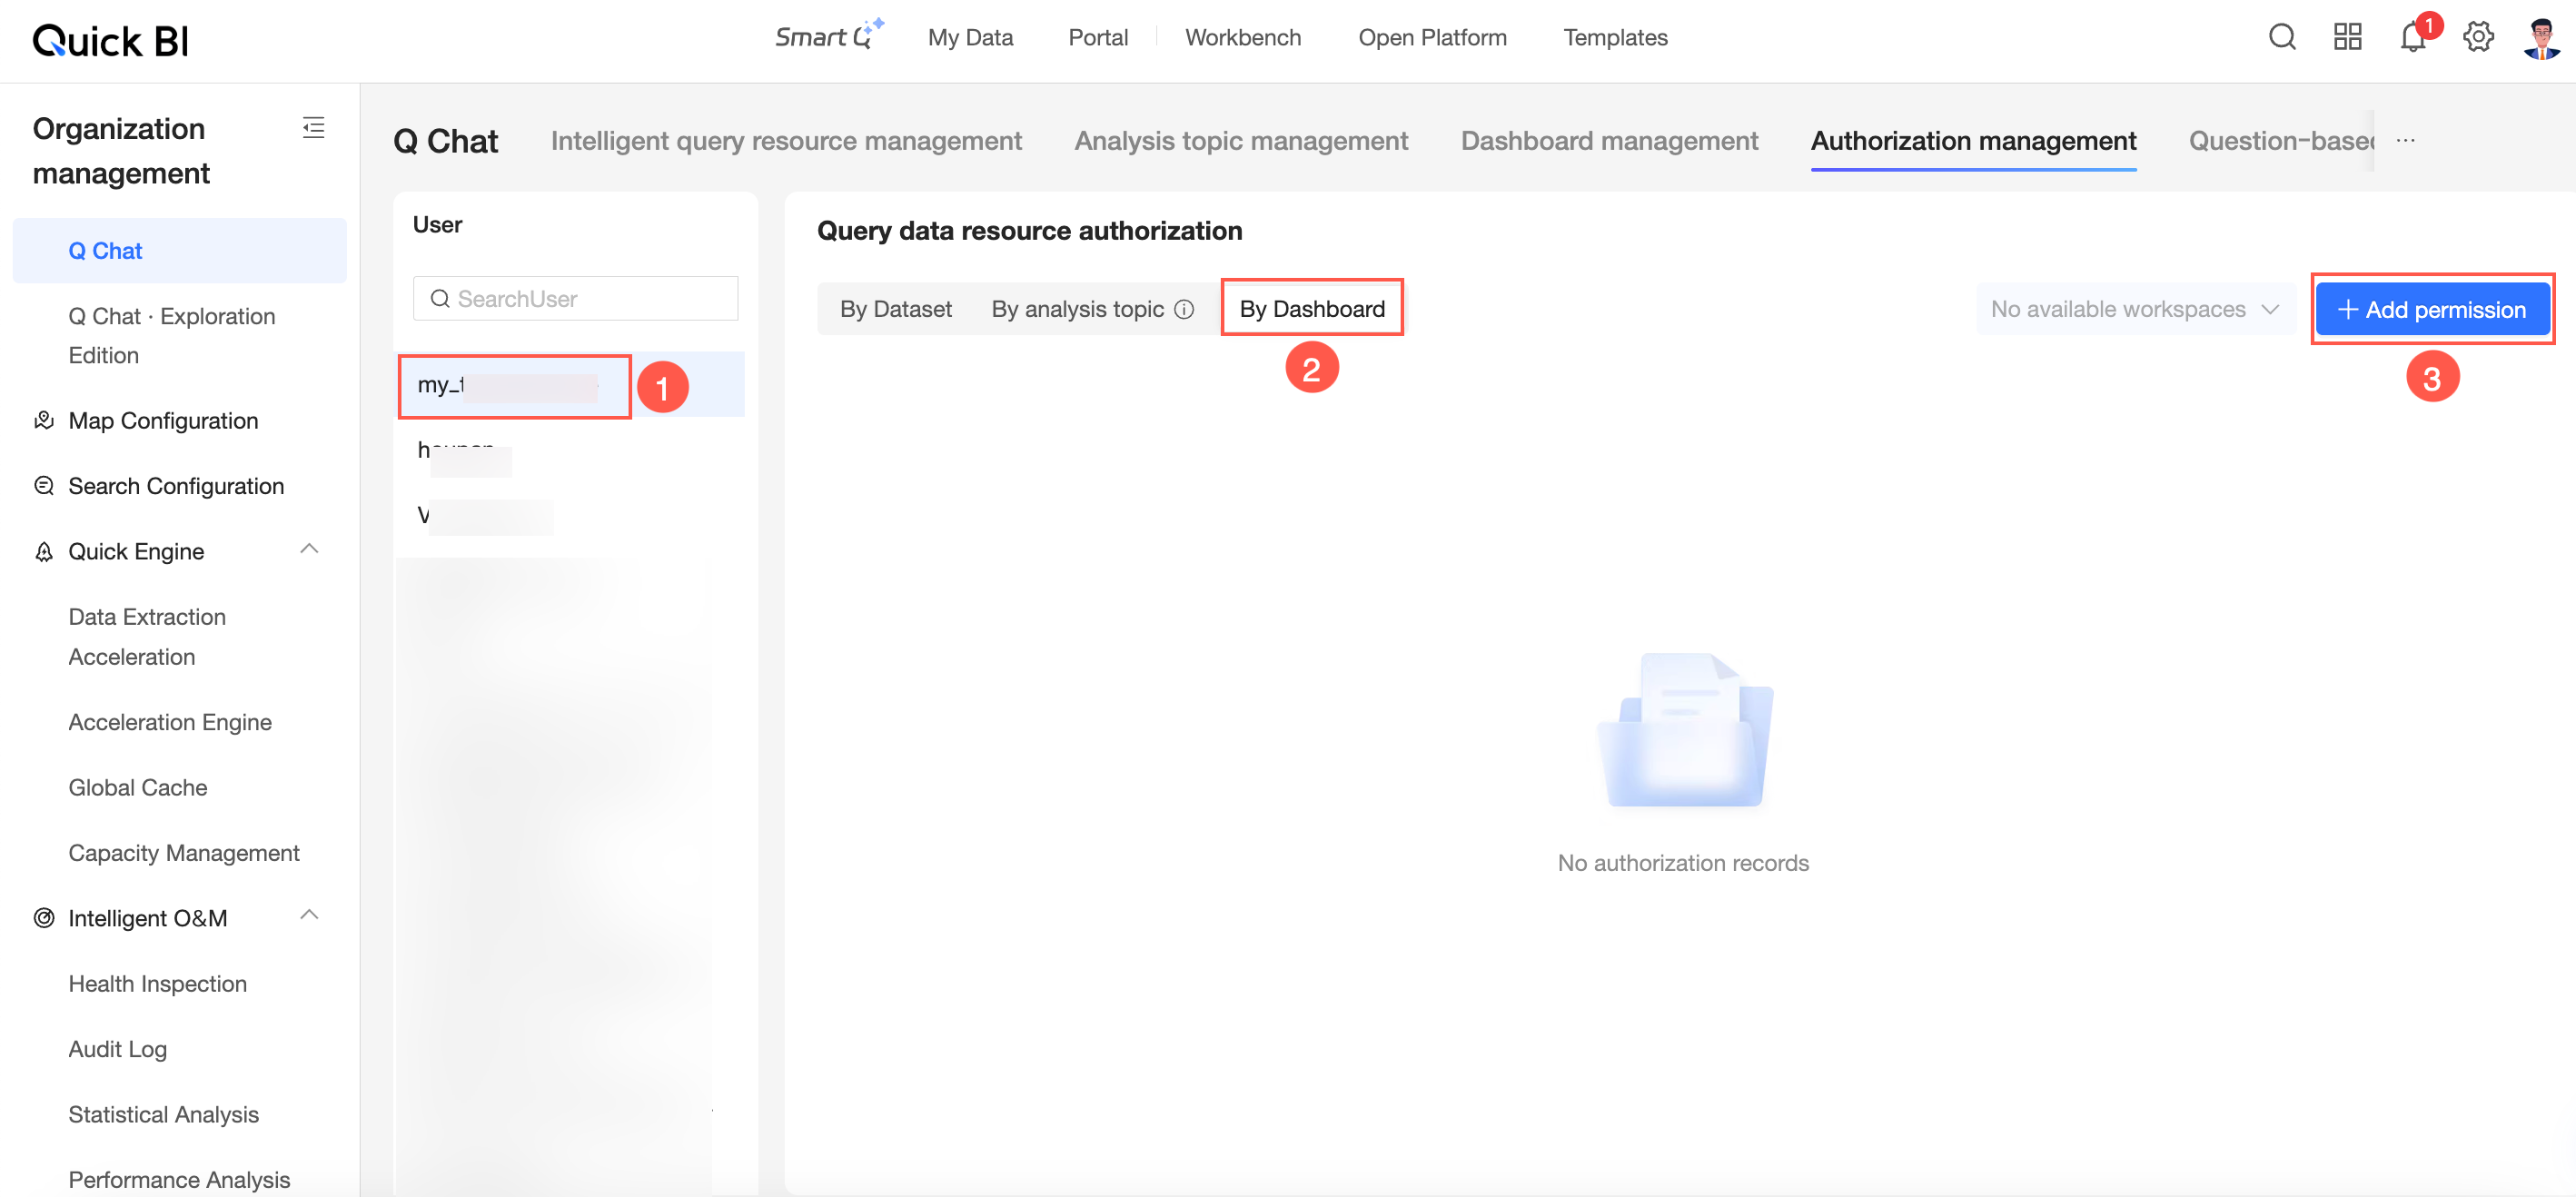
On the Q Chat configuration page, click Quick BI Q Chat Permission Management to grant users Q Chat permissions as needed.
-
On the permission management page, select a user. On the By Dashboard tab, click Add Authorization.
-
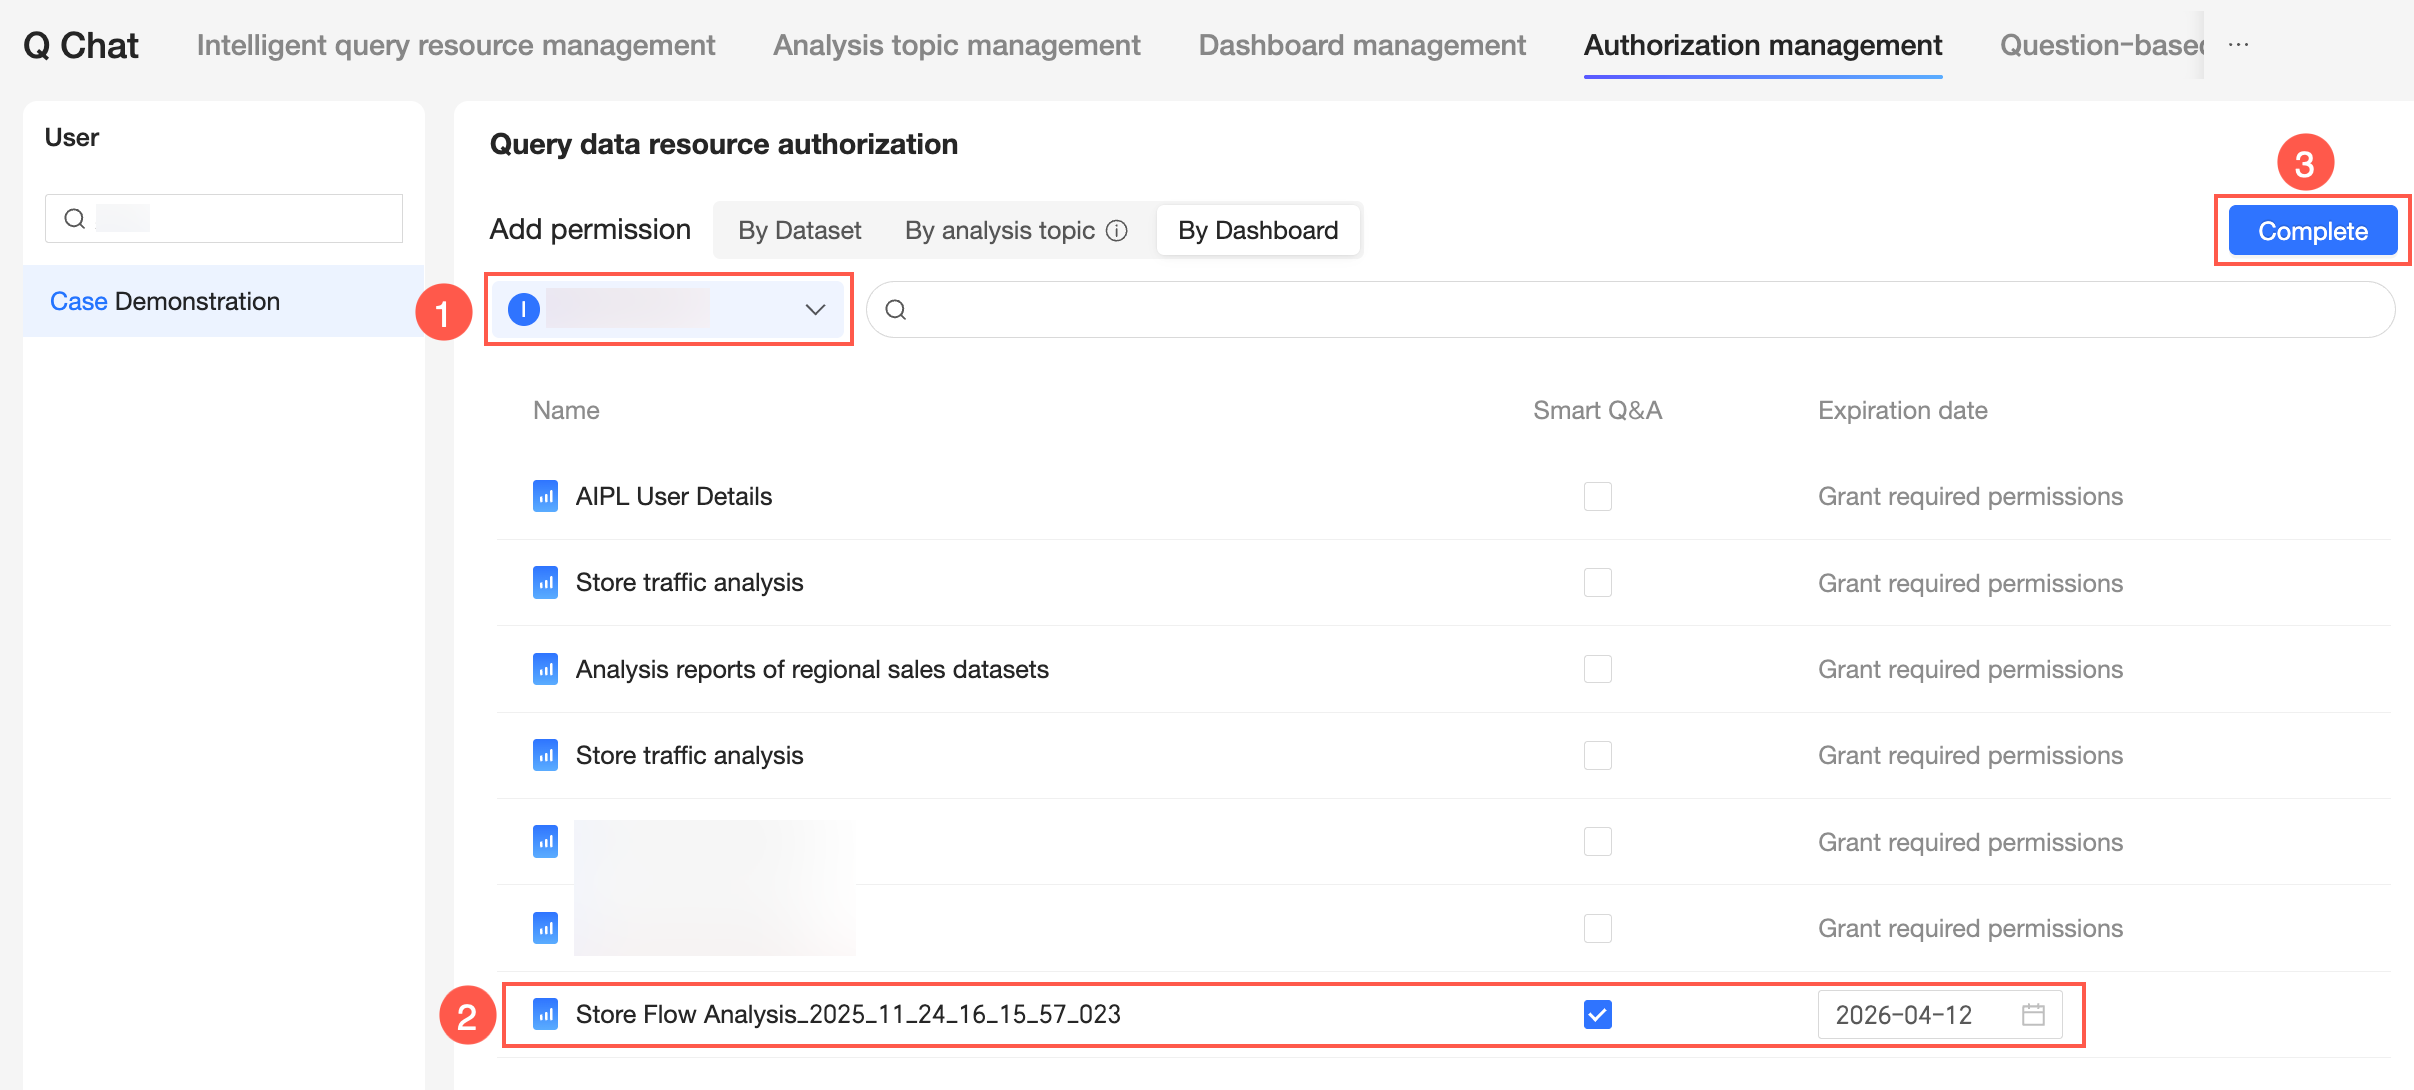
Select a dashboard in the target workspace and click Done.
-
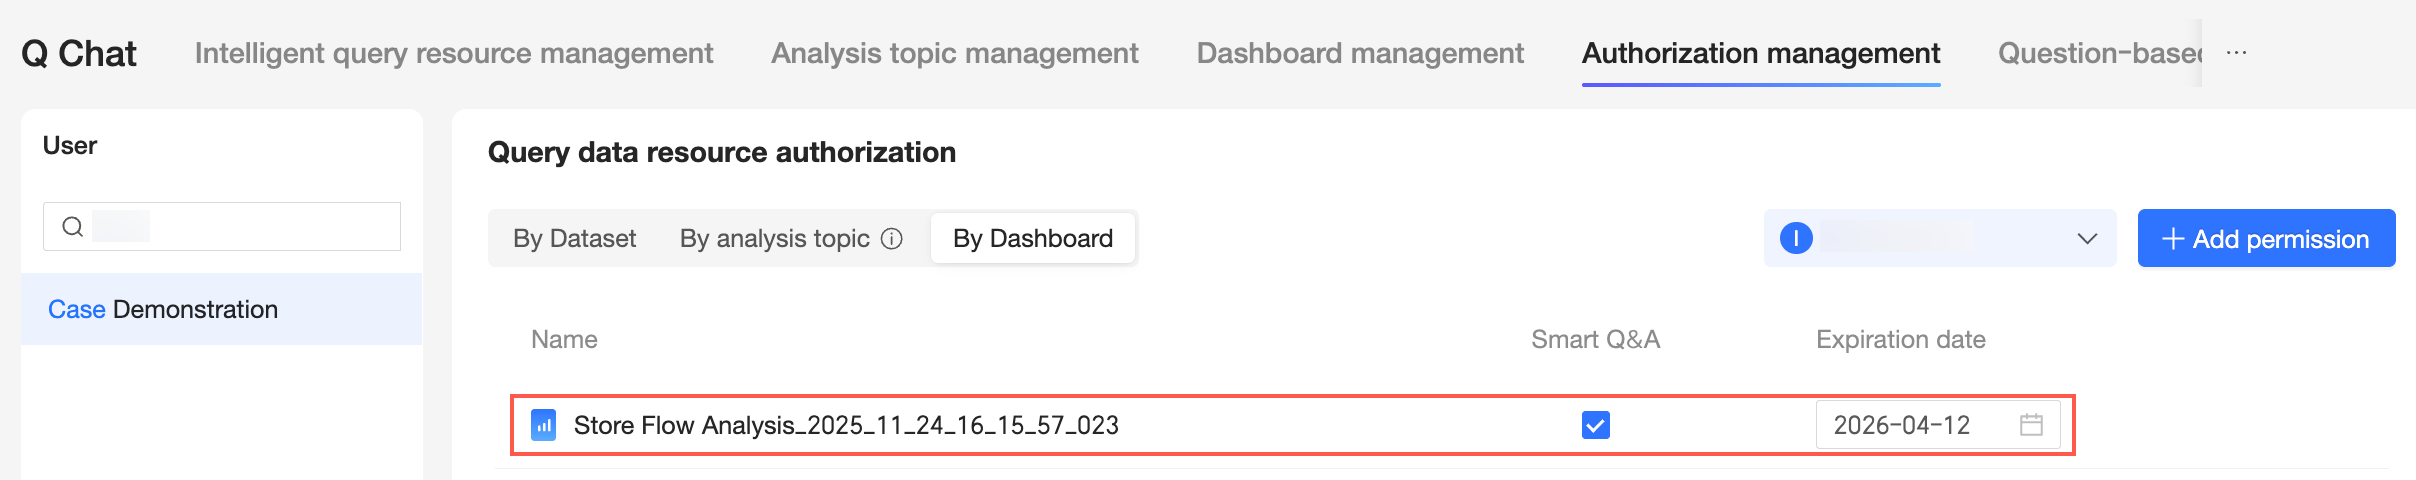
You can then view and manage the user's dashboard Q Chat permissions.
-
-
Access Q Chat on a dashboard
-
On the dashboard preview page, click the
 icon. The Quick BI Smart Analysis page opens by default.Note
If data interpretation is not enabled, the Q Chat page opens directly.

-
Switch to Q Chat.

-
Go to the Q Chat dashboard.

Responsive page layout
Drag to resize the Q Chat panel. The layout adjusts automatically.
-
When the Q Chat panel is narrow:

Click the
 icon in the upper-left corner to expand conversation history.
 View and switch between conversations (①) or create a new one (②).
-
When the Q Chat panel is at medium width:

Click the
 icon (①) to create a new conversation, or the
  icon (②) to expand conversation history.
-
When the Q Chat panel exceeds the width threshold, it overlays the report:
 Note
NoteMaximum Q Chat panel width is 90% of the screen.
Preview and select datasets
-
The Q Chat page lists the datasets used by the dashboard. Hover over a dataset to preview it or ask questions.

-
Click (①) to view field details and data preview, use quick questions, or click Ask in the upper-right corner to open the Q Chat dialog.
-
Field details

-
Data preview

-
Quick questions

-
Ask

-
-
Click Ask (②) to open the Q Chat dialog for the current dataset.
-
-
Click the
 icon next to the selected dataset to preview its Key Metrics and Analysis Dimensions fields.
Expand or collapse the data fields as needed.

-
During a Q Chat session, you can preview data and switch datasets.
-
Preview data
Click the
 icon next to the dataset name to preview.
-
Switch datasets
Click the dataset name (①), hover over the target dataset, and click Ask (②).

-
Ask questions
Q Chat supports multiple inference and data interpretation methods. This section uses the default official methods. For other methods, see Inference and interpretation methods.
-
Enter a question in the dialog box. You can ask directly, use quick questions, or use speech input.
-
Ask a question directly
-
For example, enter "What is the total order amount from mobile clients?" and send it. The system returns the analysis results.

Click Analysis complete to view the analysis process.

-
As you type, matching recommended fields and recommended questions appear. Select them as needed.

-
-
Favorite questions
NoteYou can add up to 30 questions to your favorites.
-
Click the
 icon to the left of a question to add it to your favorites.
After you add a question to your favorites, you can use it from Quick questions.

If no data is selected, you can click a favorite question to ask it directly.

-
Click the
 icon again to remove the question from your favorites.
-
-
Copy a question
Click the
 icon to the left of a question to copy it.
-
Quick questions
Click the
 icon in the lower-left corner to open quick questions. Select a question from Recommended, Favorites, Smart Insights, or Recent Questions.
-
To configure Recommended questions, see Quick questions. Click Show another batch to refresh the list.

-
Smart Insights supports anomaly detection and fluctuation analysis.

-
Click "Help me detect anomalies in the report" to return the anomalies in the data.

You can click to view the specific anomaly details.

-
You can also use fluctuation analysis. Use fluctuation analysis in Quick questions.

-
-
In Favorites, Automatically switch datasets is enabled by default. When enabled, clicking a favorite question switches to the associated dataset. When disabled, the question runs on the current dataset.

-
-
Speech input
NoteAfter you enable the voice Q Chat switch, you can use speech input.
-
Click the speech input icon to open voice input.

-
Speak your question.

-
The system converts your speech to text.
Click the
 icon on the left to cancel input, or the
  icon on the right to switch to text input.
 -
Click Send or press Enter. The system queries the data and returns results.

-
-
-
The following features are available for each result.

-
Switch chart type (①)
-
View AI data retrieval process (②)

-
View in full screen (③)

-
Rename (④)

-
Share (⑤)
You can copy the link to share.

-
Export (⑥)
You can export the data to a local Excel file and specify a custom file name.
 Note
NoteExport is supported only on PCs, not on mobile devices.
-
Data interpretation (⑦)
If you did not select a data interpretation model, you can perform data interpretation here. If you already selected a model, you can perform a secondary interpretation.

Refer to the examples, enter your interpretation logic, select a model, and click Generate Interpretation.

You can stop the interpretation while results are being generated.

Accept or modify the result. After acceptance, a data interpretation report is generated.

-
Ask a follow-up question (⑧)
Ask a follow-up question about the previous result to drill deeper into the data.

-
Like or dislike (⑨)
Click
 to like or
  to dislike an answer. You can provide feedback when disliking.
 -
Copy Trace_ID (⑩)

-
Inference and interpretation methods
Method description
The default methods use the official inference model. You can also select a built-in large language model (LLM) or a custom LLM. Choose the methods that best suit your analysis needs.

For the analysis results returned by specific inference and data interpretation methods, see Examples.
Conversation history
-
Entry Point
-
When the Q Chat panel is narrow, click the
icon in the upper-left corner to expand conversation history.
-
When the Q Chat panel is at medium width, click the
icon to expand conversation history.
-
-
Create a new conversation
At the top of the conversation history list, click Quick BI Q Chat to start a new conversation.

-
Rename
Click the
 icon next to a conversation and select Rename.
You can also double-click the conversation name to rename it.

-
Delete
Click the
icon next to a conversation and select Delete.
Click OK in the confirmation dialog.
