Quick BI provides the Q Chat feature, an intelligent data assistant powered by ChatBI's interactive capabilities. Q Chat lets you get instant answers from your data by using natural language. This makes data analysis accessible to everyone and introduces a new way to consume data. You can use the Q Chat interface on your PC or mobile client to preview and select datasets, enter questions directly or use quick queries, engage in multi-round Q&A, and review past conversations in the conversation list.
This topic describes how to use Q Chat.
Q Chat is a value-added feature that requires a separate purchase.
This feature is currently available only in the China (Hong Kong) , Malaysia (Kuala Lumpur) and Singapore regions. It will be rolled out to other regions soon.
Prerequisites
Create a dataset and complete the Q Chat configuration.
Obtain the required Q Chat resource permissions. For more information, see permission management.
Access on PC
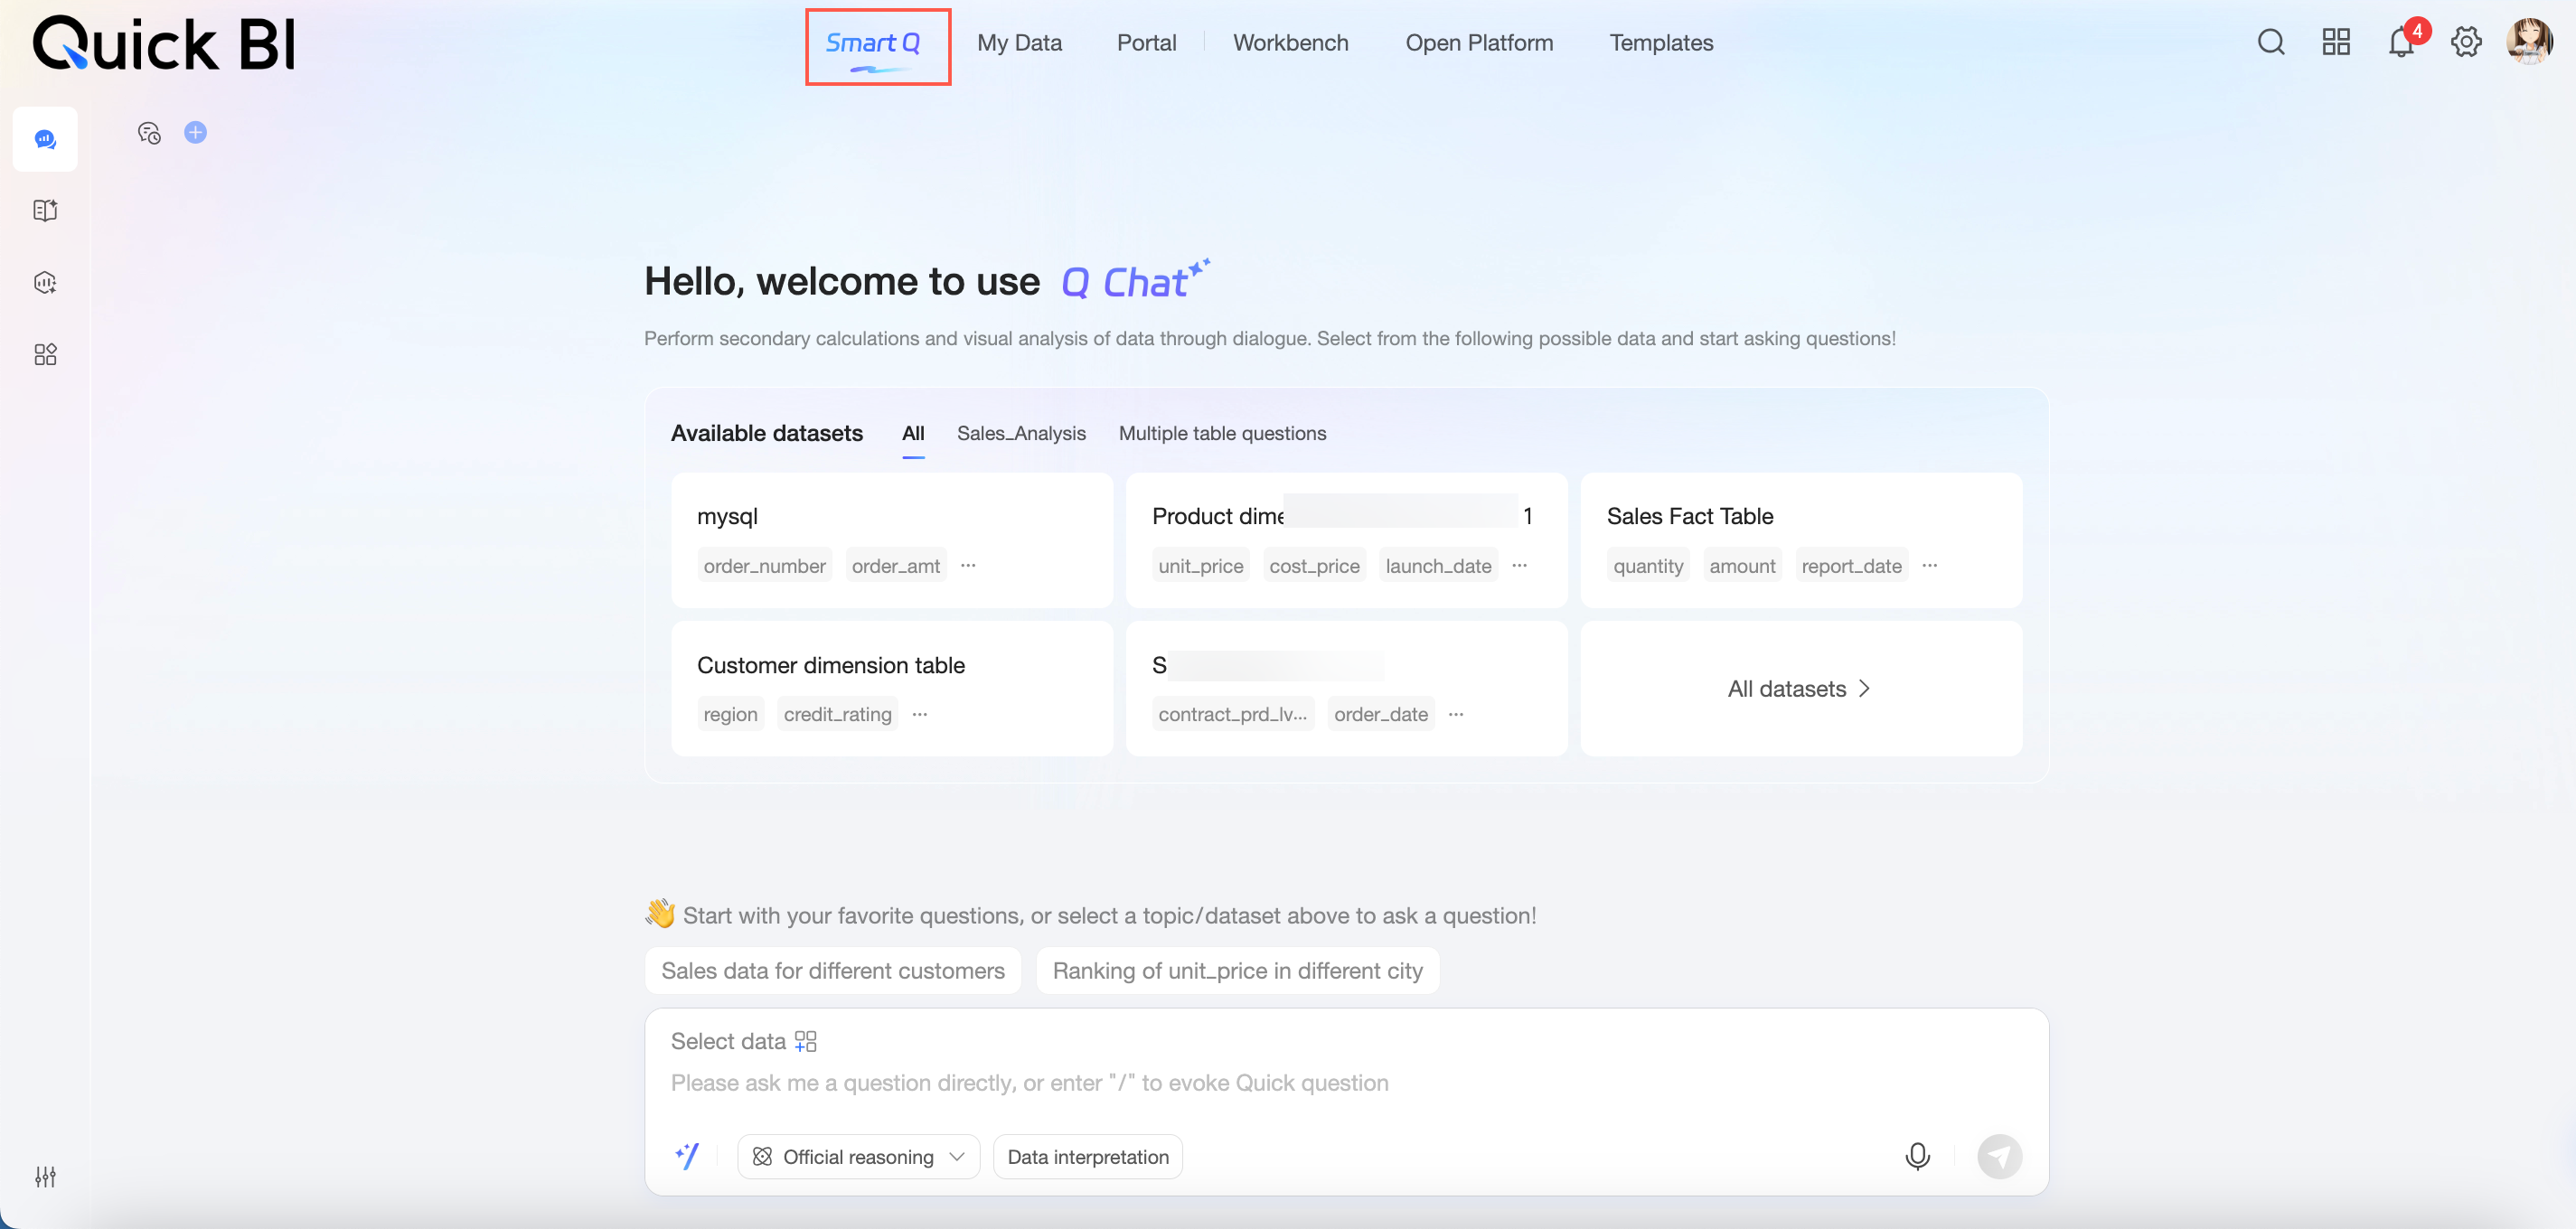
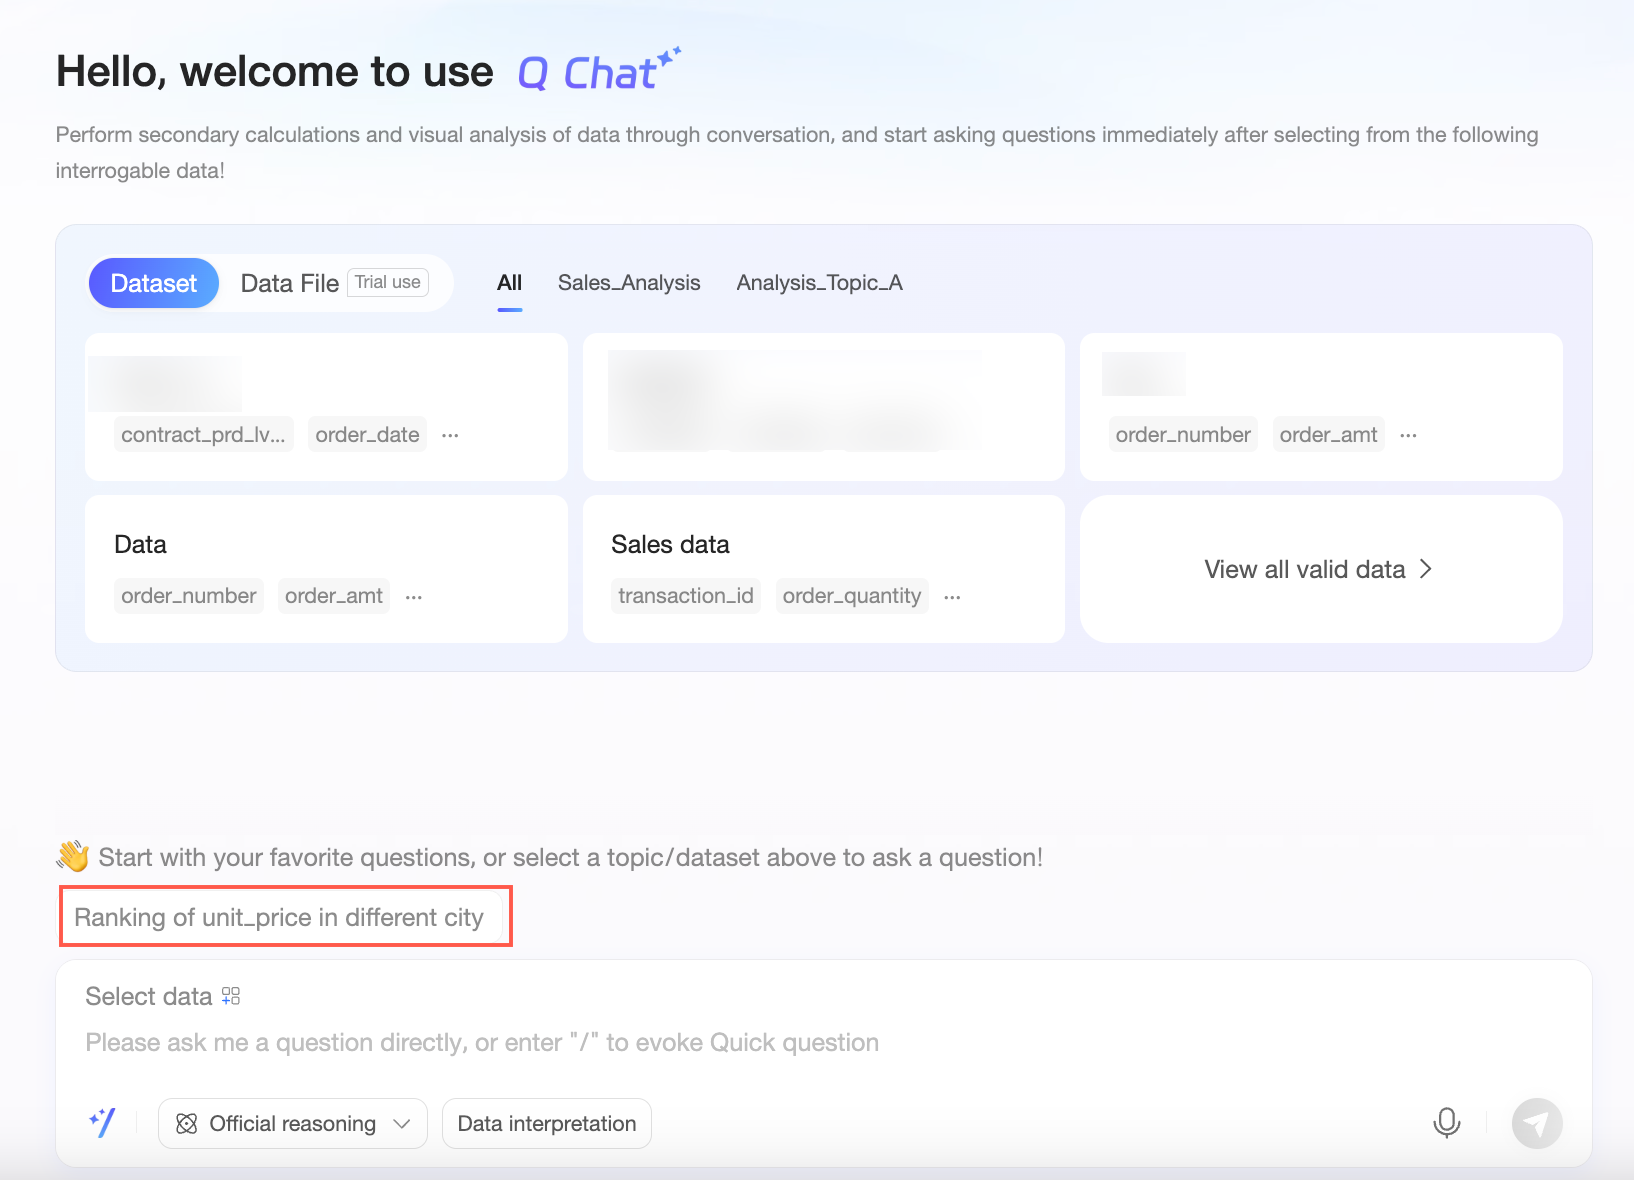
On the Quick BI homepage, click Smart Q to open the Q Chat conversation page.
Data sources
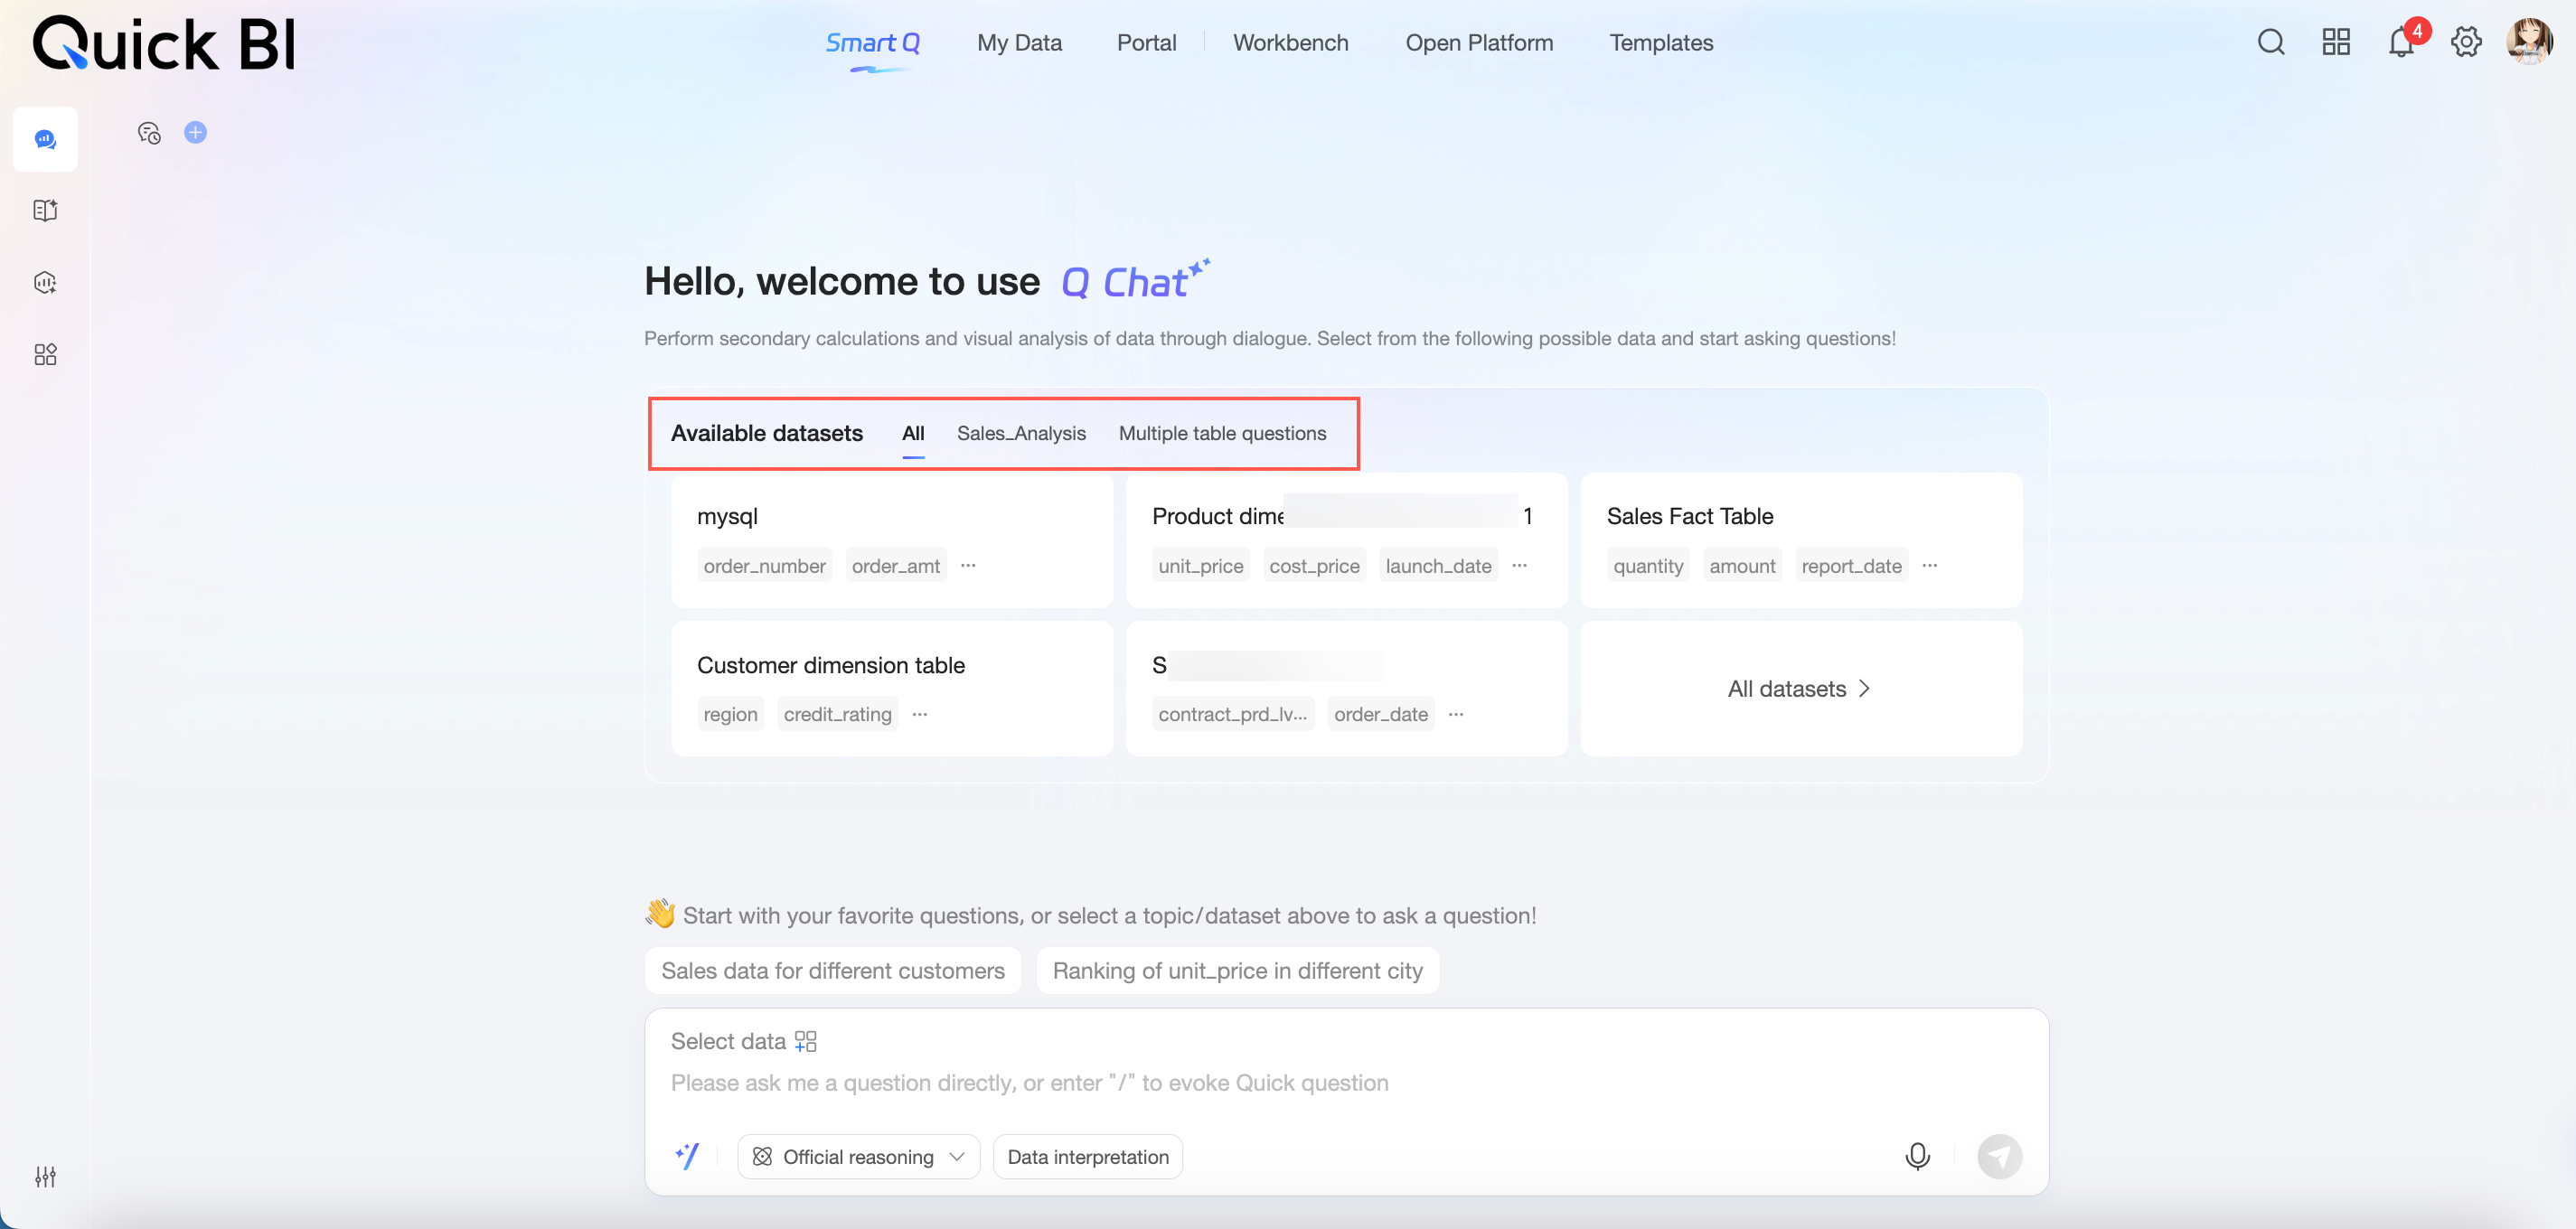
Available data sources include all datasets that you can access with Q Chat. These datasets are located under the All tab and within each analysis subject.
To configure Q Chat dataset permissions, see Q Chat permission management.
To configure analysis subjects, see Analysis Subject Management.
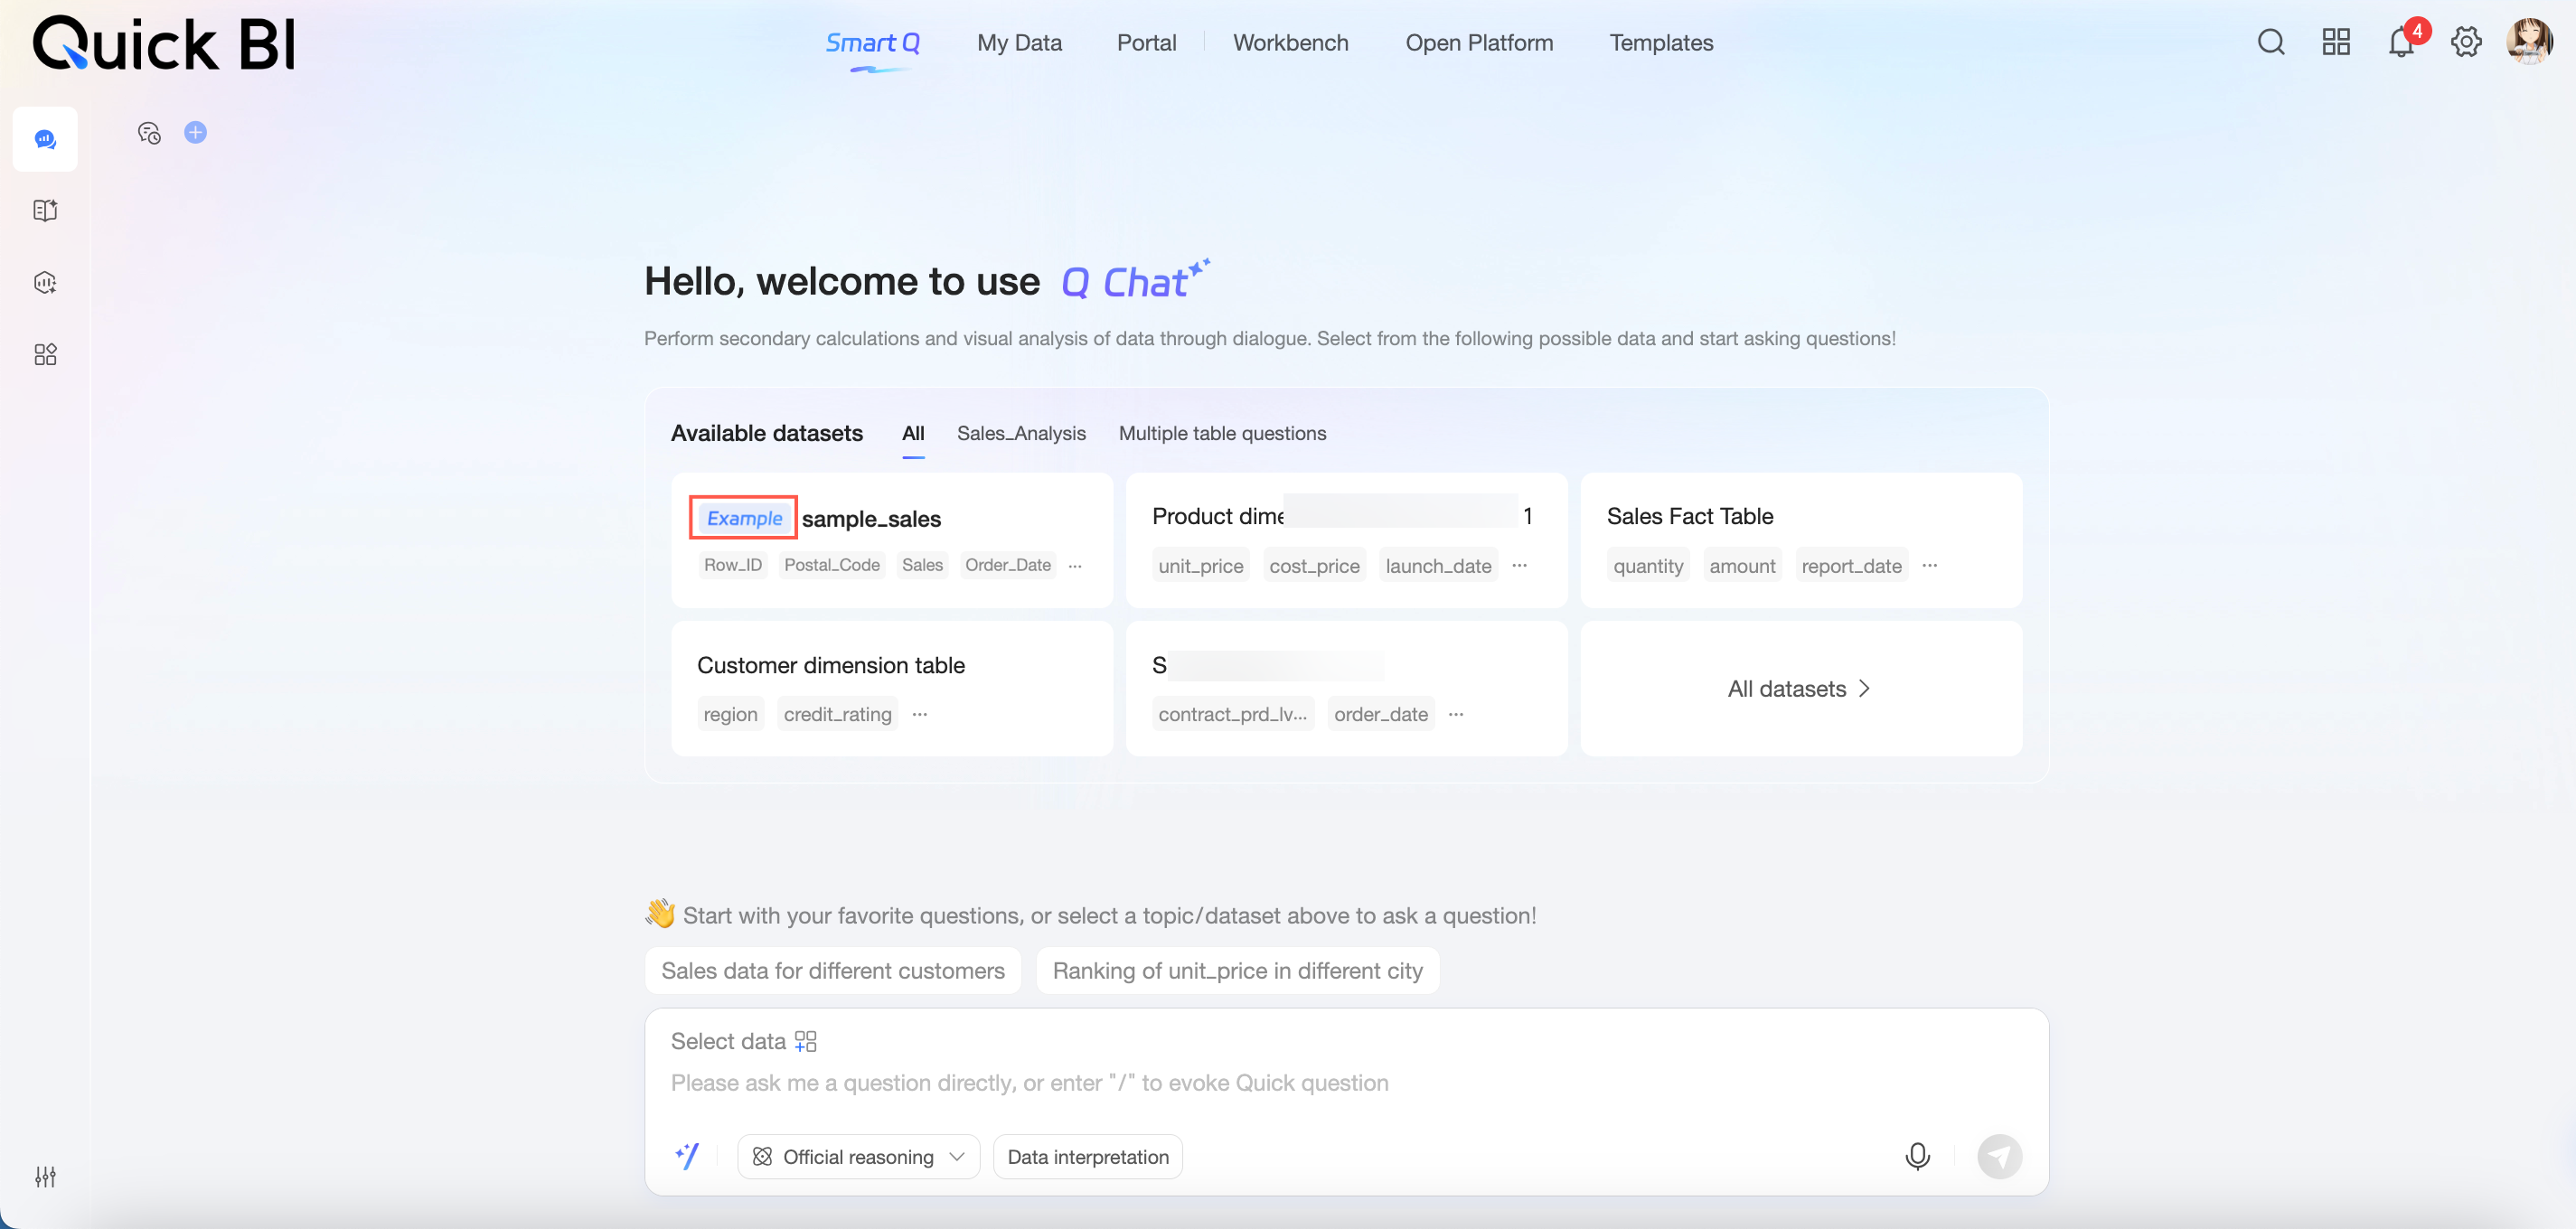
Datasets marked with the Sample tag in the upper-left corner are sample datasets.
You can hide sample datasets using the Show sample datasets setting.
Preview and select datasets
Select a single dataset
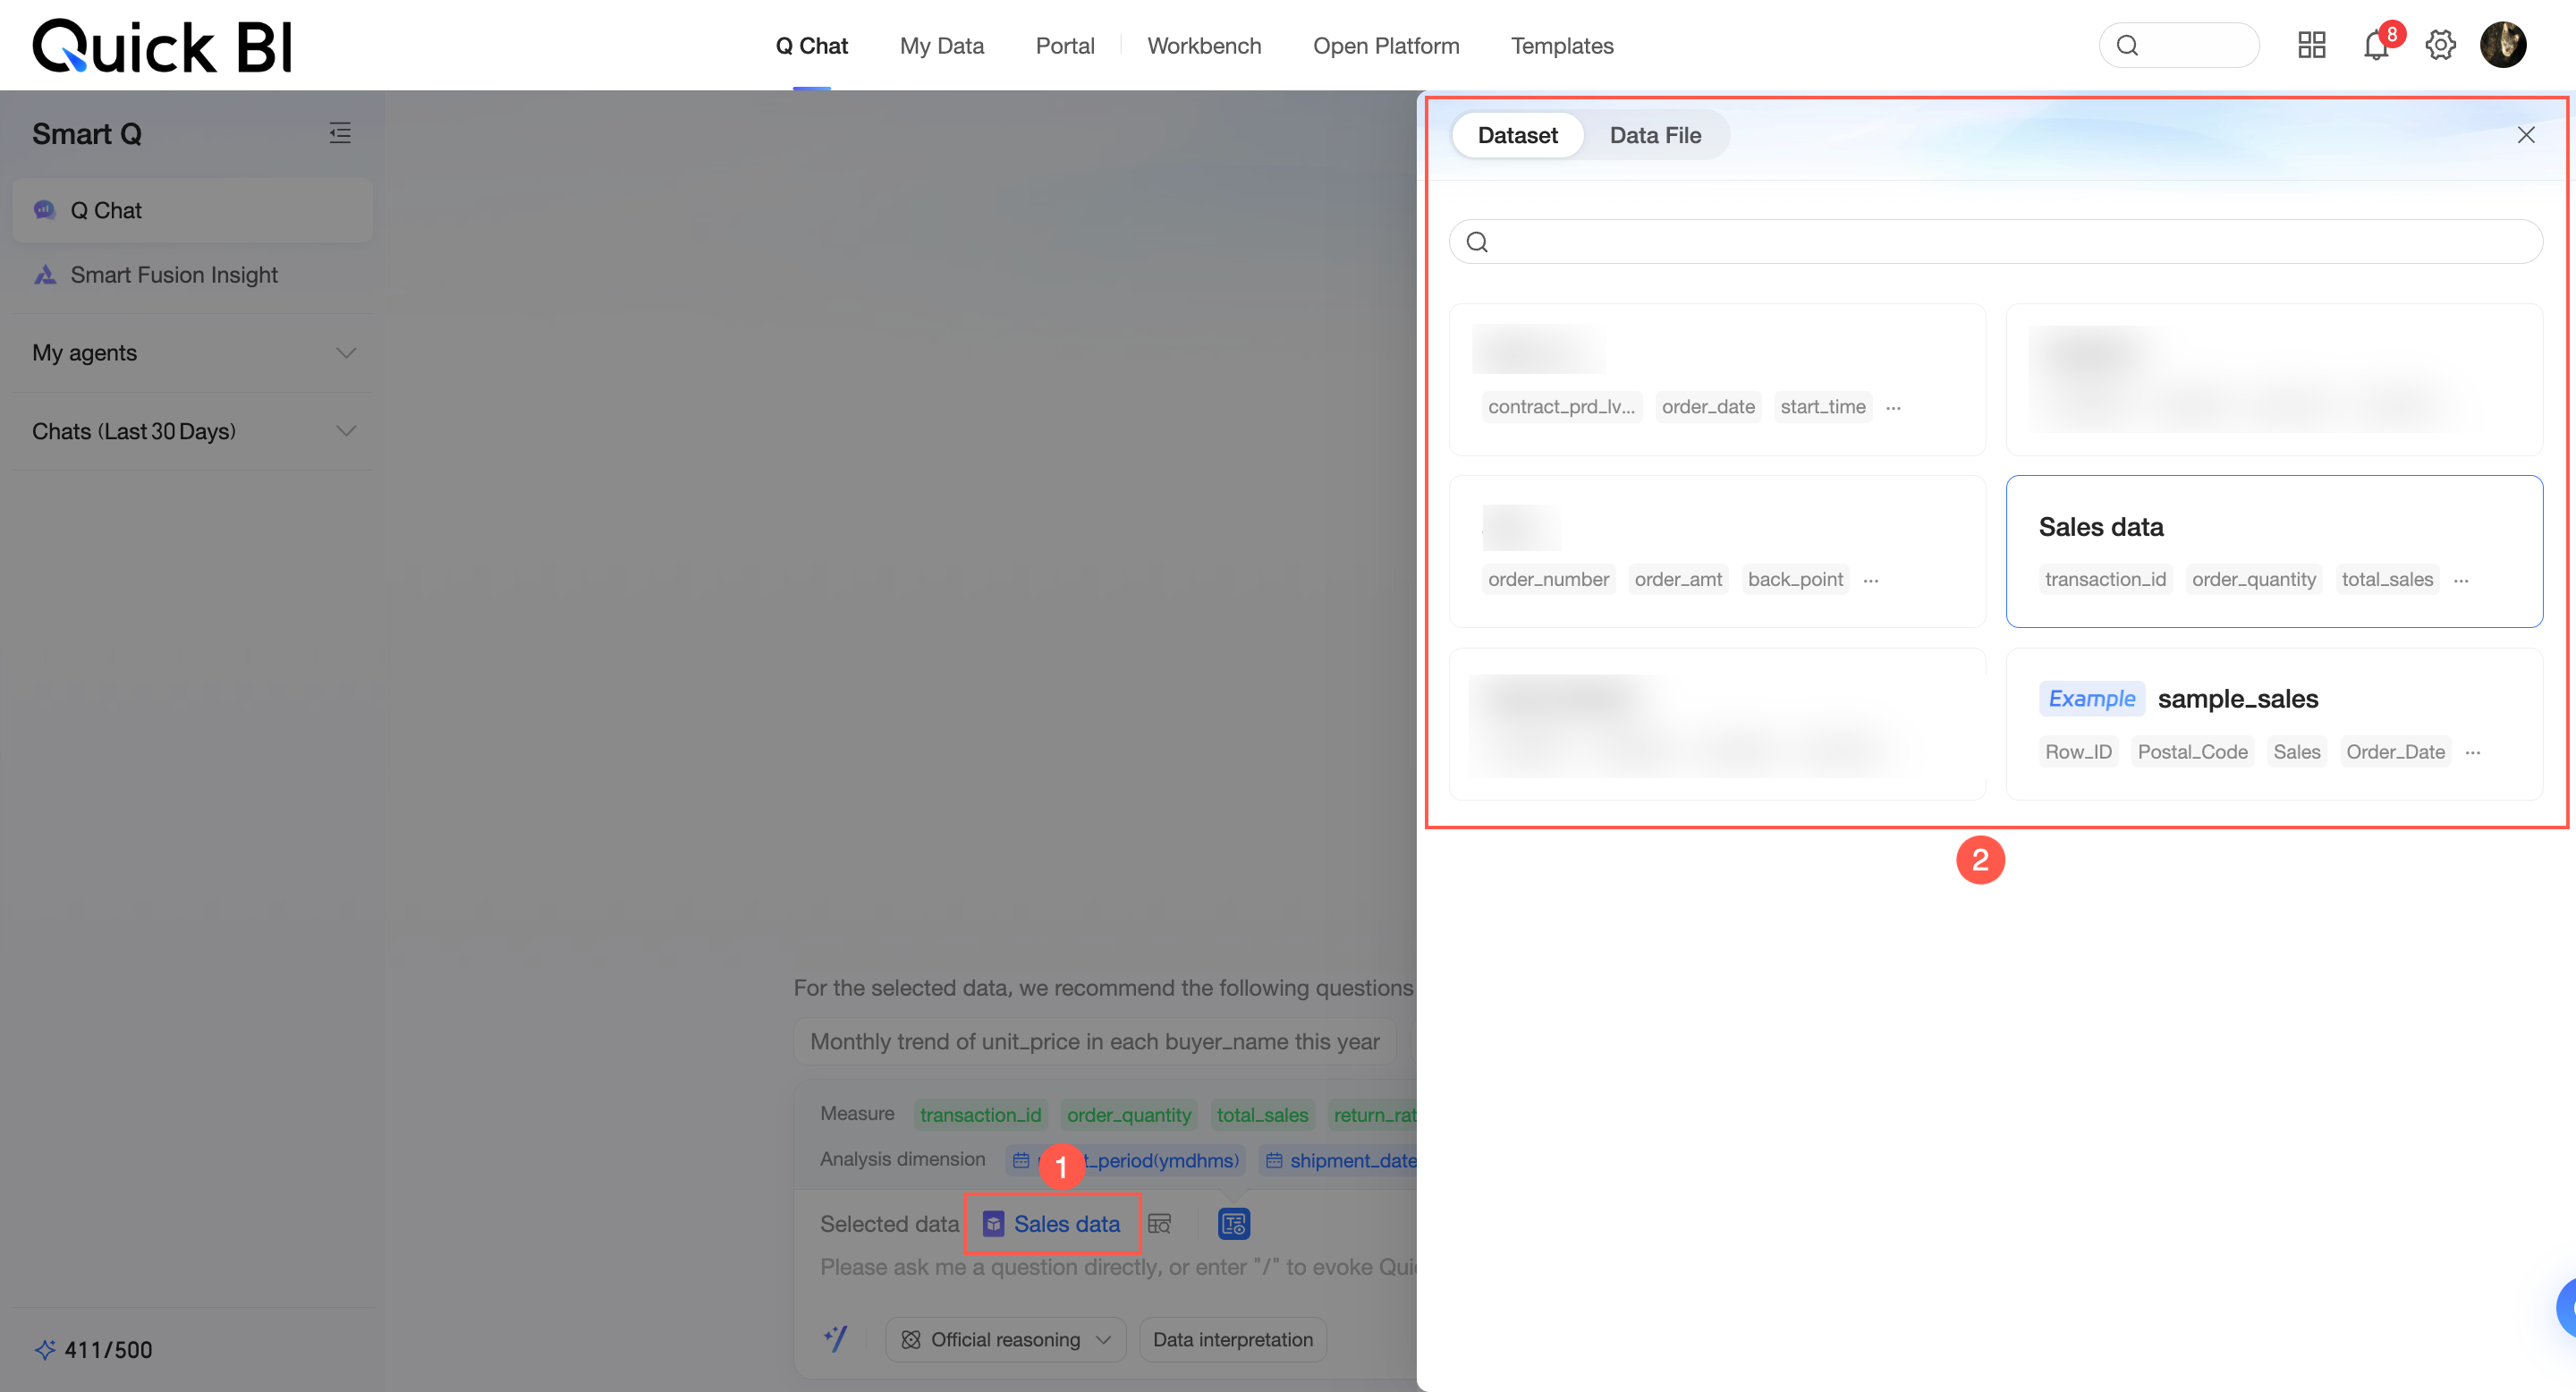
On the Q Chat conversation page, you can find datasets under the All tab and within each analysis subject. Hover over a dataset to Preview it or click Ask Question to query it directly.
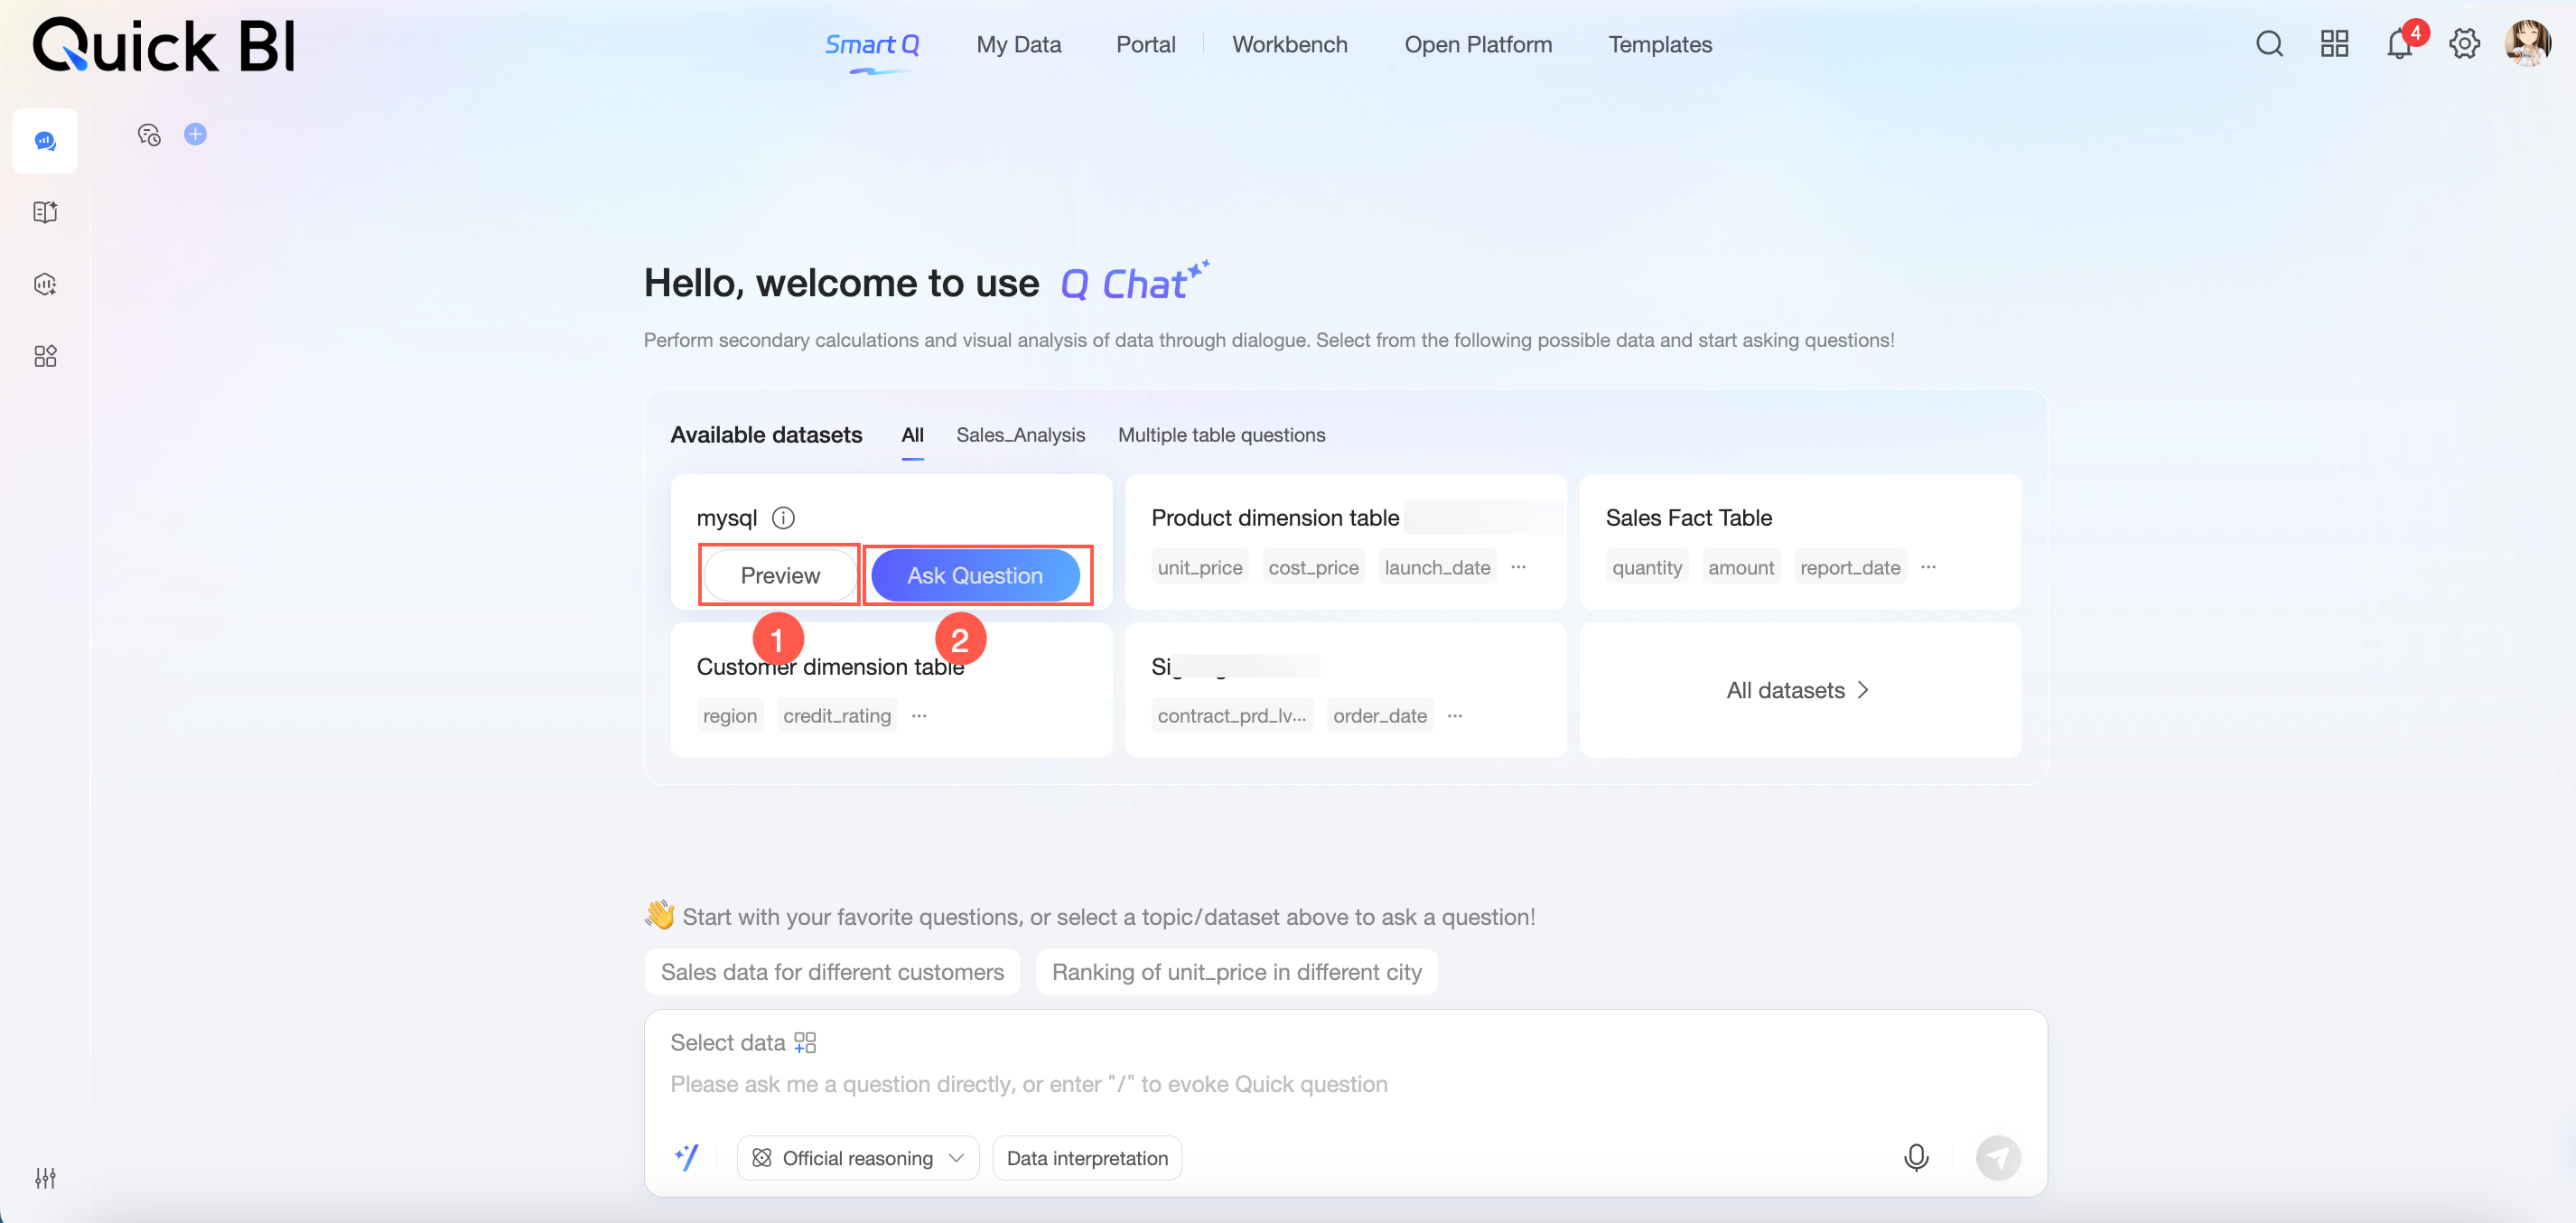
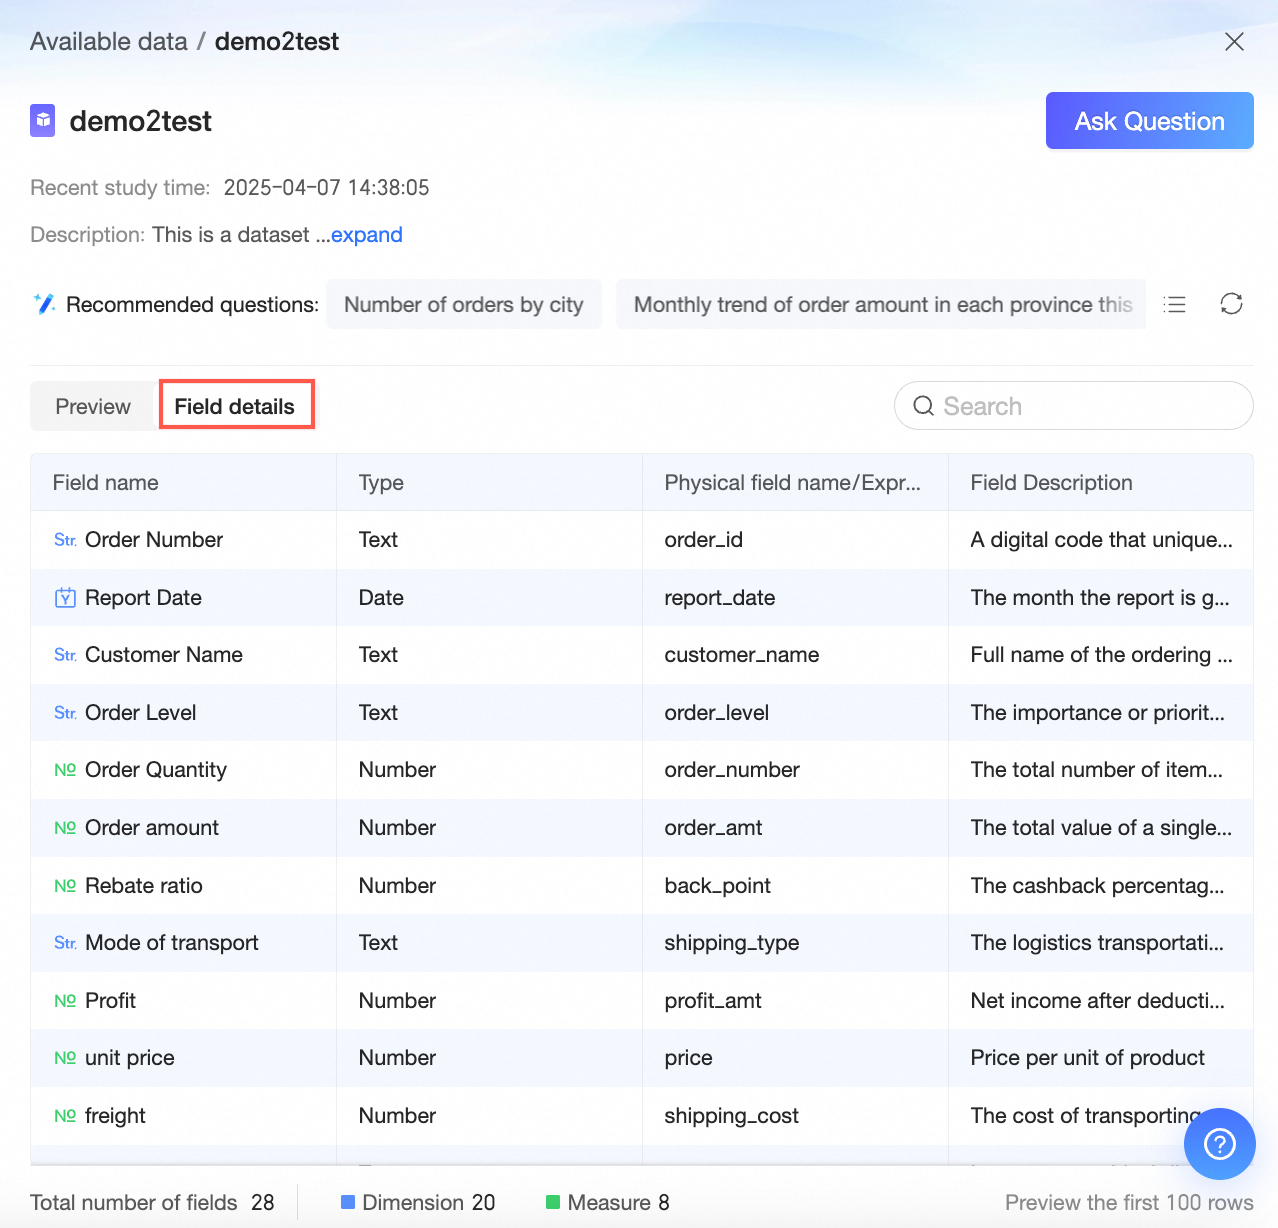
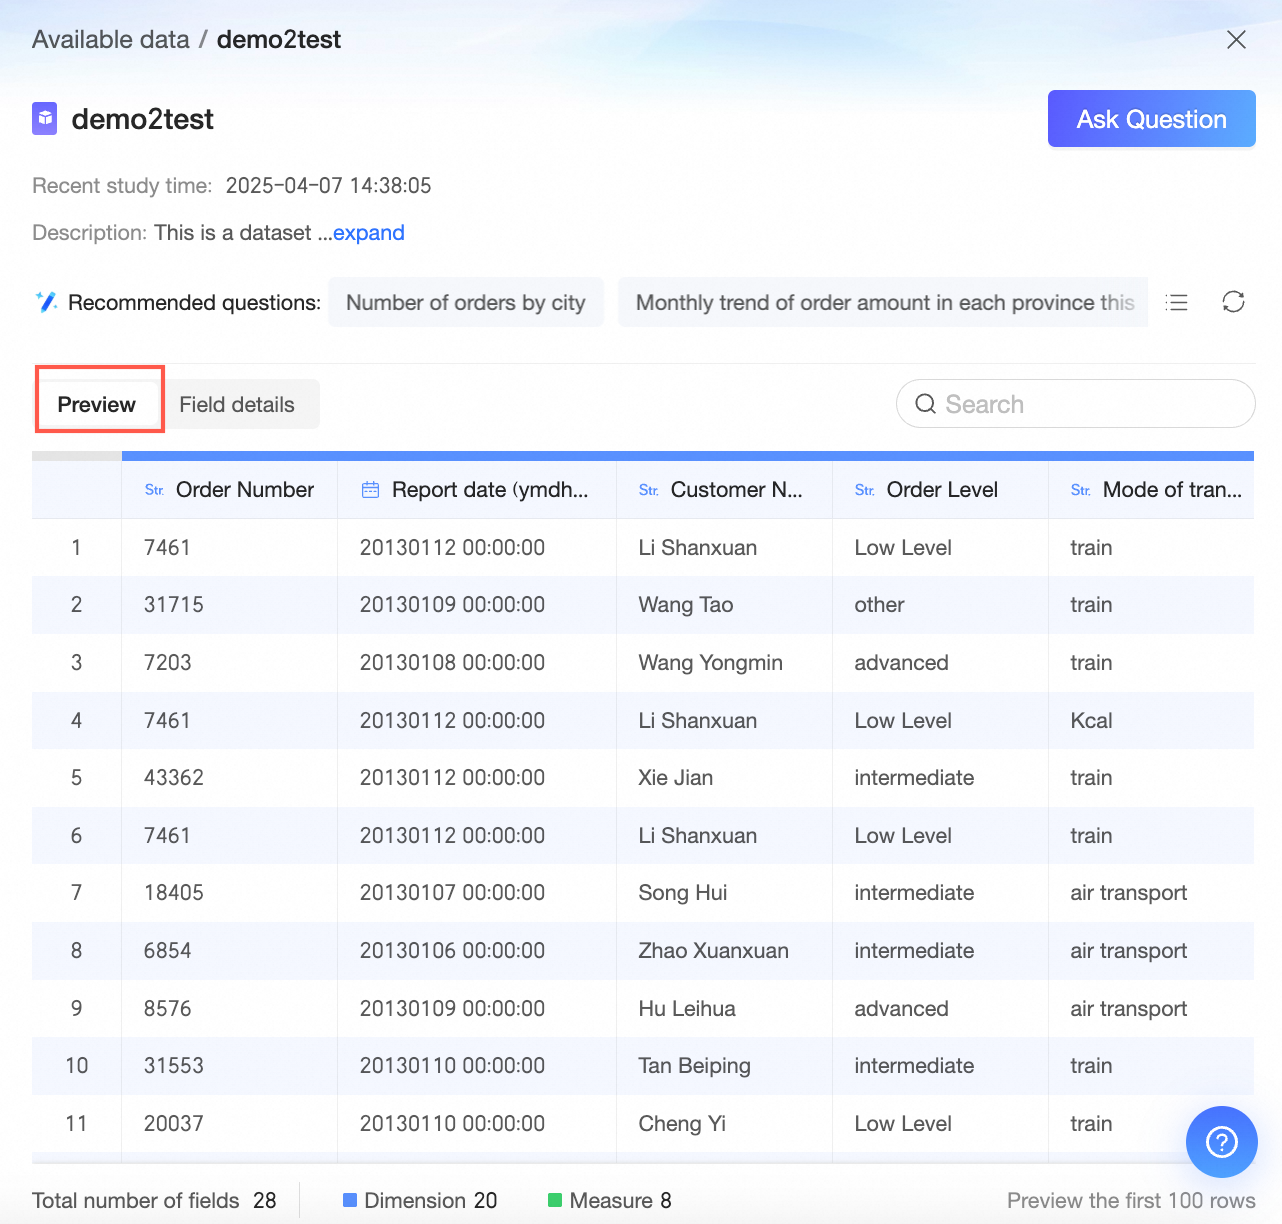
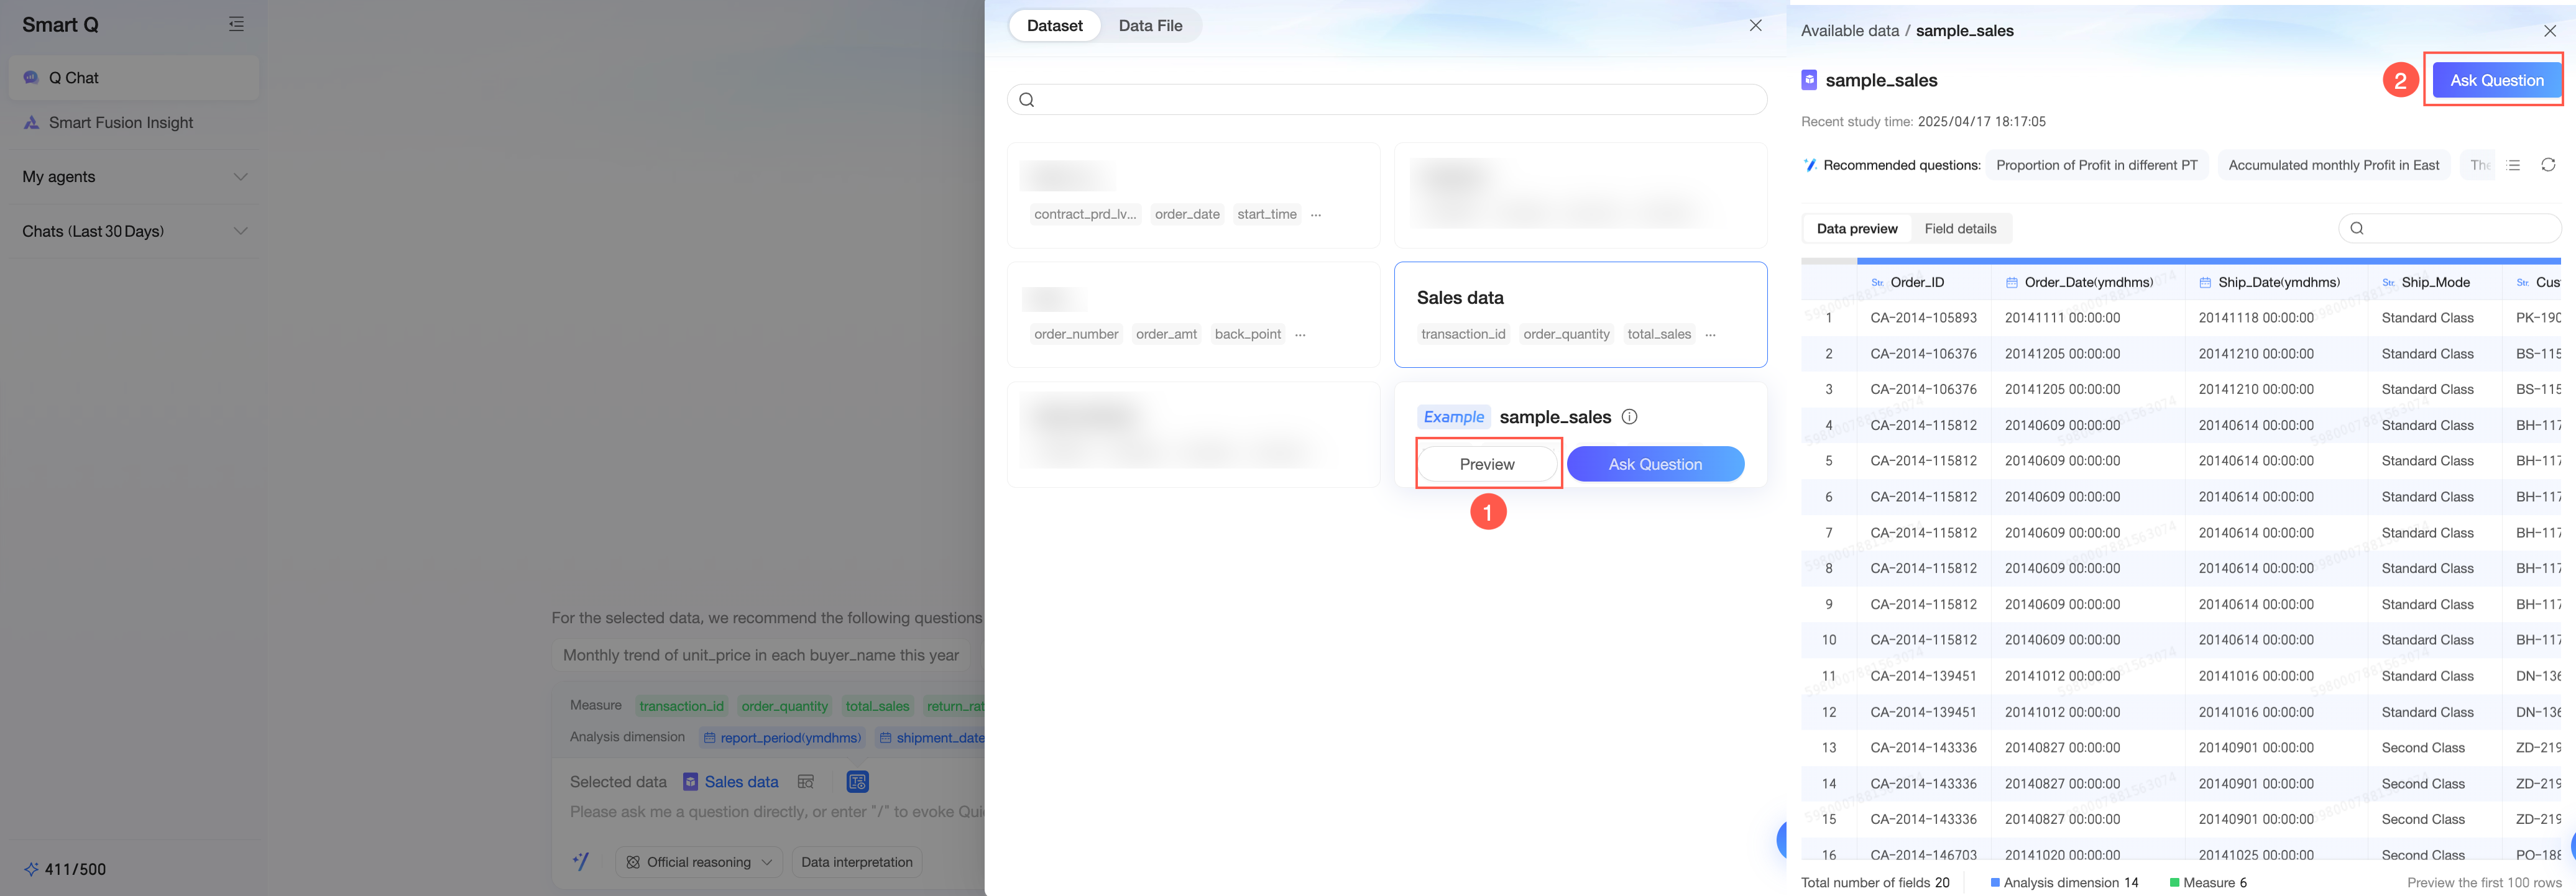
Click Preview (①) to view the dataset's Field Details and a Data Preview. From here, you can use a quick query or click Ask Question in the upper-right corner to open the Q Chat dialog box.
Field Details
Data Preview
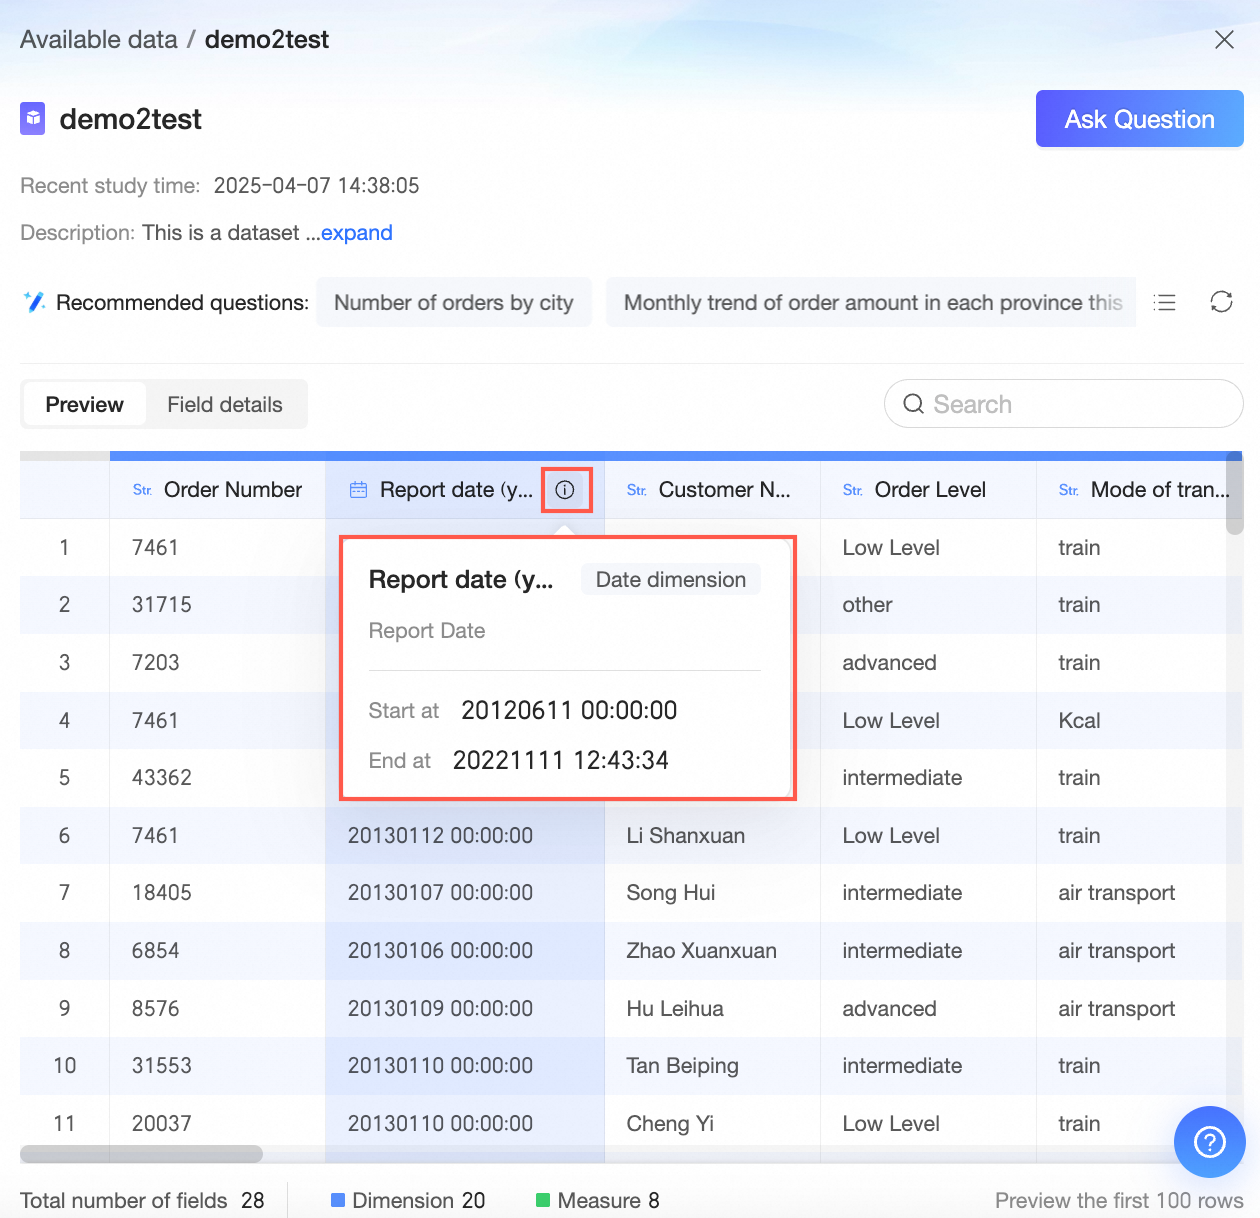
Hover over a dimension field to view its details.
Quick query
Ask Question
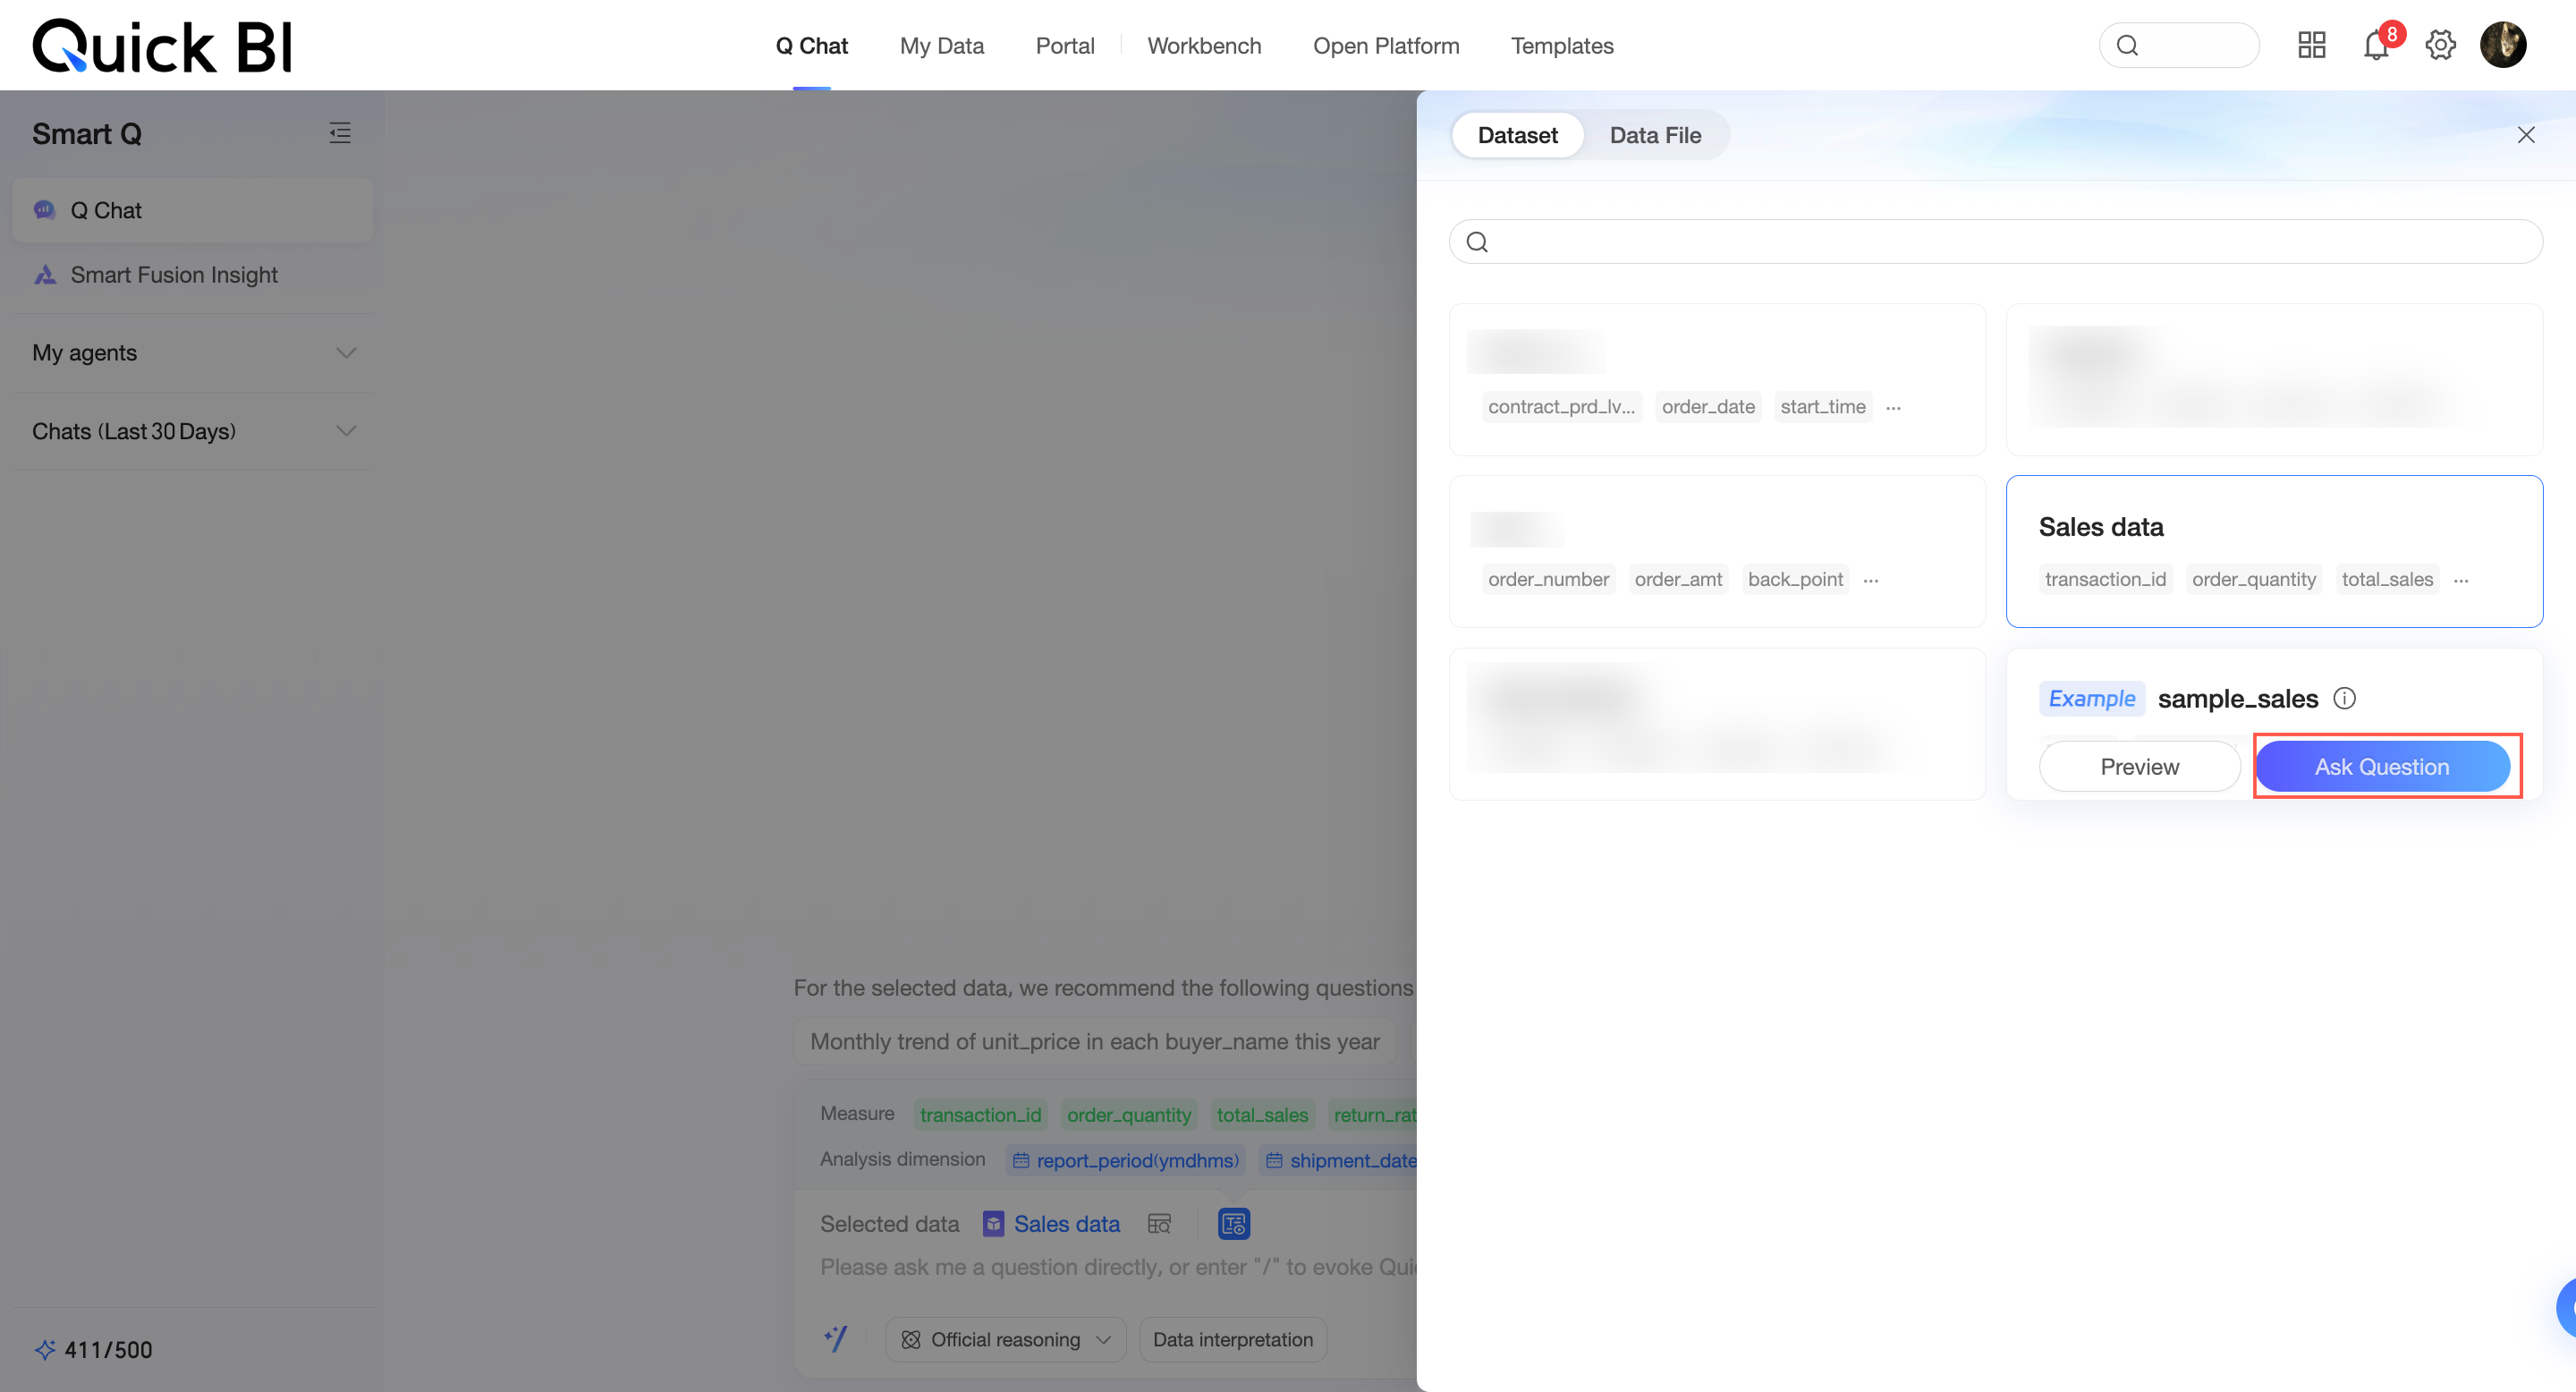
Ask questions about the current dataset.
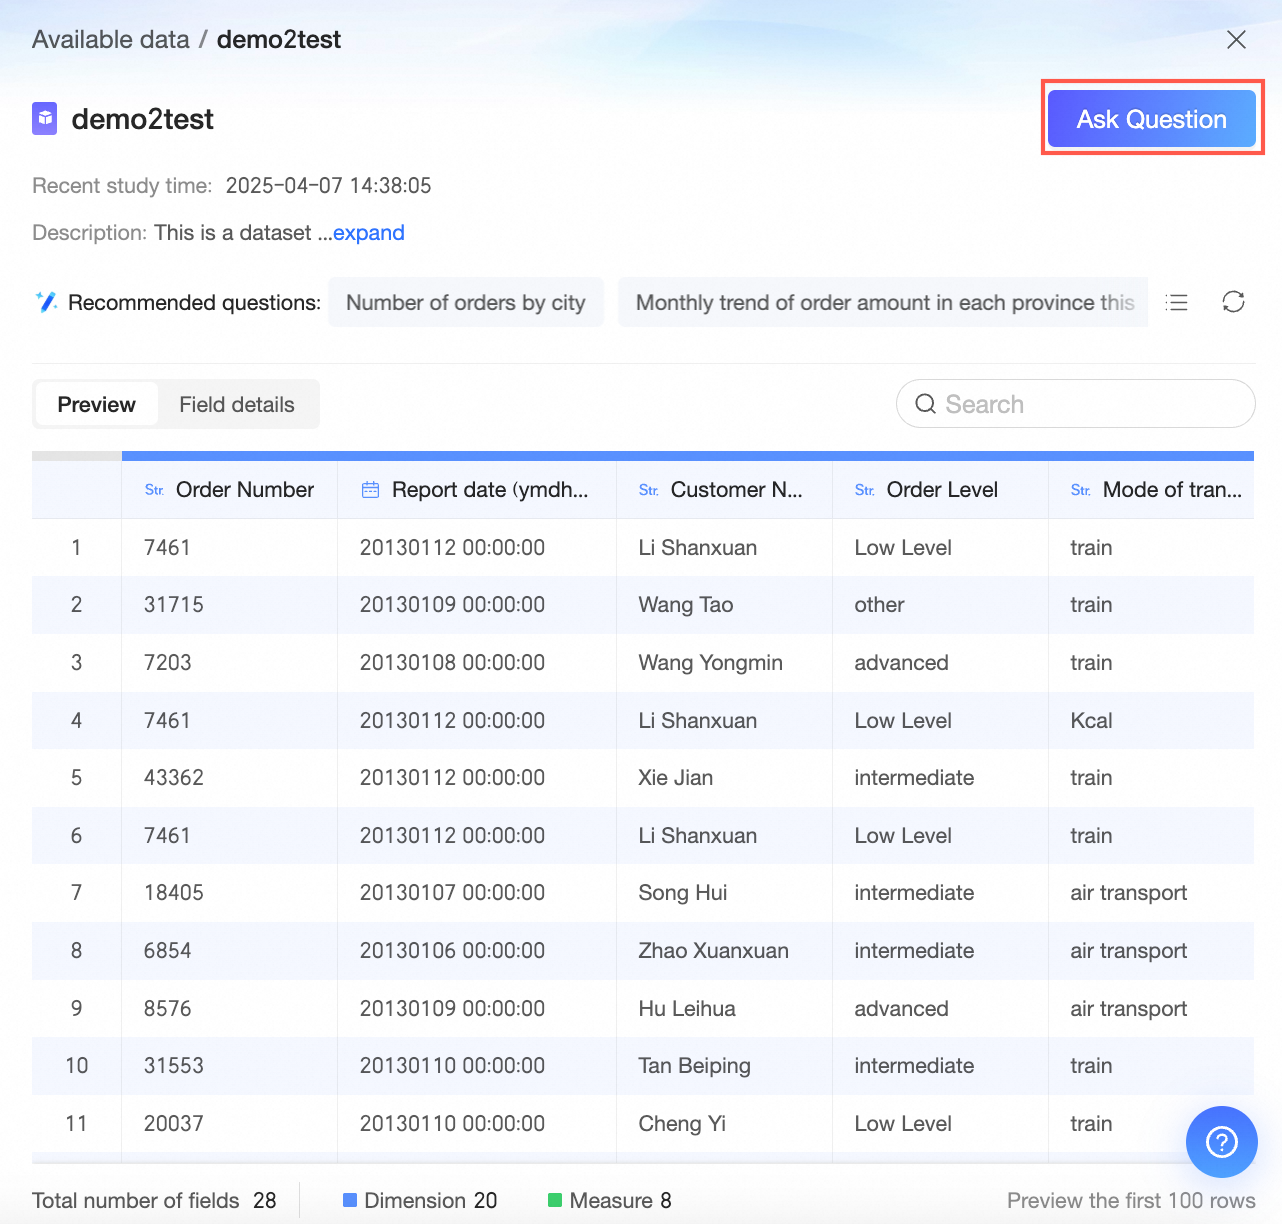
Click Ask Question (②) to open the data Q&A interface and start querying the current dataset.
After you select a dataset, you can click the
 icon next to the dataset name to preview its fields, including key metrics and analysis dimensions.
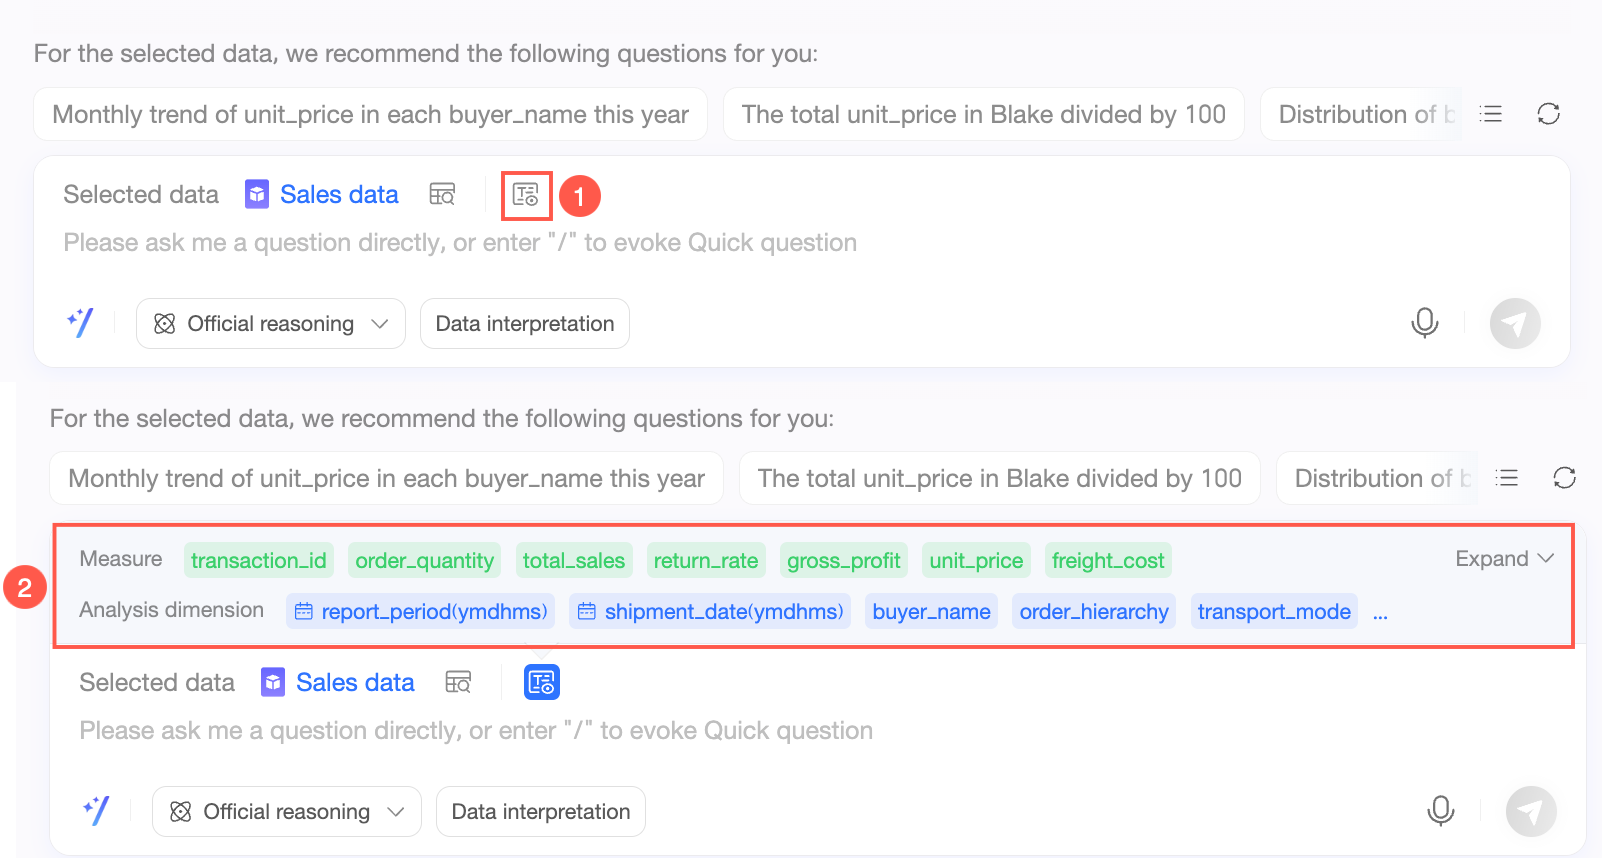
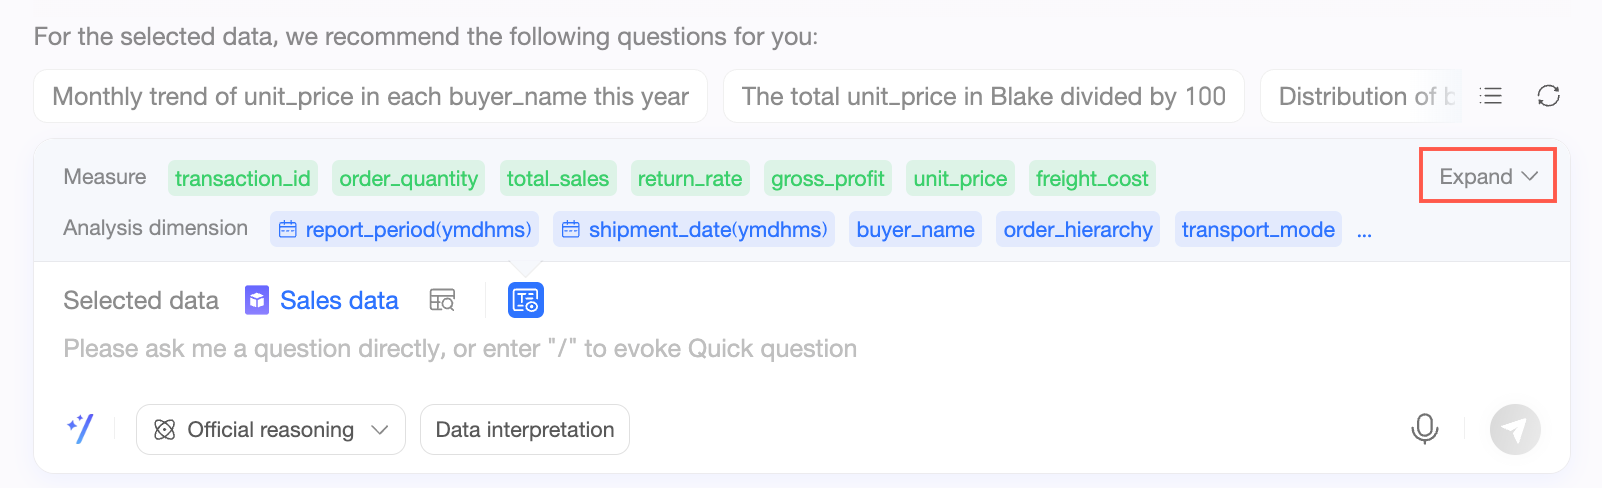
You can expand or collapse the data fields.
During a Q&A session, you can preview data and switch datasets.
Preview data
Click the
 icon next to the selected dataset to open a Data Preview.
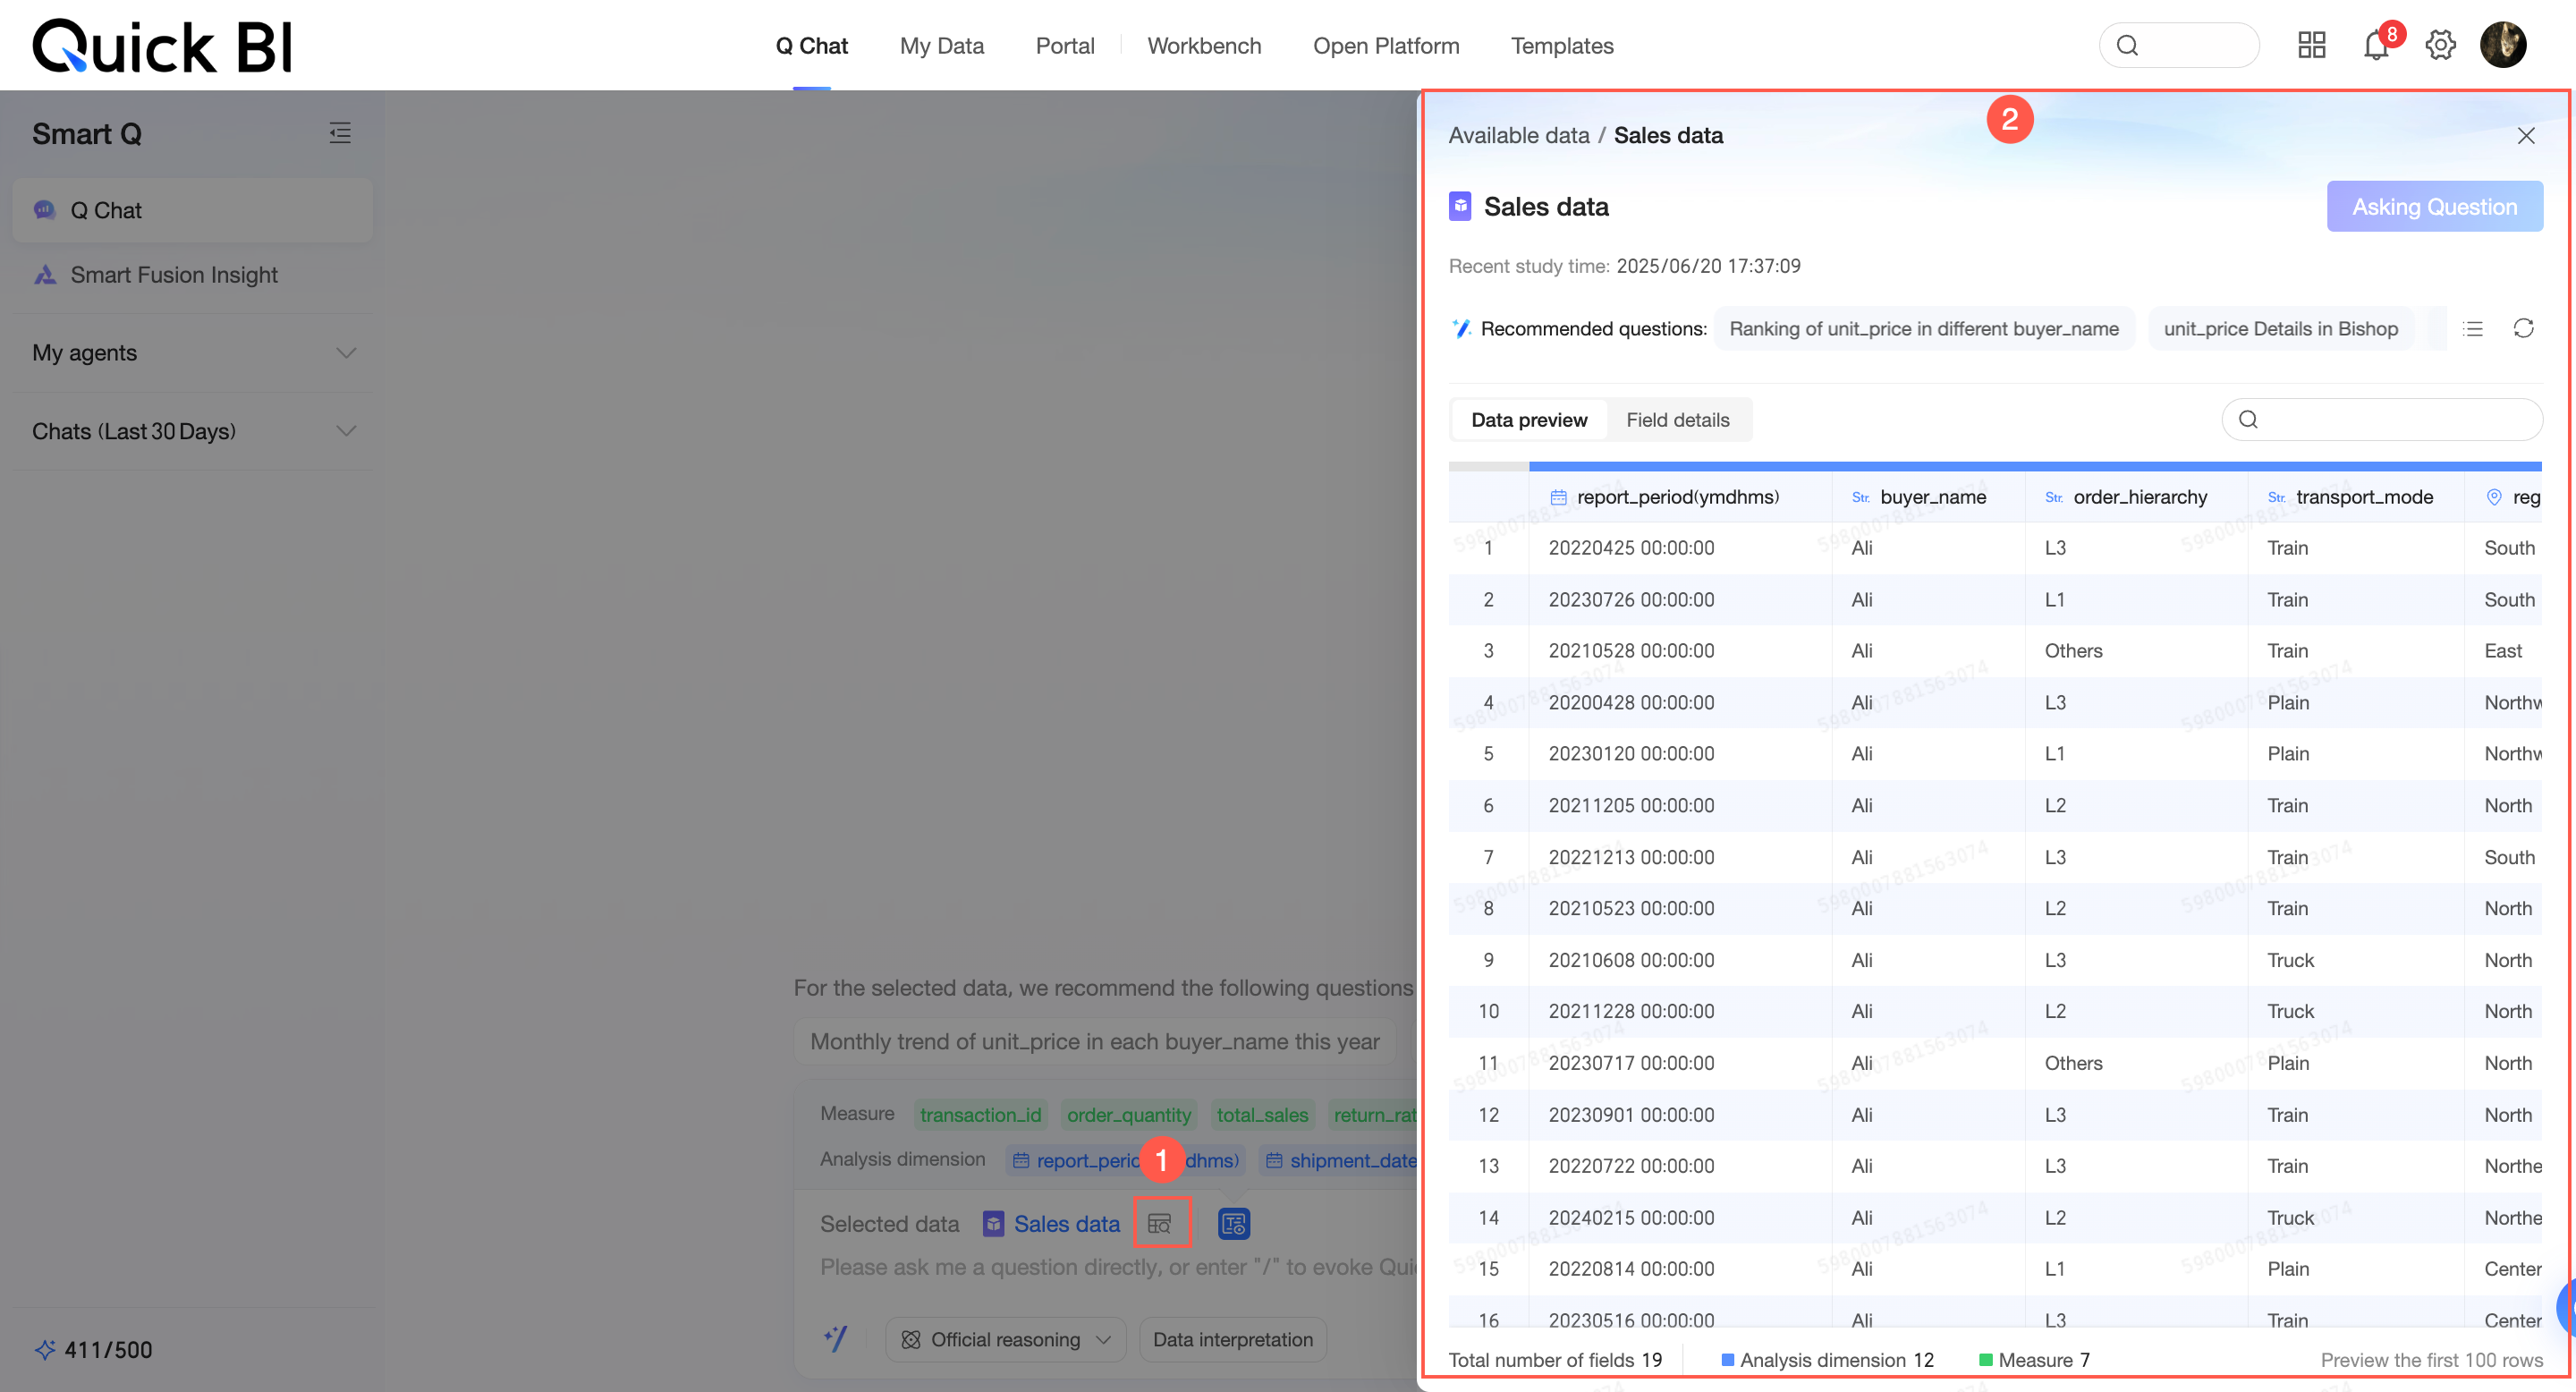
Dataset switching
Click the name of the selected dataset to view available datasets.
Hover over a target dataset and click Ask Question to switch to it.
You can also Preview the target dataset before clicking Ask Question.
Select multiple datasets
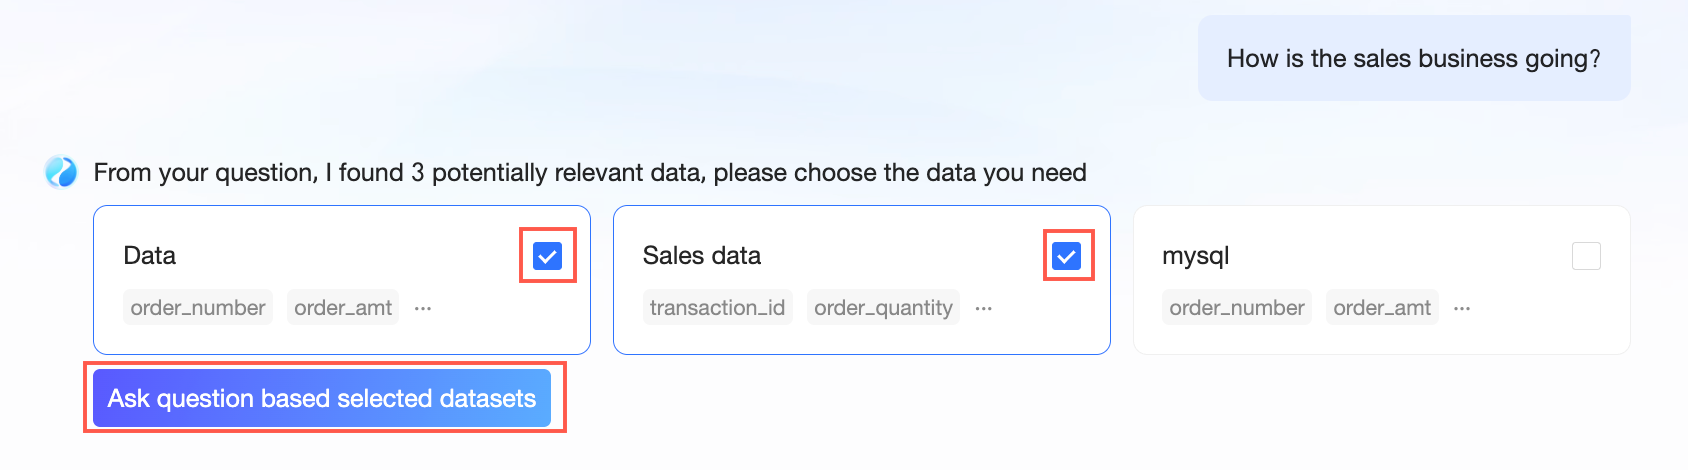
If your question matches multiple datasets, you can select all relevant datasets for your query.
This section describes only how to select multiple datasets. For other operations, see Select a single dataset.
Enter your question.
The system displays datasets that may be relevant to your question. You can select the datasets you need.
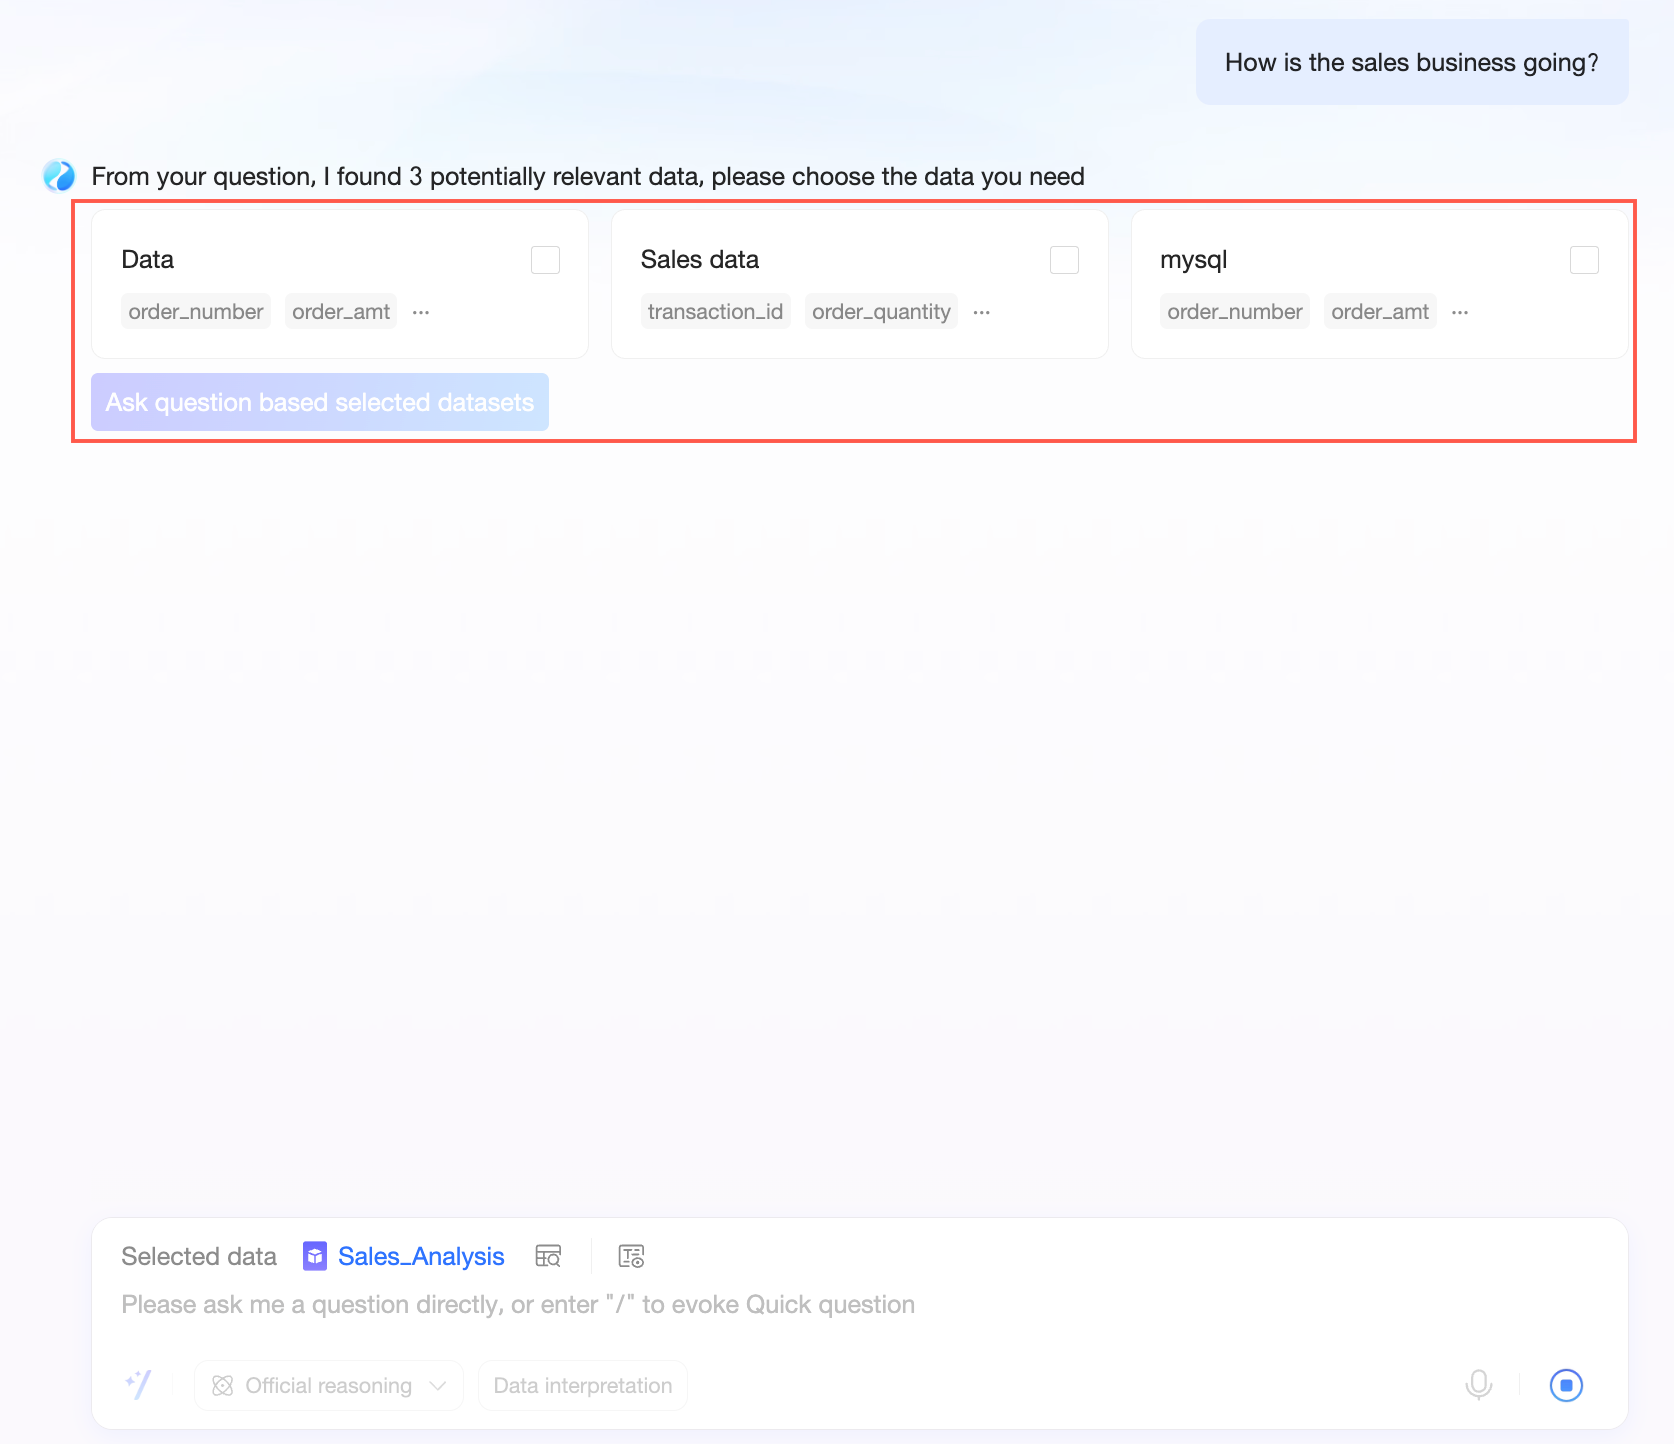
Select the checkboxes for multiple datasets and click Ask question based on selected data.
View the analysis results.
Ask questions and get answers
Q Chat supports multiple inference and data interpretation methods. This topic uses the default official methods as an example. For details on the results from other methods, see Inference and interpretation methods.
You can enter a question in the dialog box and send it. Q Chat supports direct question input, quick query, and voice input.
Enter a question directly
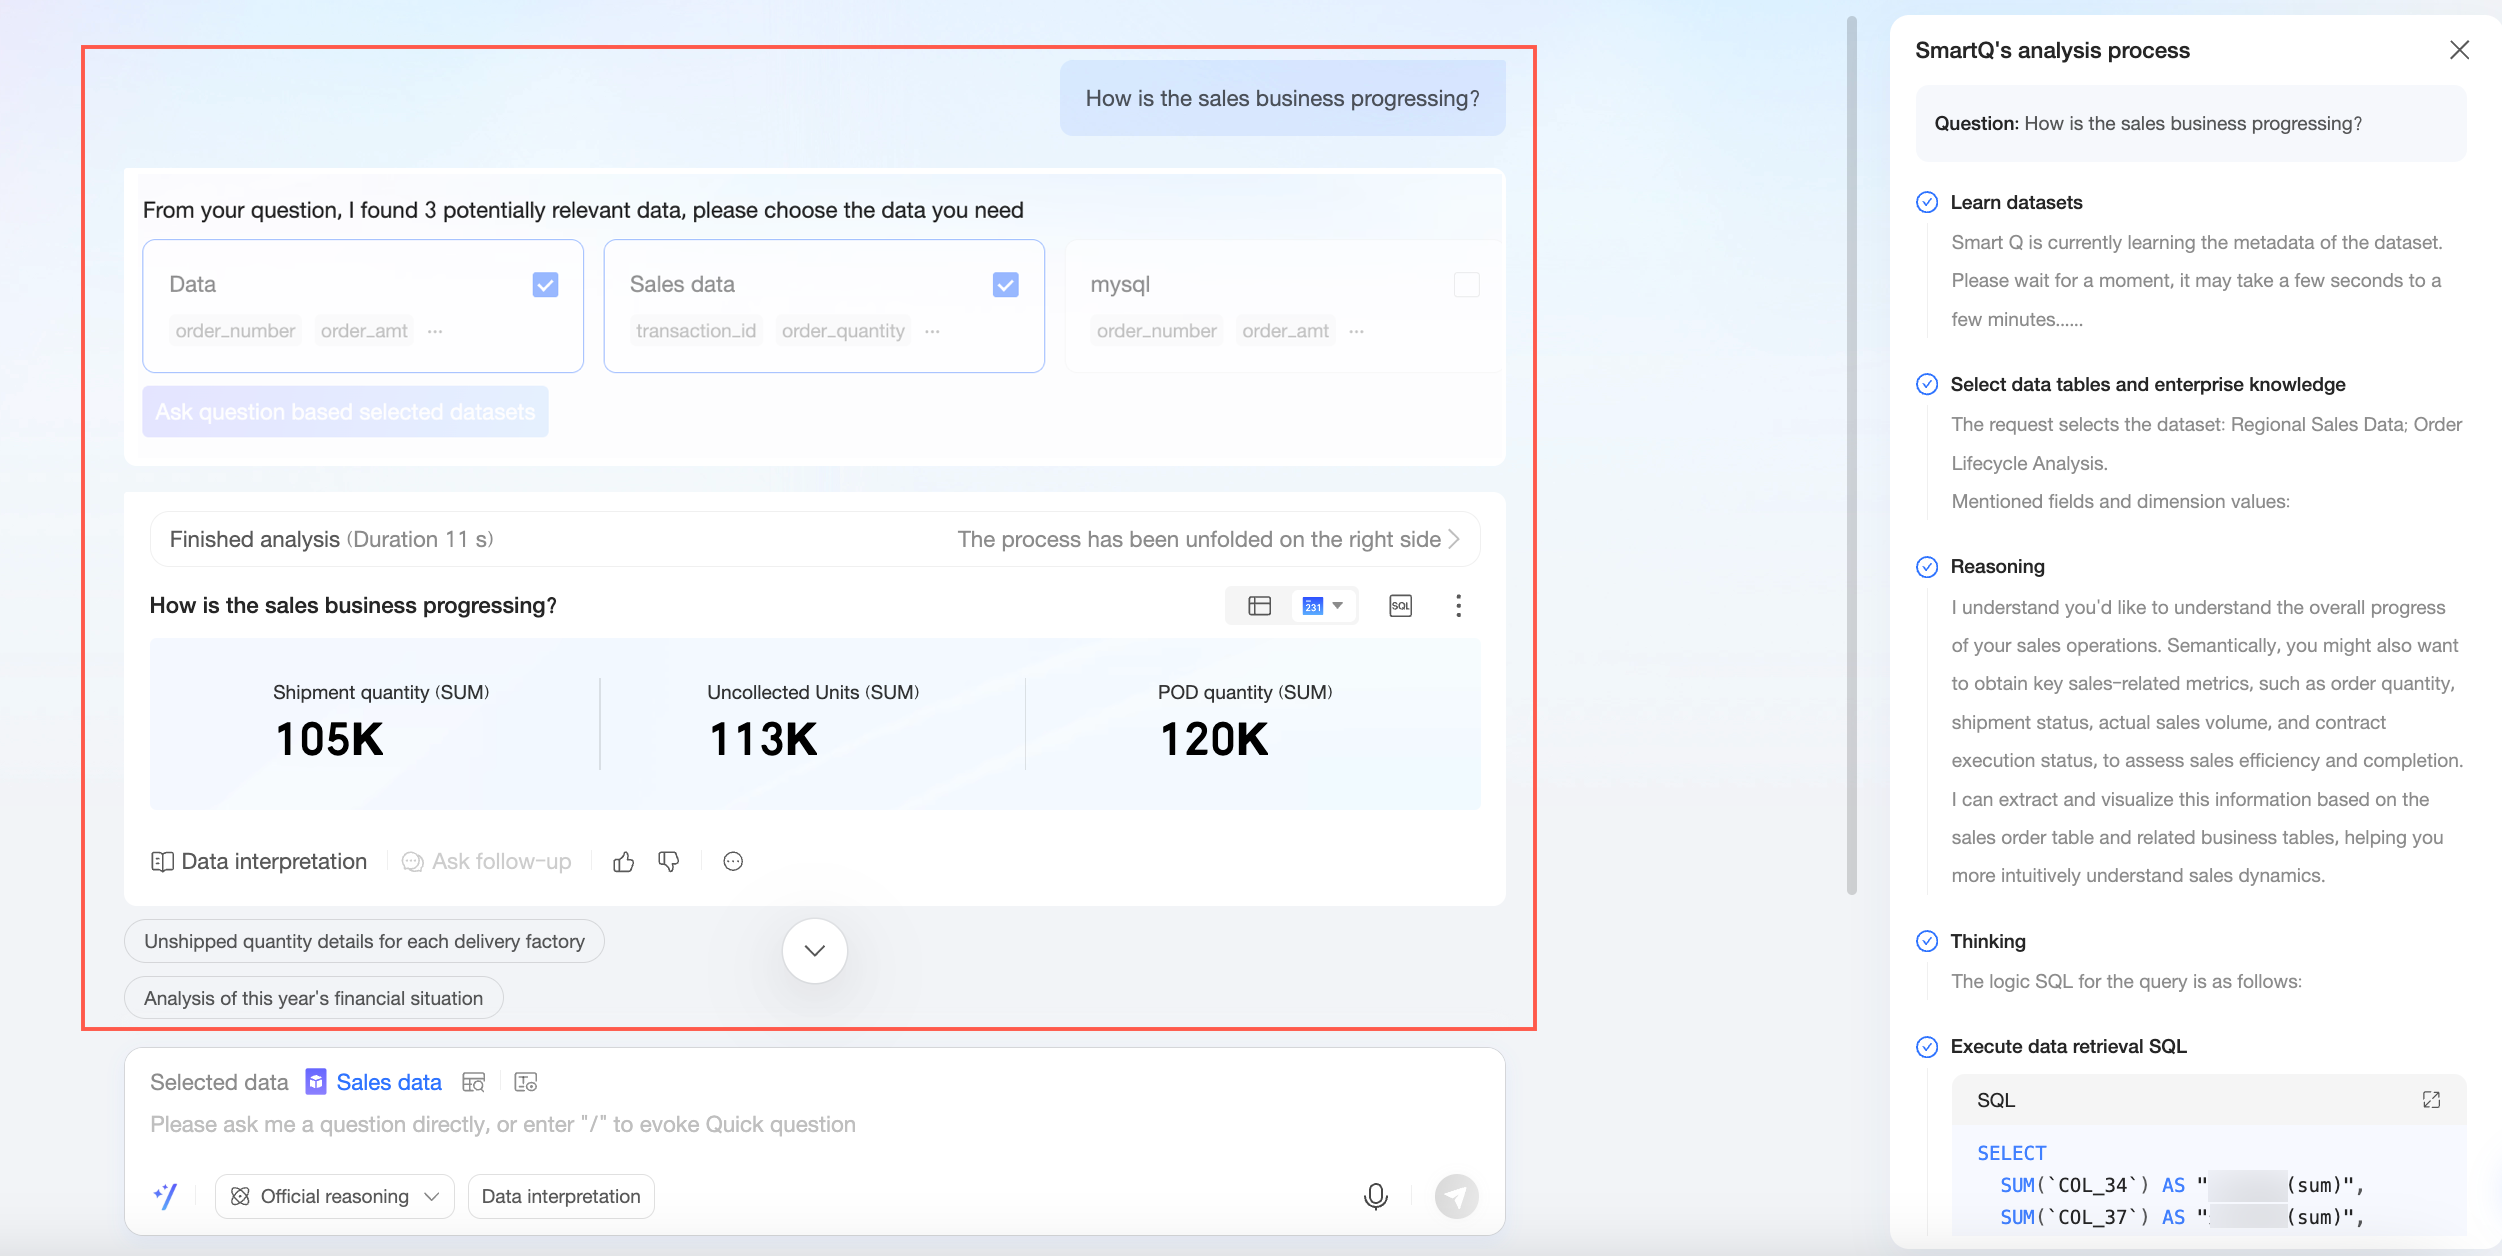
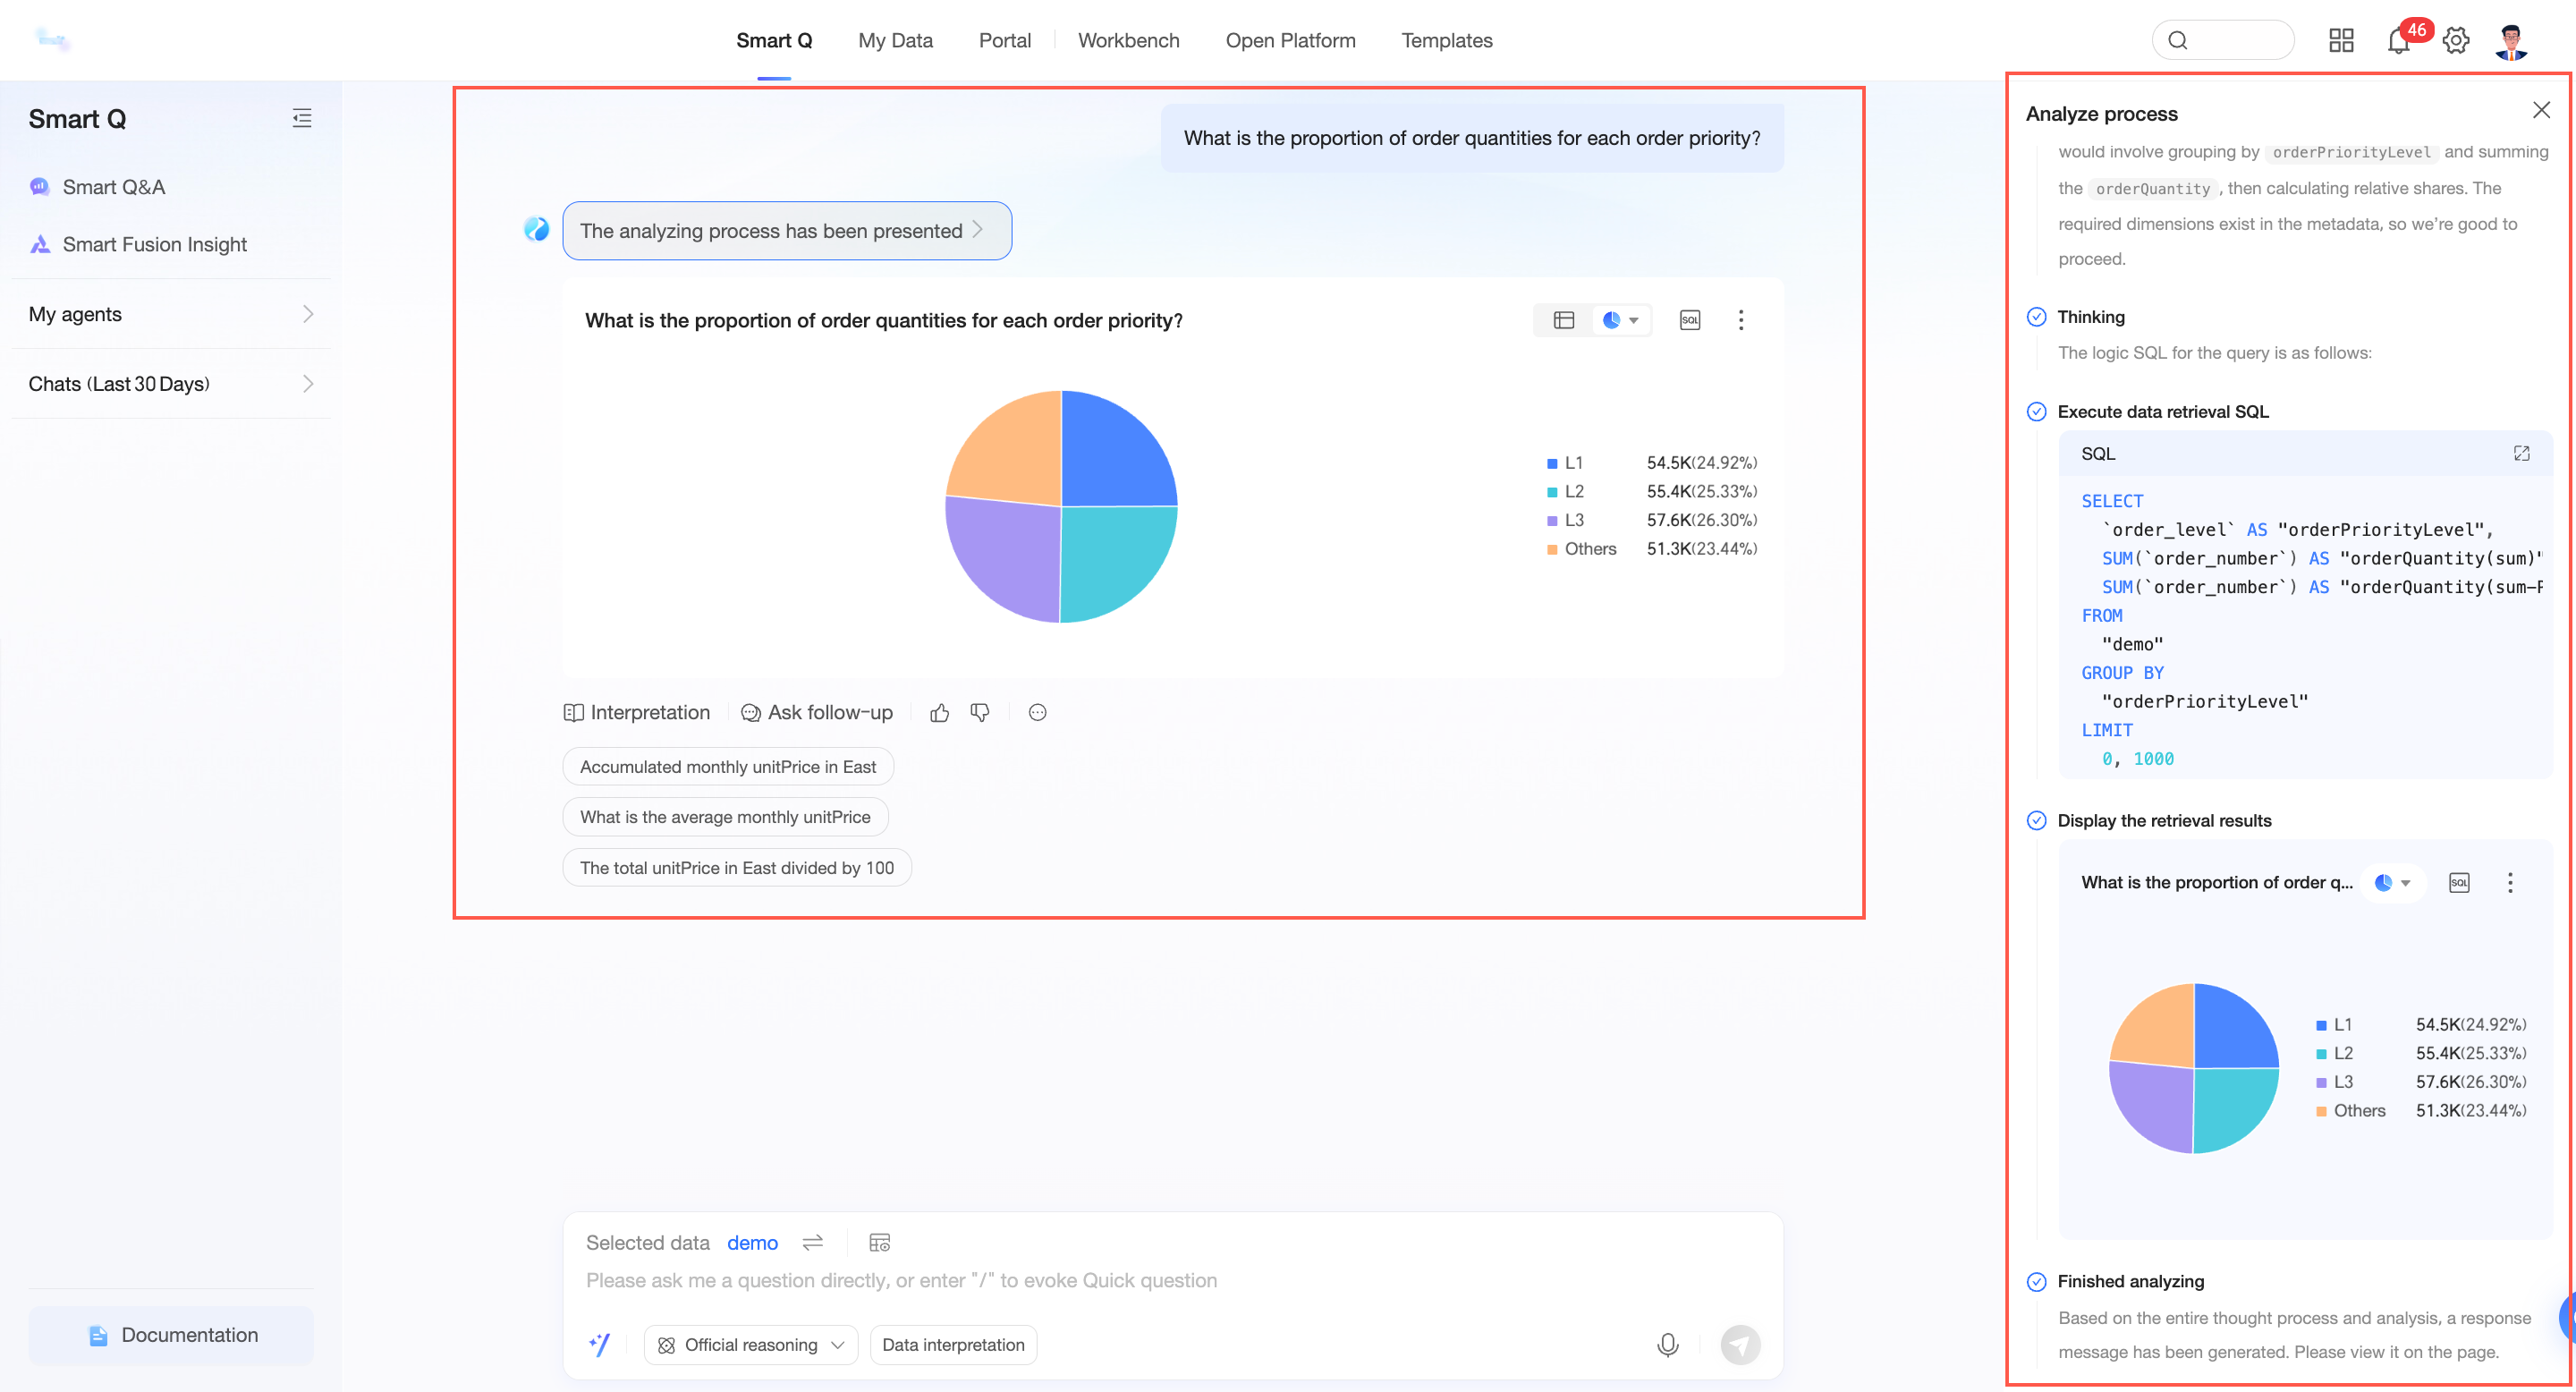
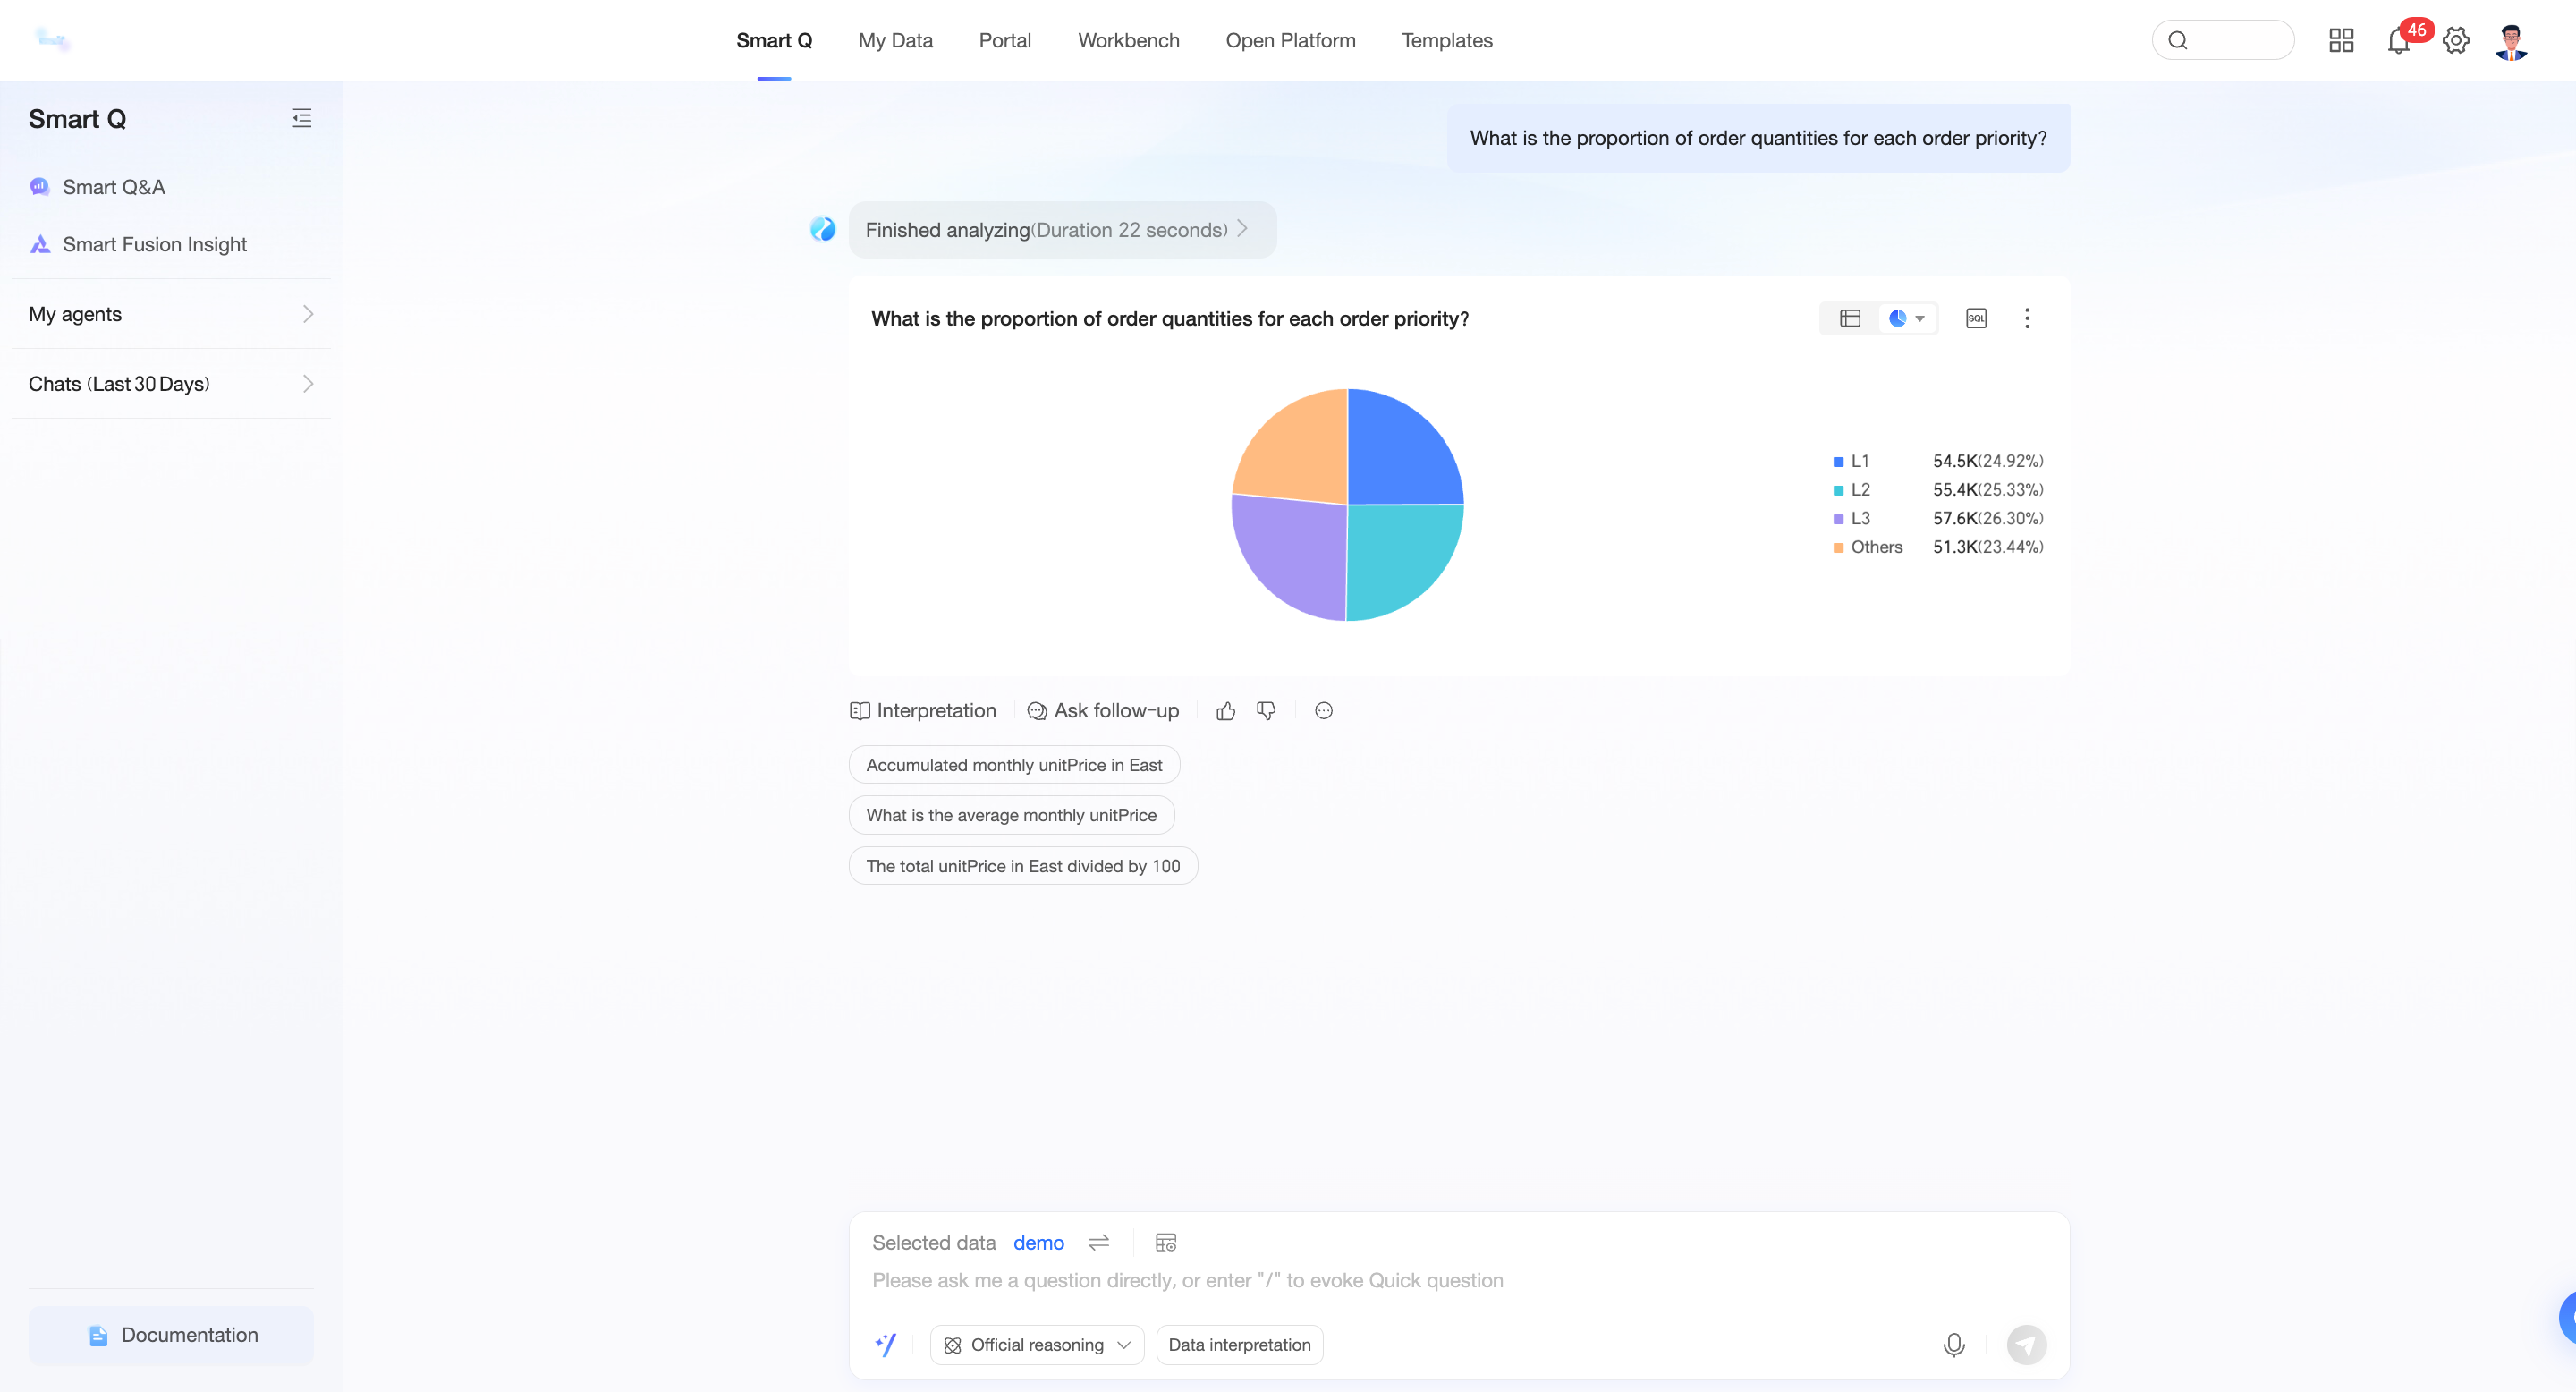
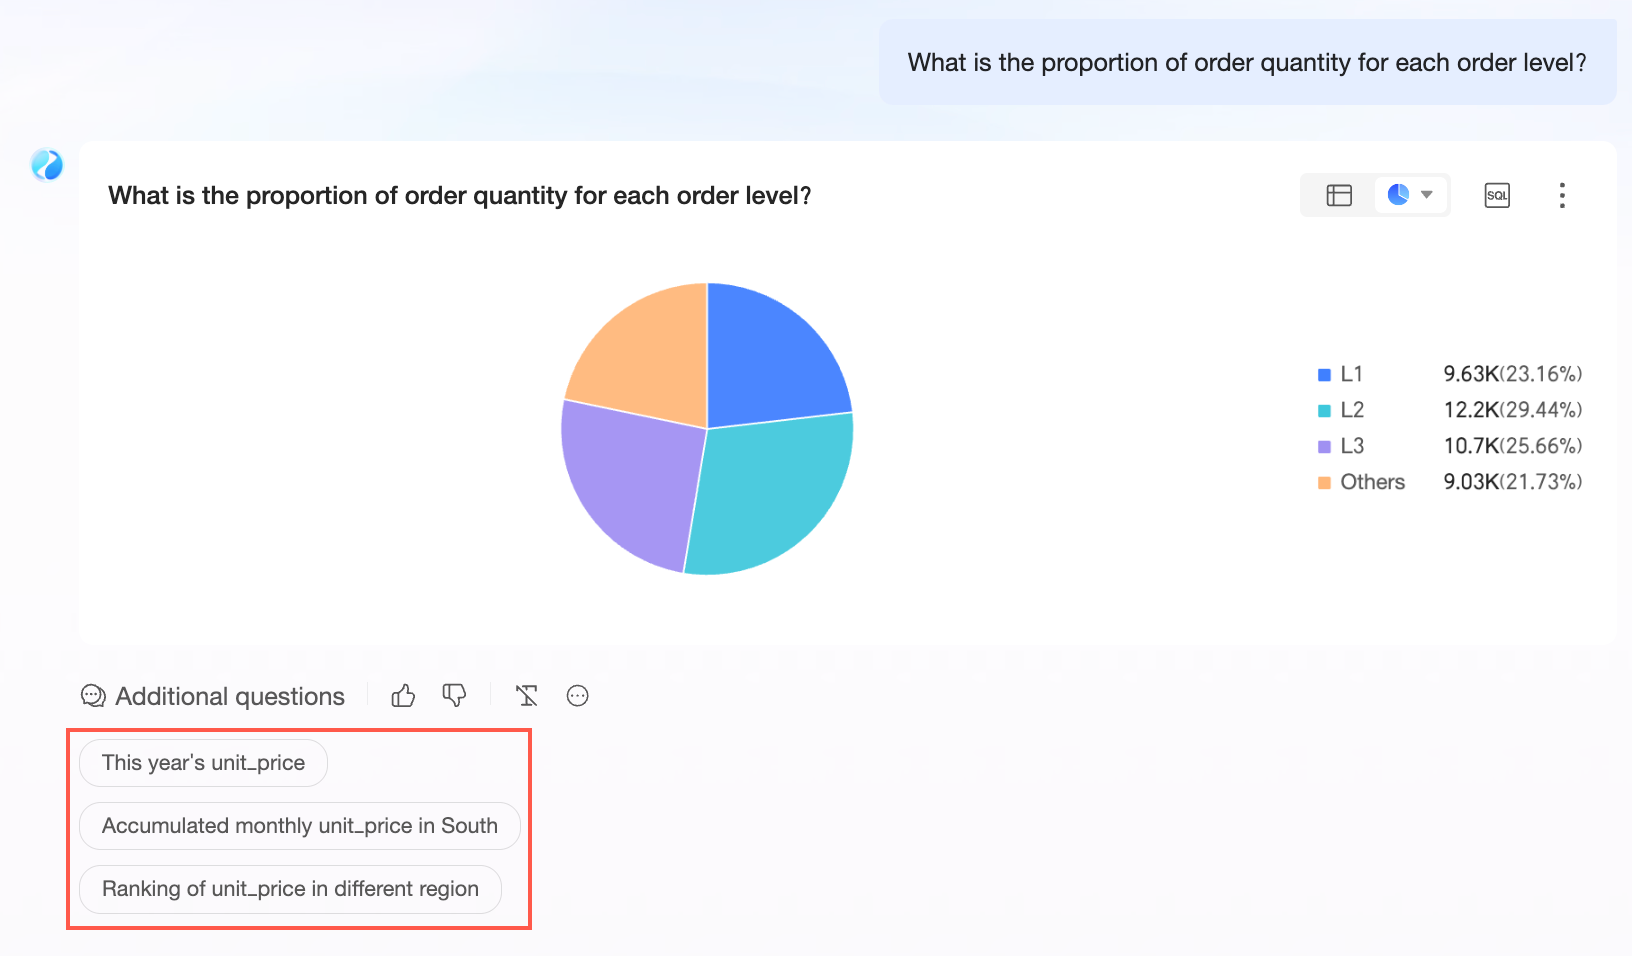
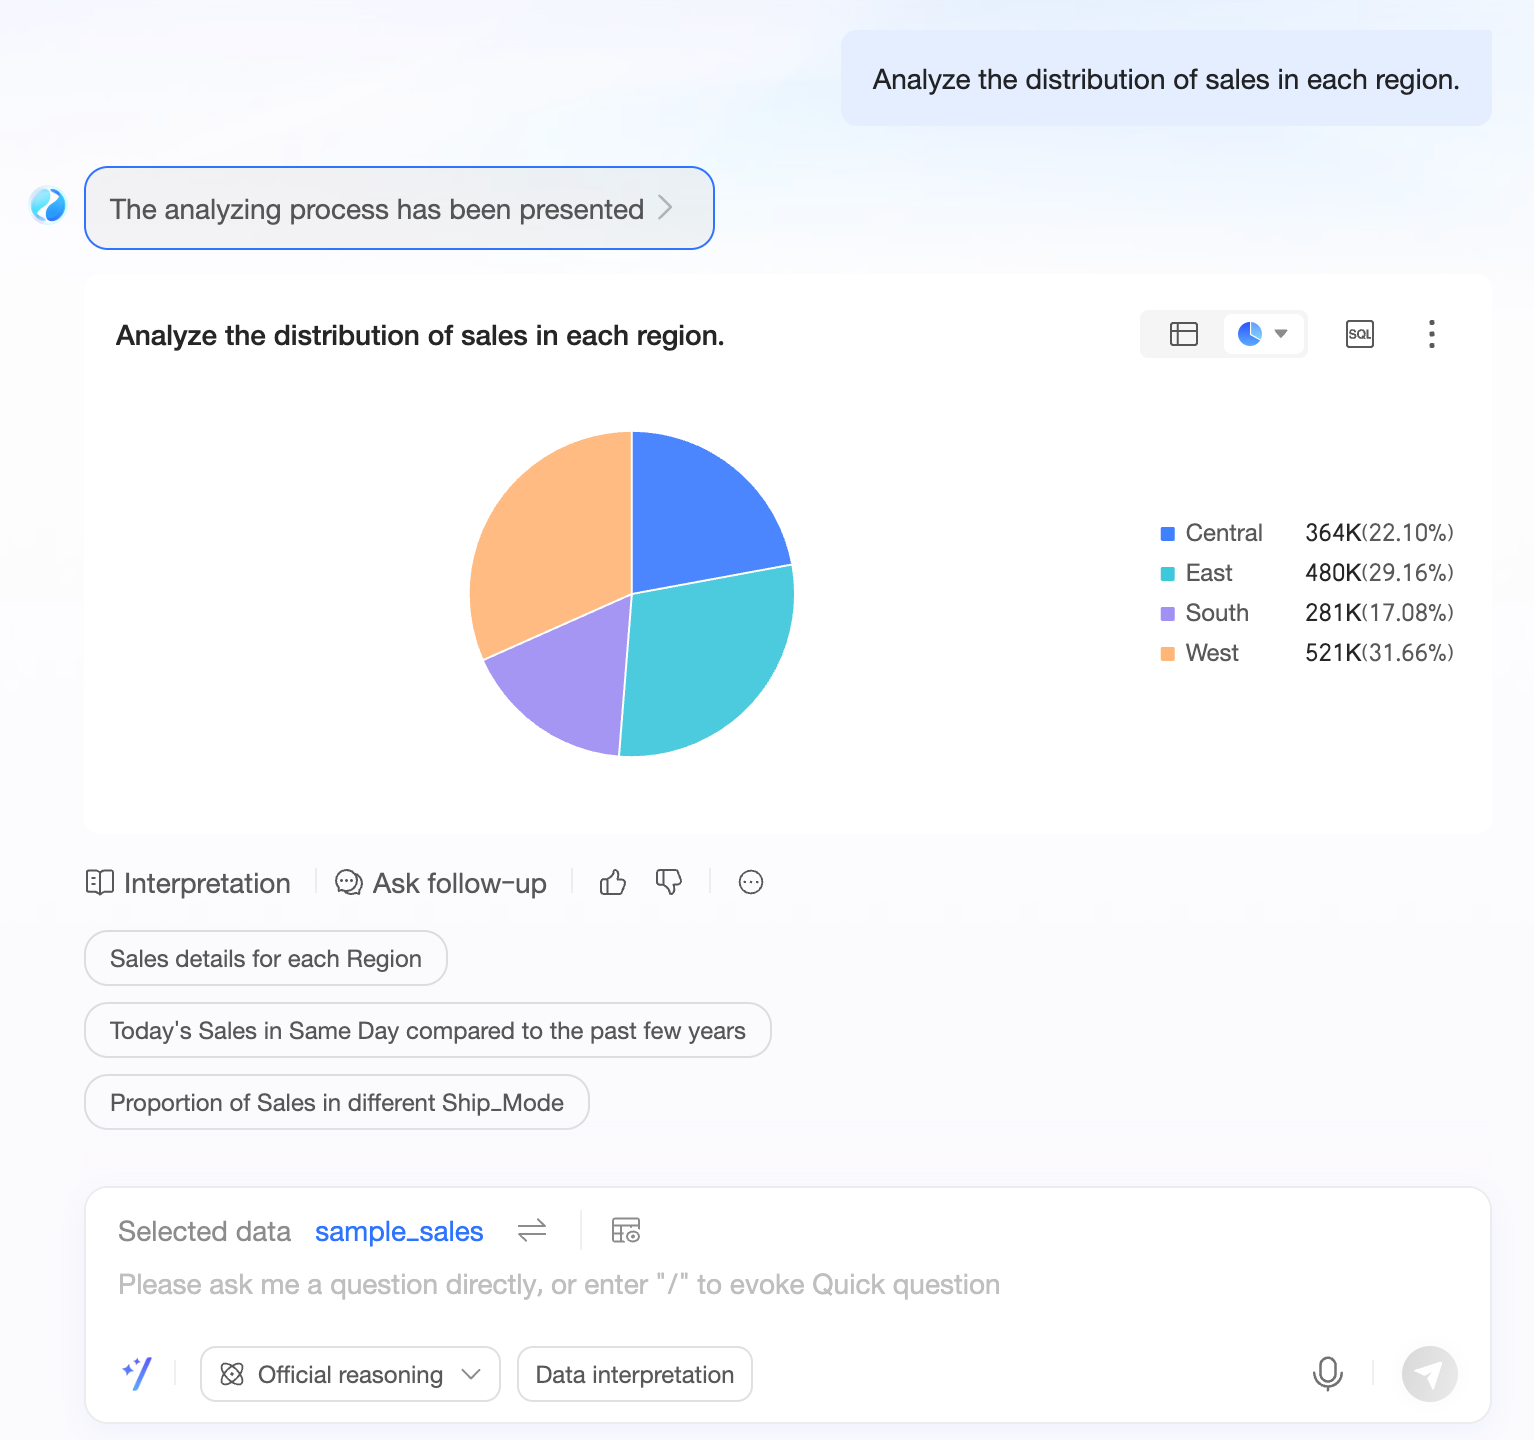
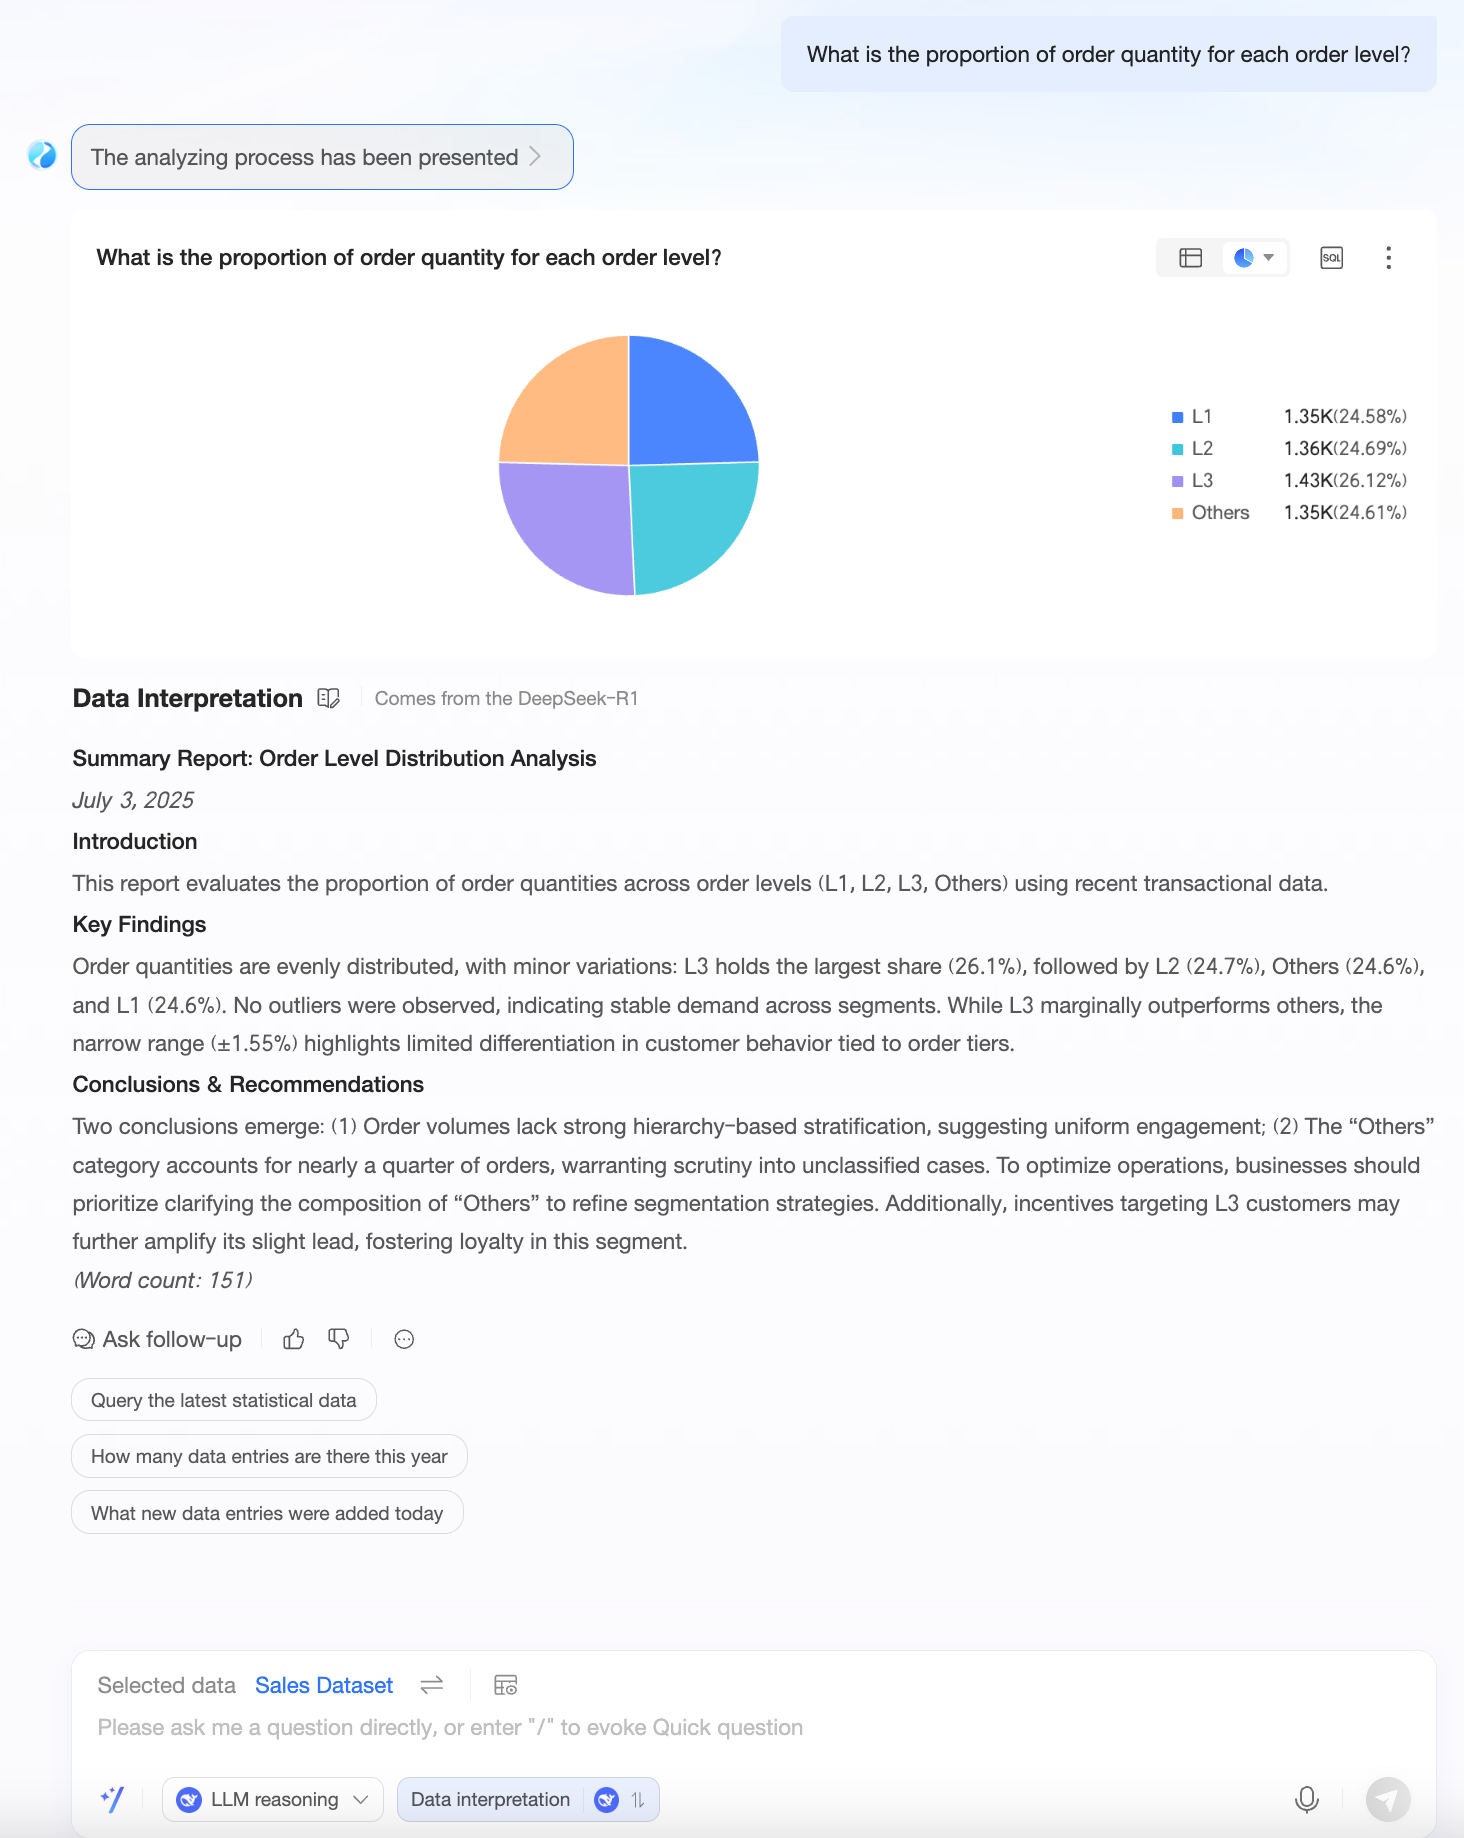
For example, type "What is the proportion of orders for each order level?" and send the question. The system returns the data analysis results and displays the analysis process on the right.
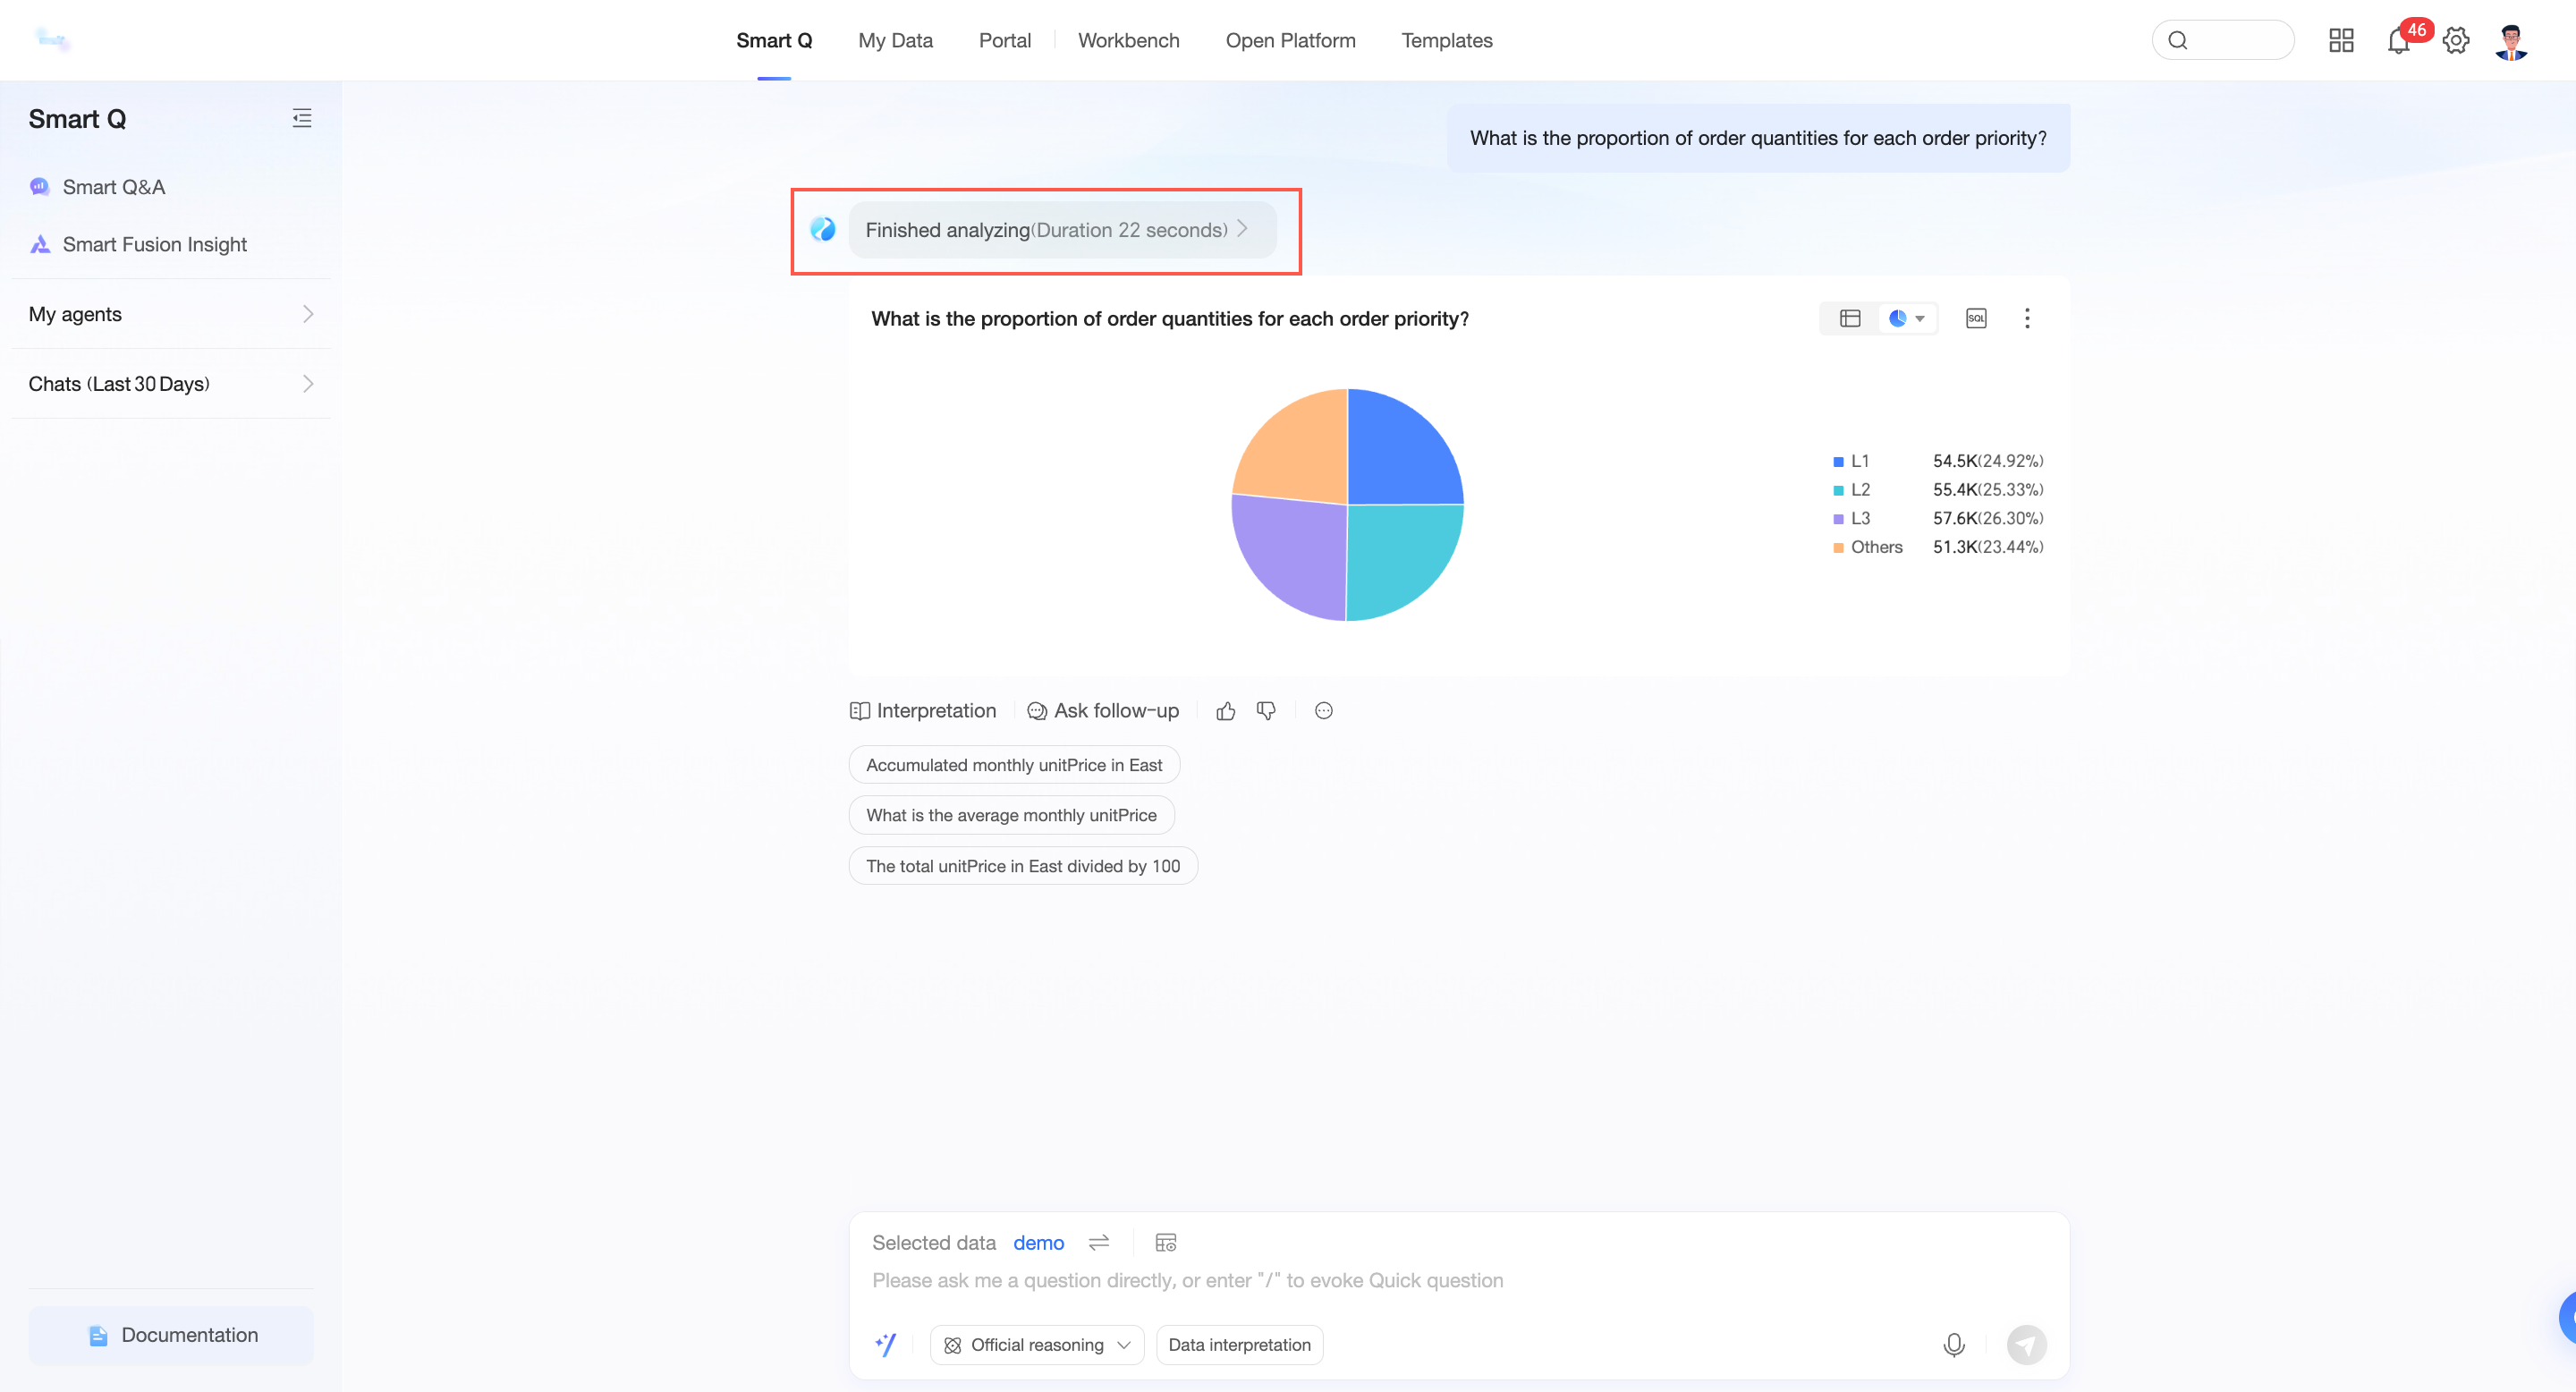
If you do not need to view the analysis process, click Analysis process expanded to hide it.
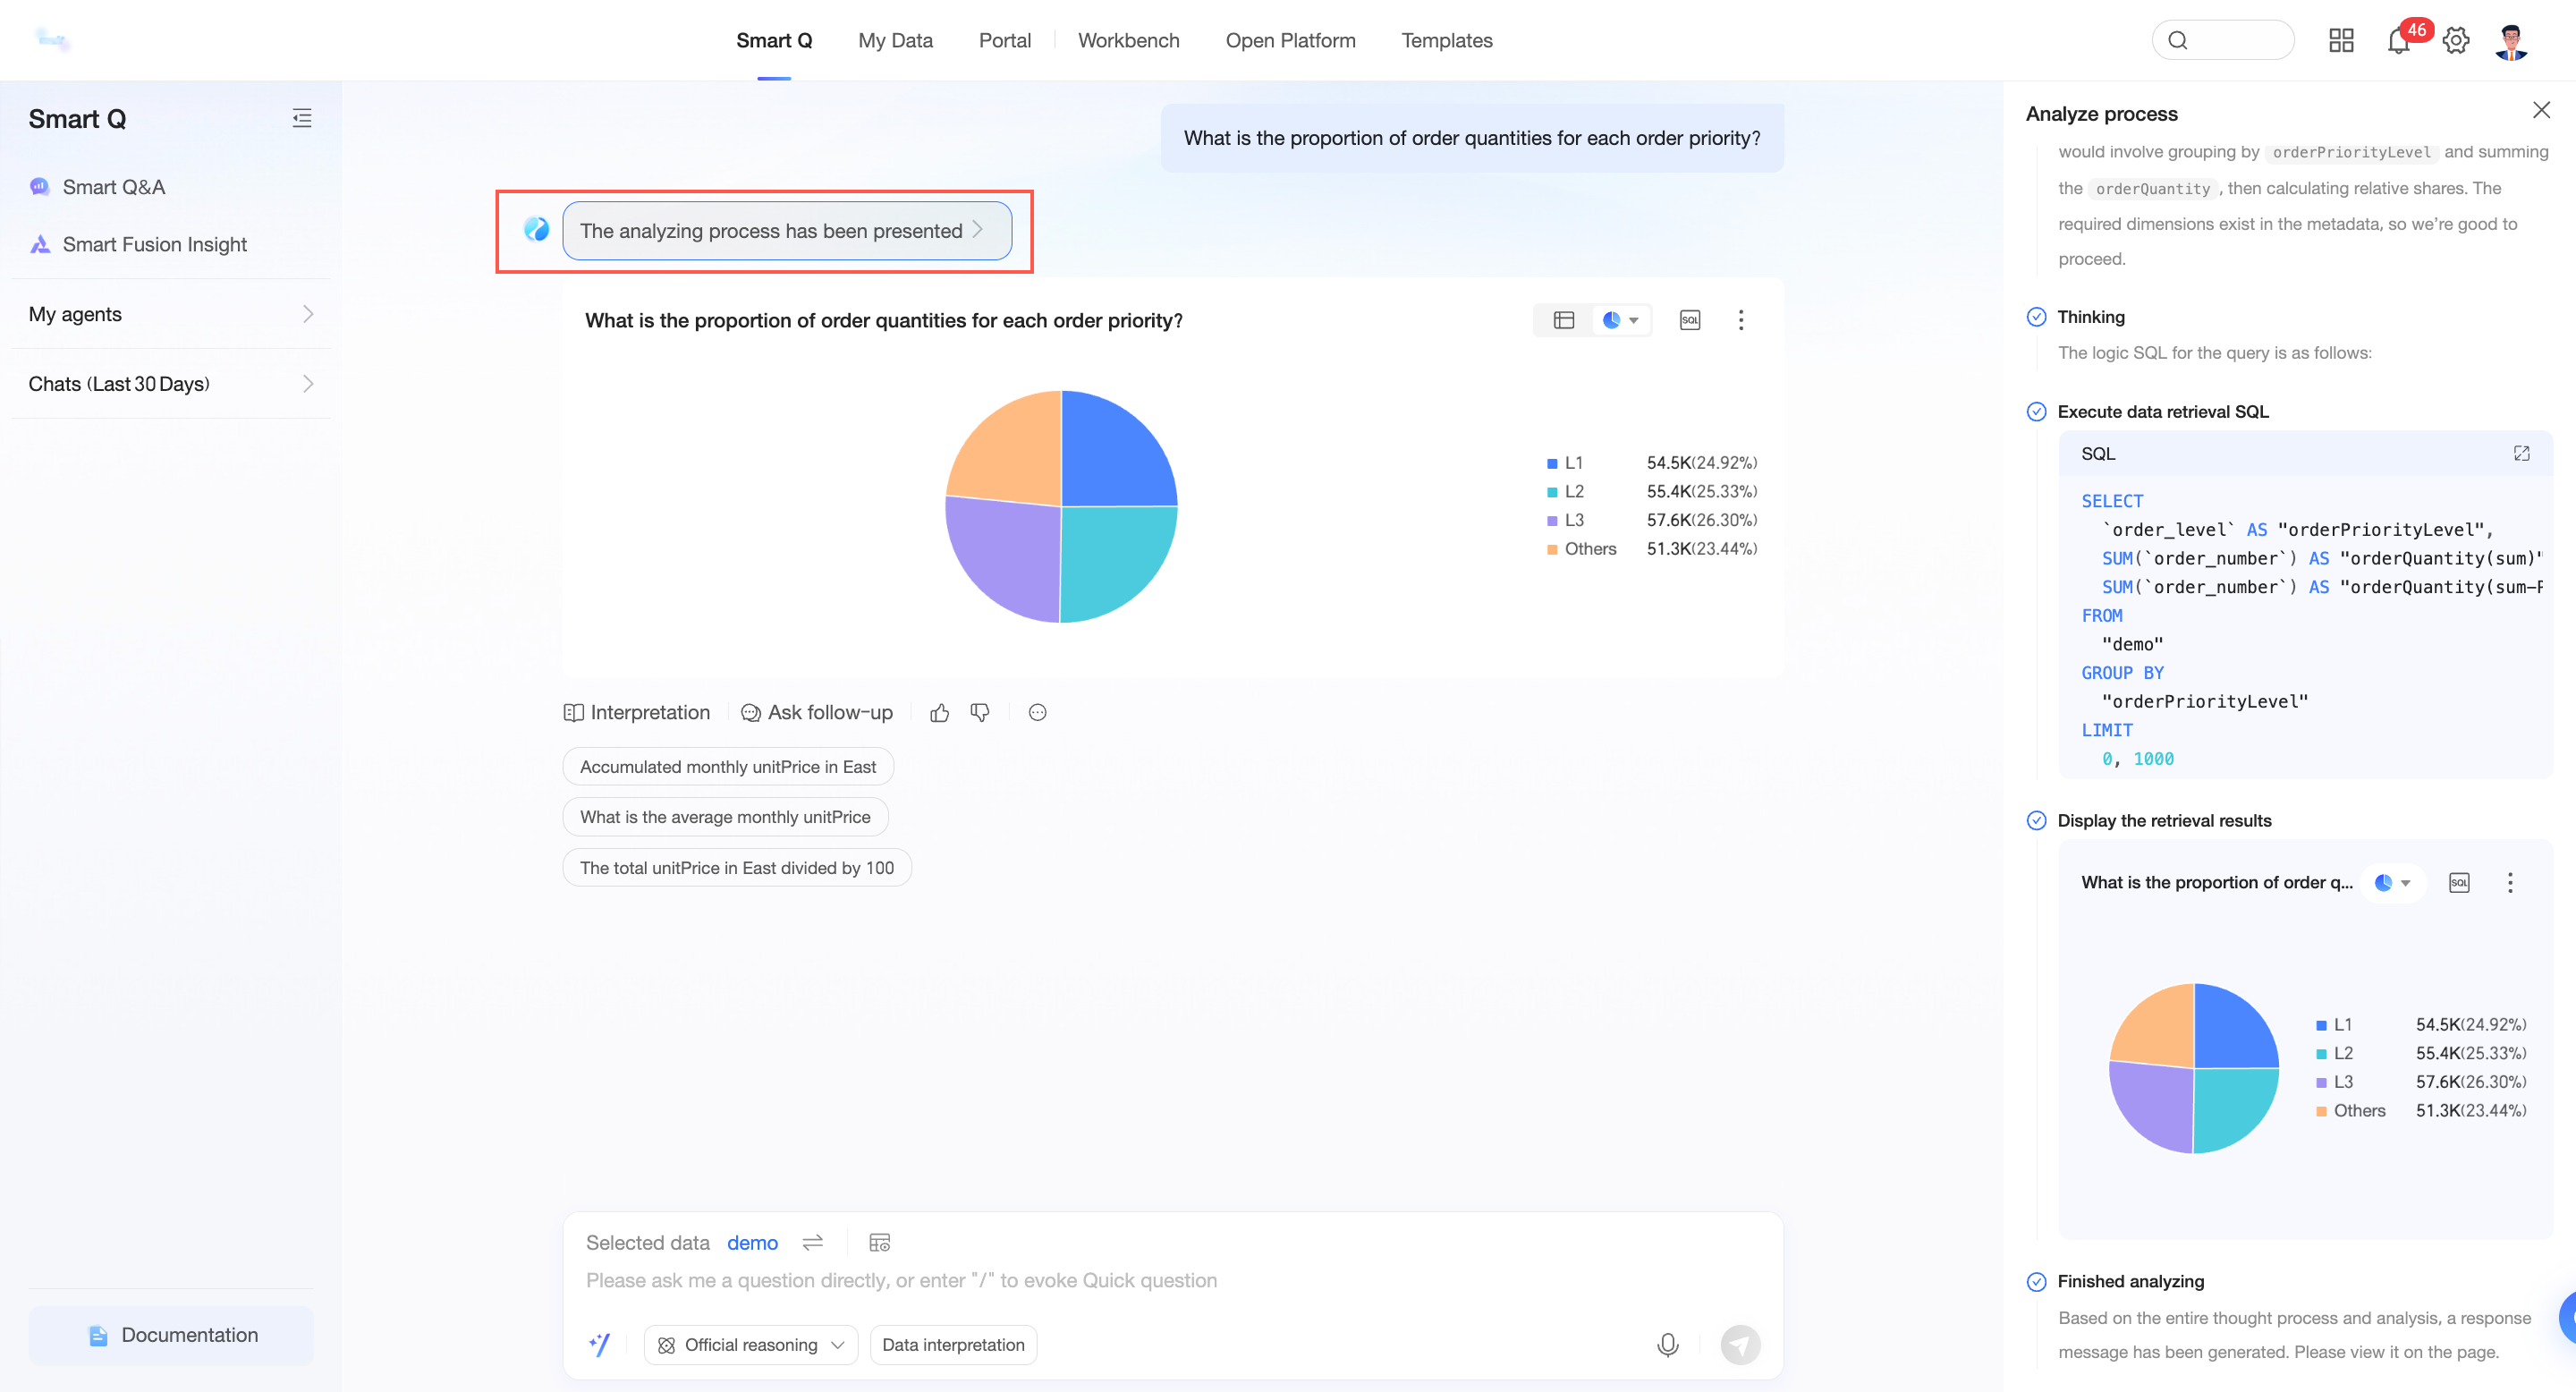
When the analysis process is hidden, only the chart is displayed.
To show the analysis process again, click Analysis complete.
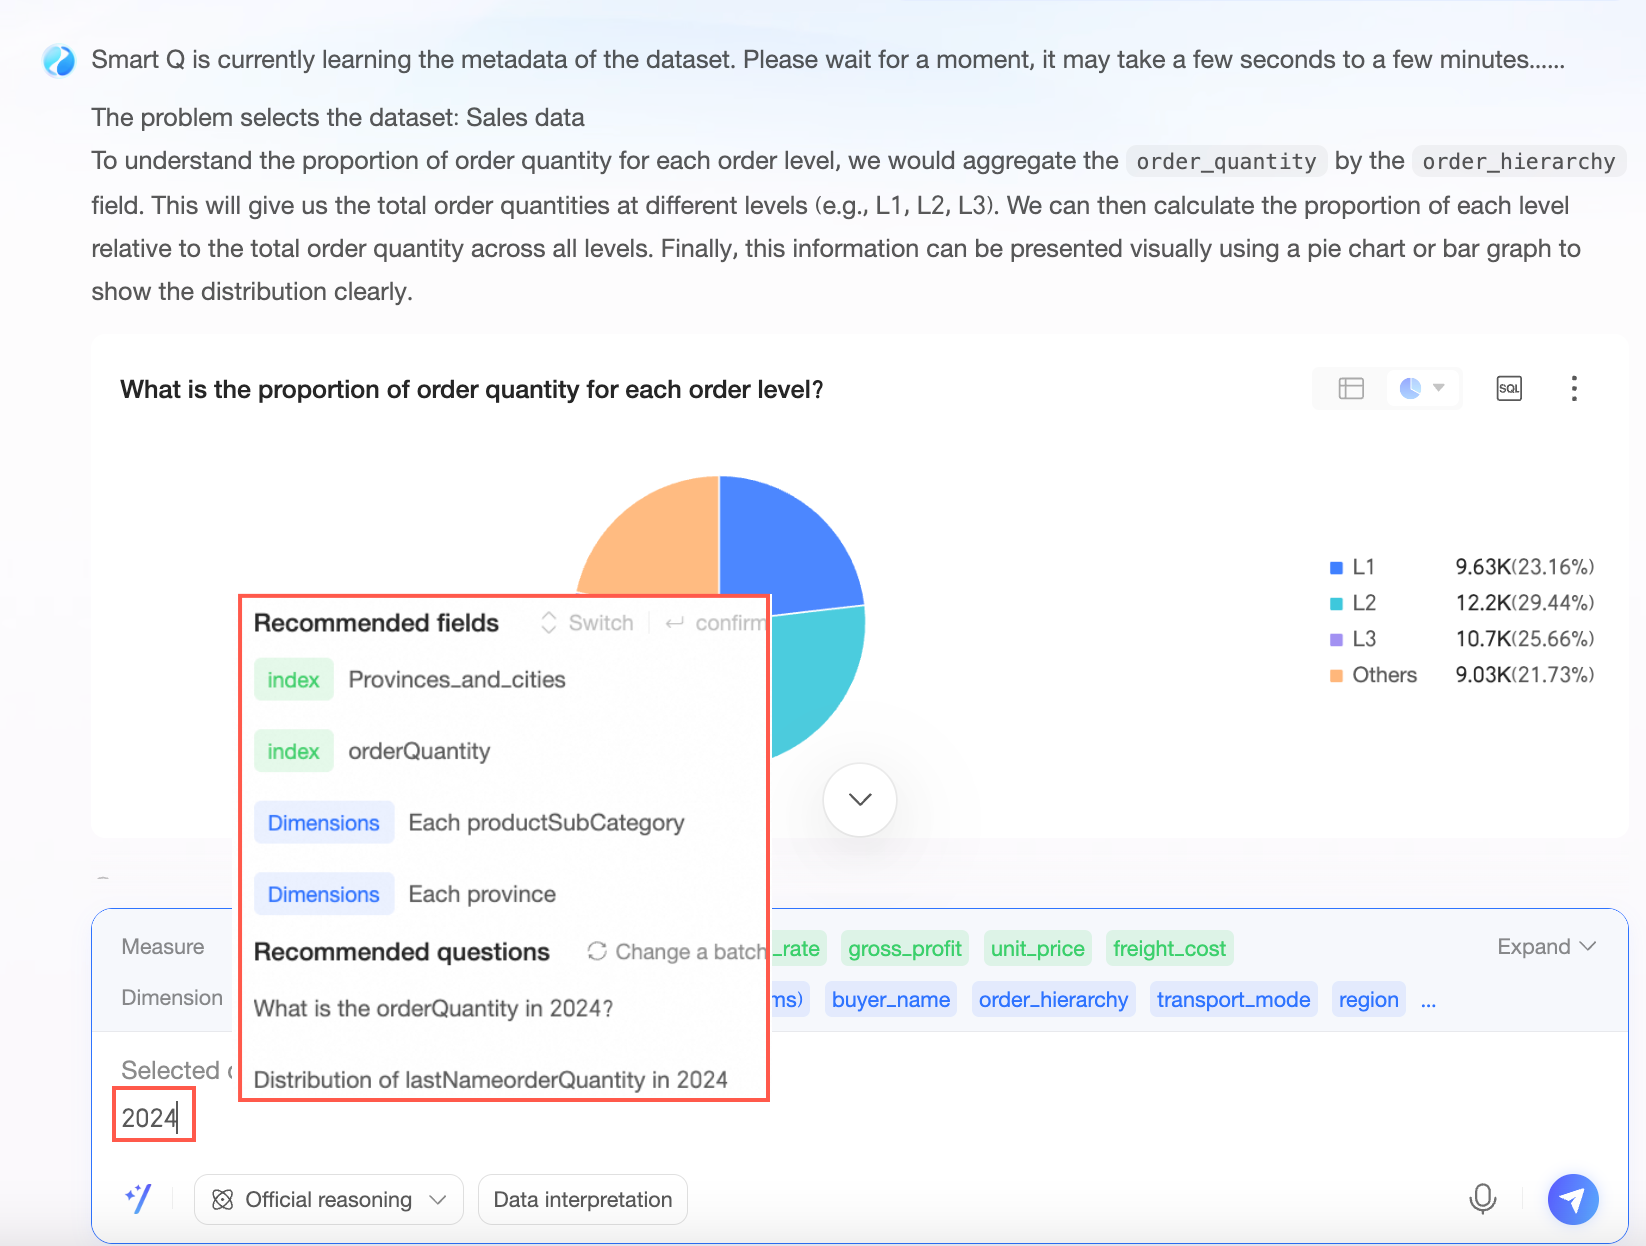
As you type, the system may provide recommended fields and recommended questions. For example, if you type "2024", the following recommendations appear. You can select the ones you need.
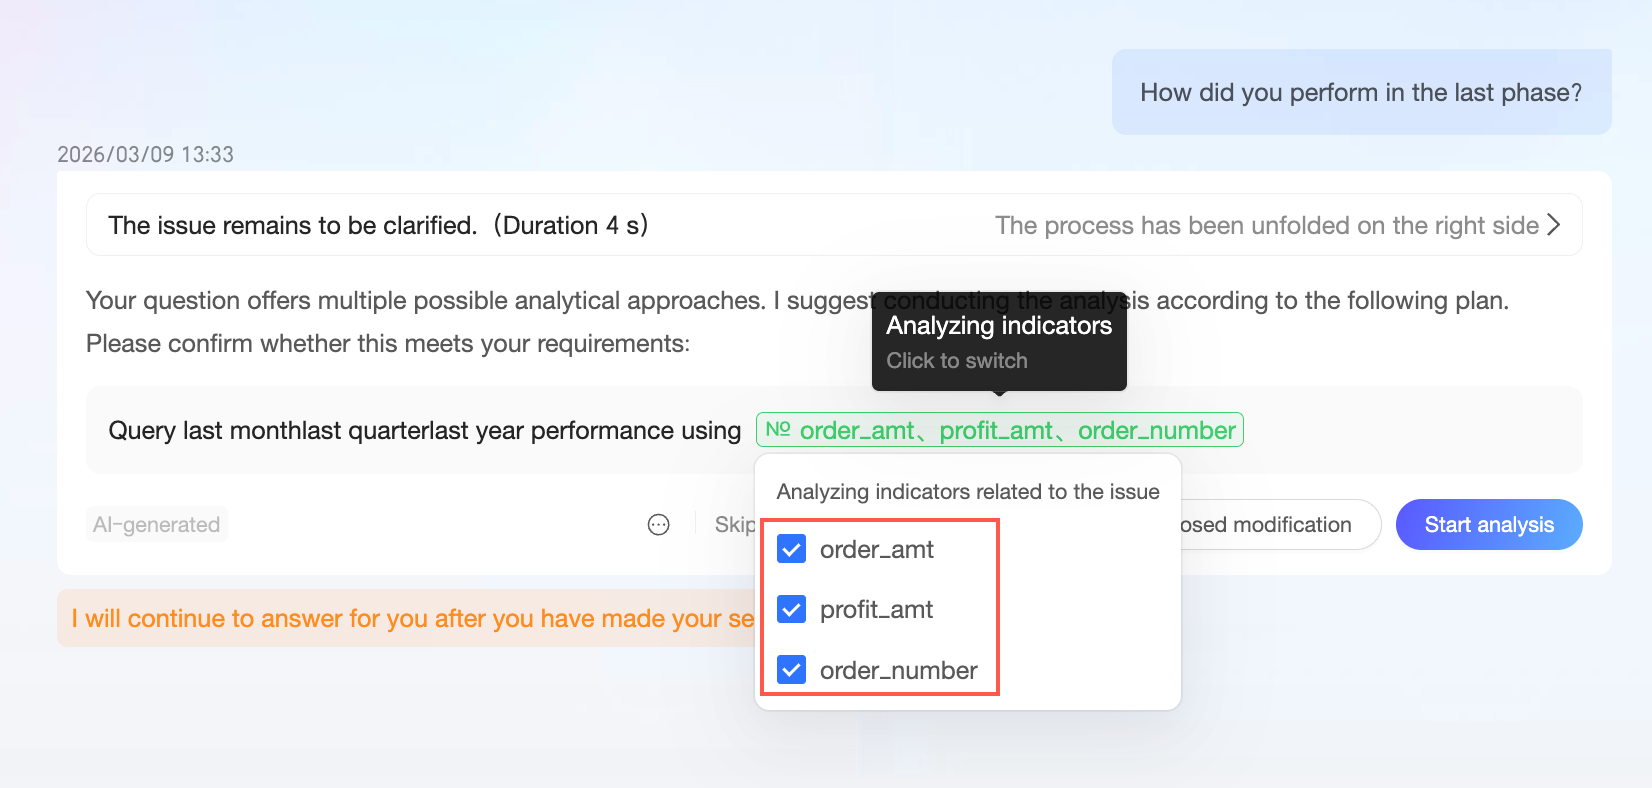
Question clarification
When this feature is enabled, Q Chat asks clarifying questions to provide more precise answers. This occurs if your question is missing key elements, such as a time frame or a metric, or if it contains ambiguities between multiple metrics. For more information, see Enable Question Clarification.
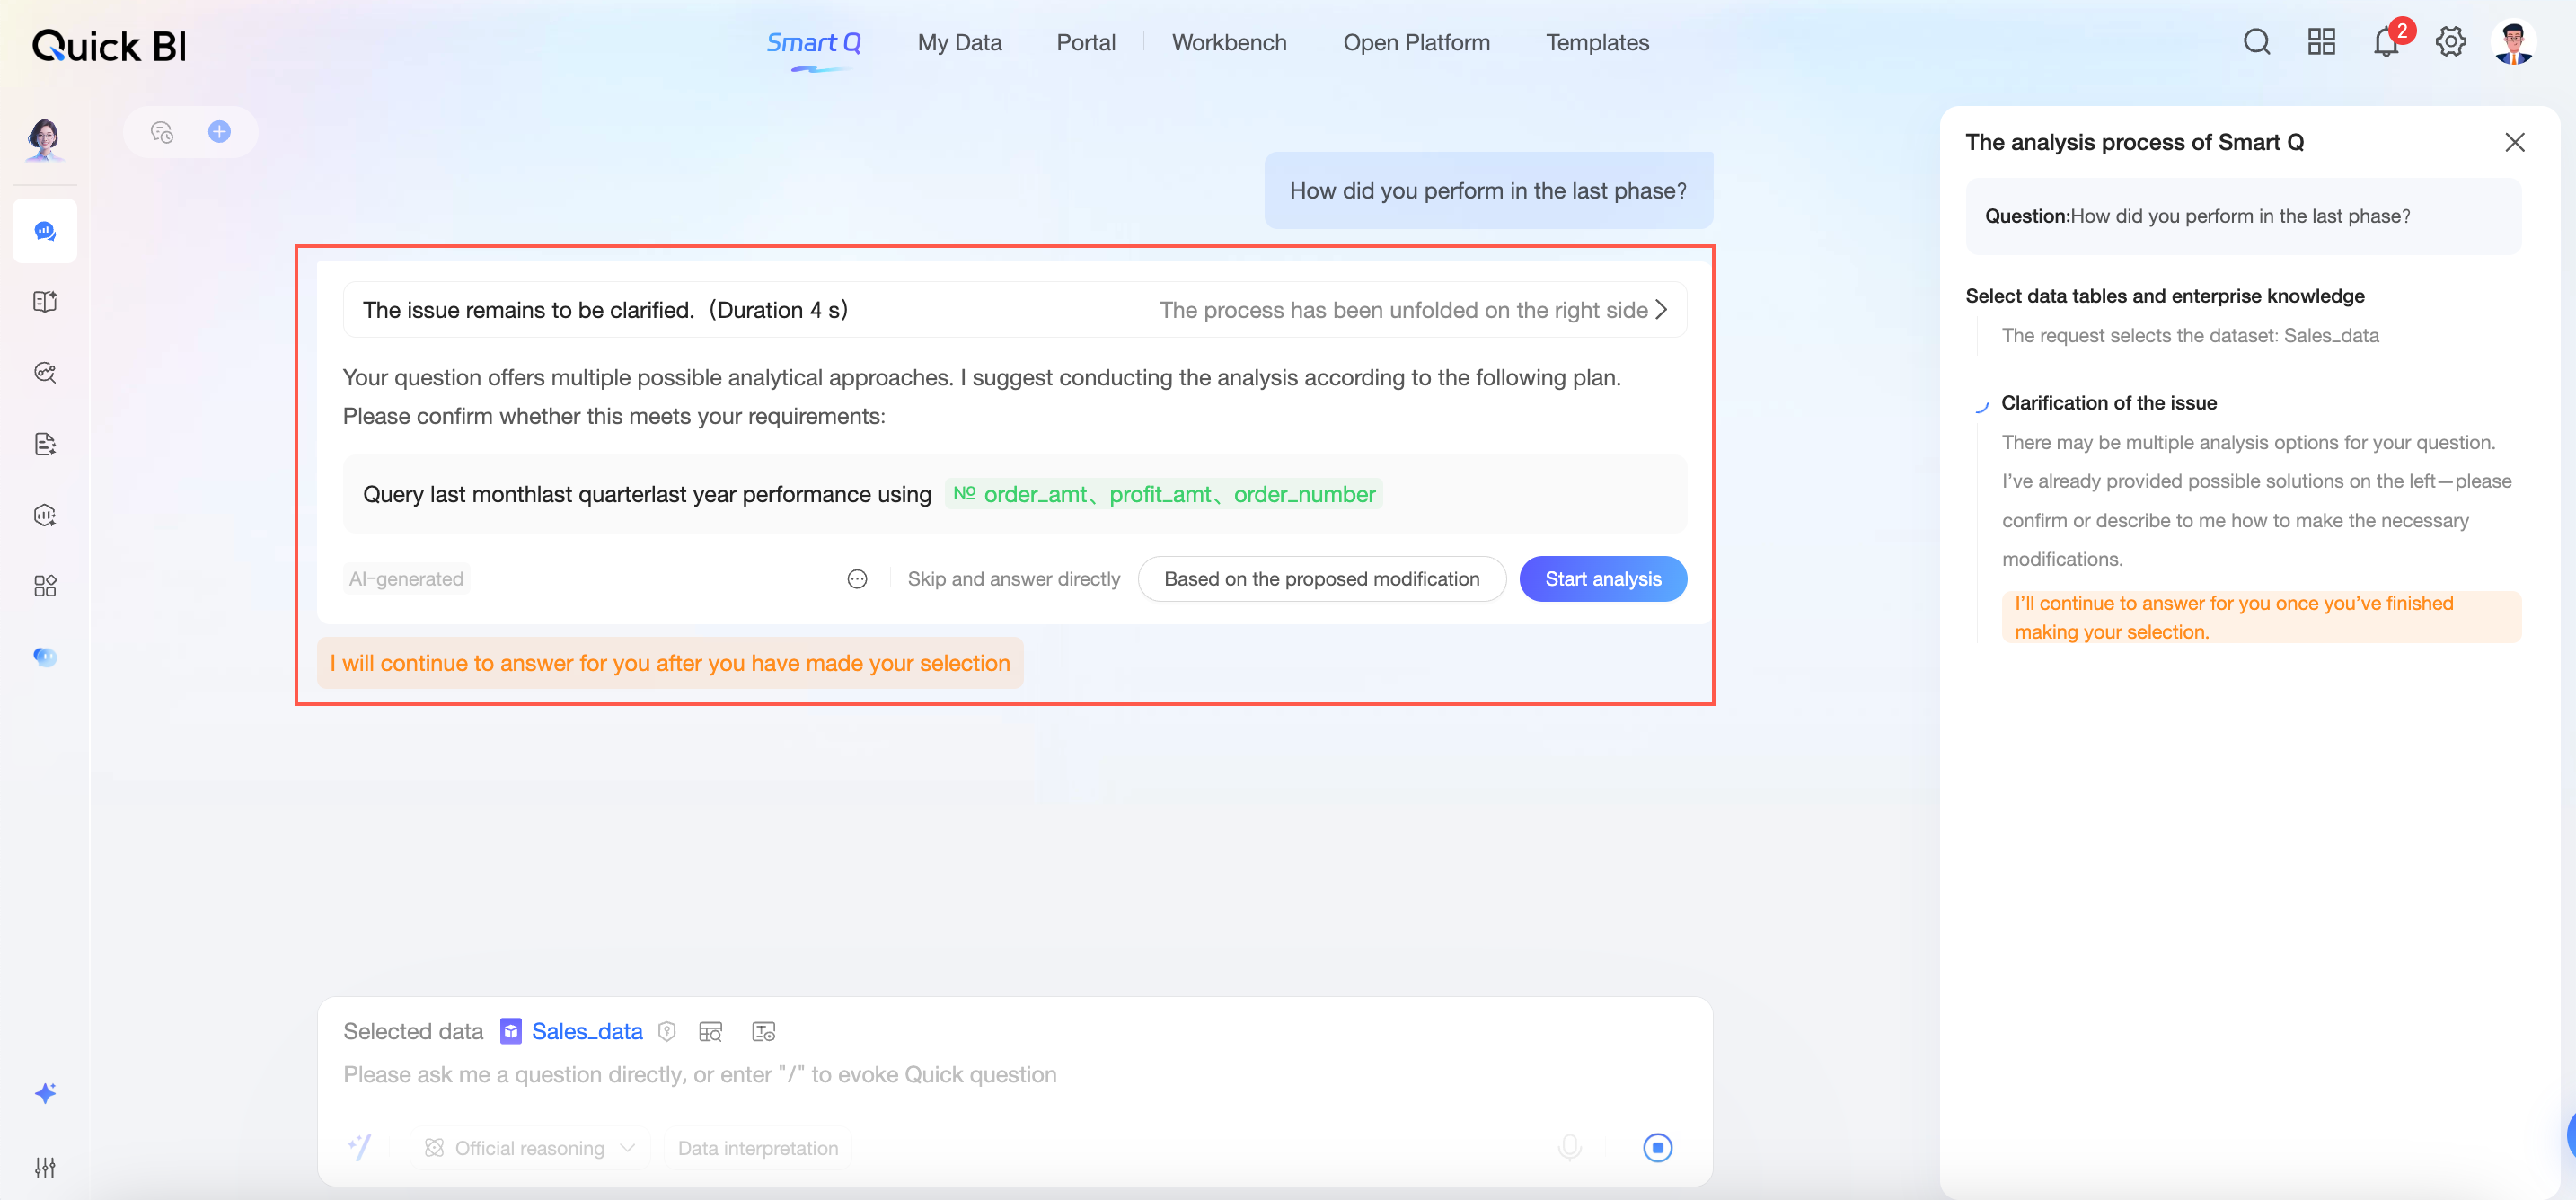
In the question clarification dialog box, you can adjust the time period and analysis metric, then click Start Analysis.
You can also modify the question based on the proposed plan.
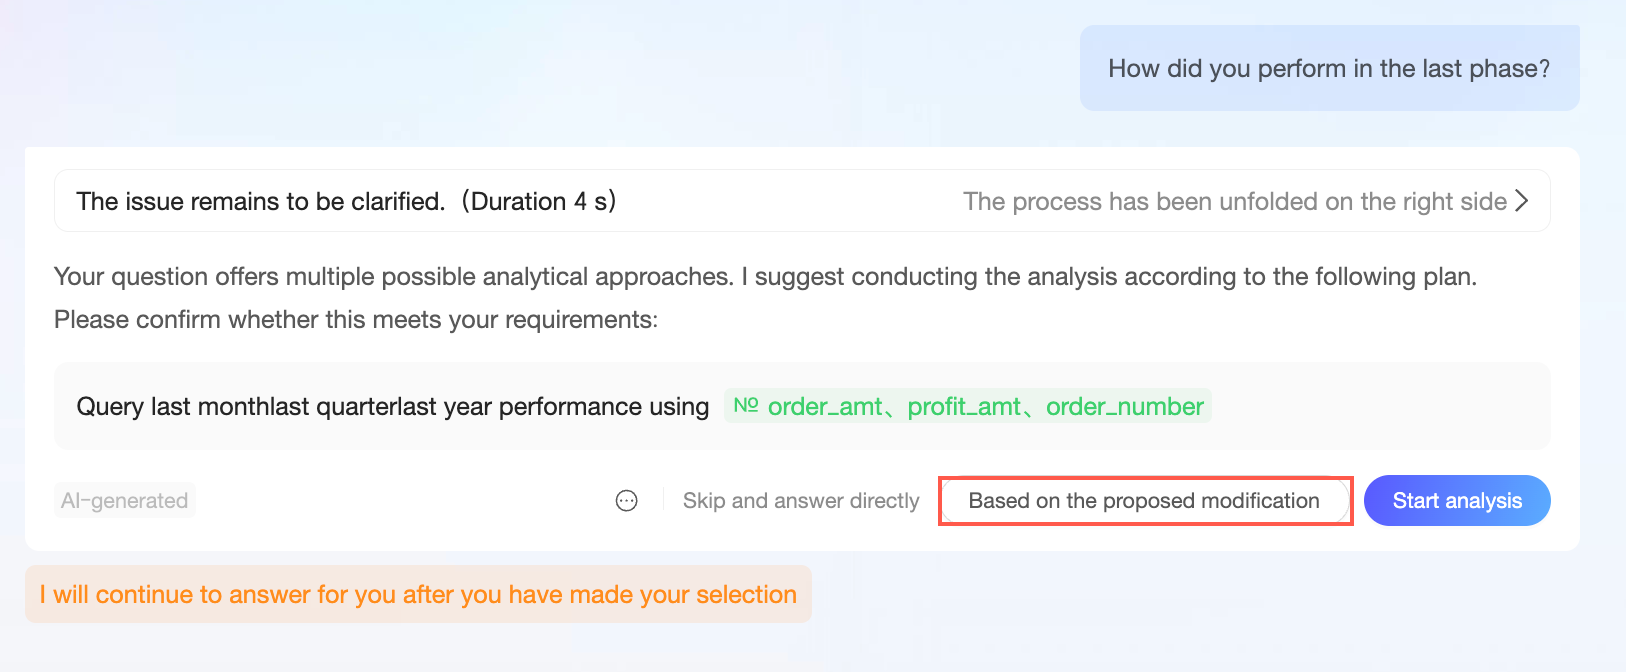
Alternatively, select Skip and answer directly to get an answer to your original question.
Favorite a question
You can favorite a maximum of 30 questions.
Click the
 icon to the left of a question to add it to your favorites.
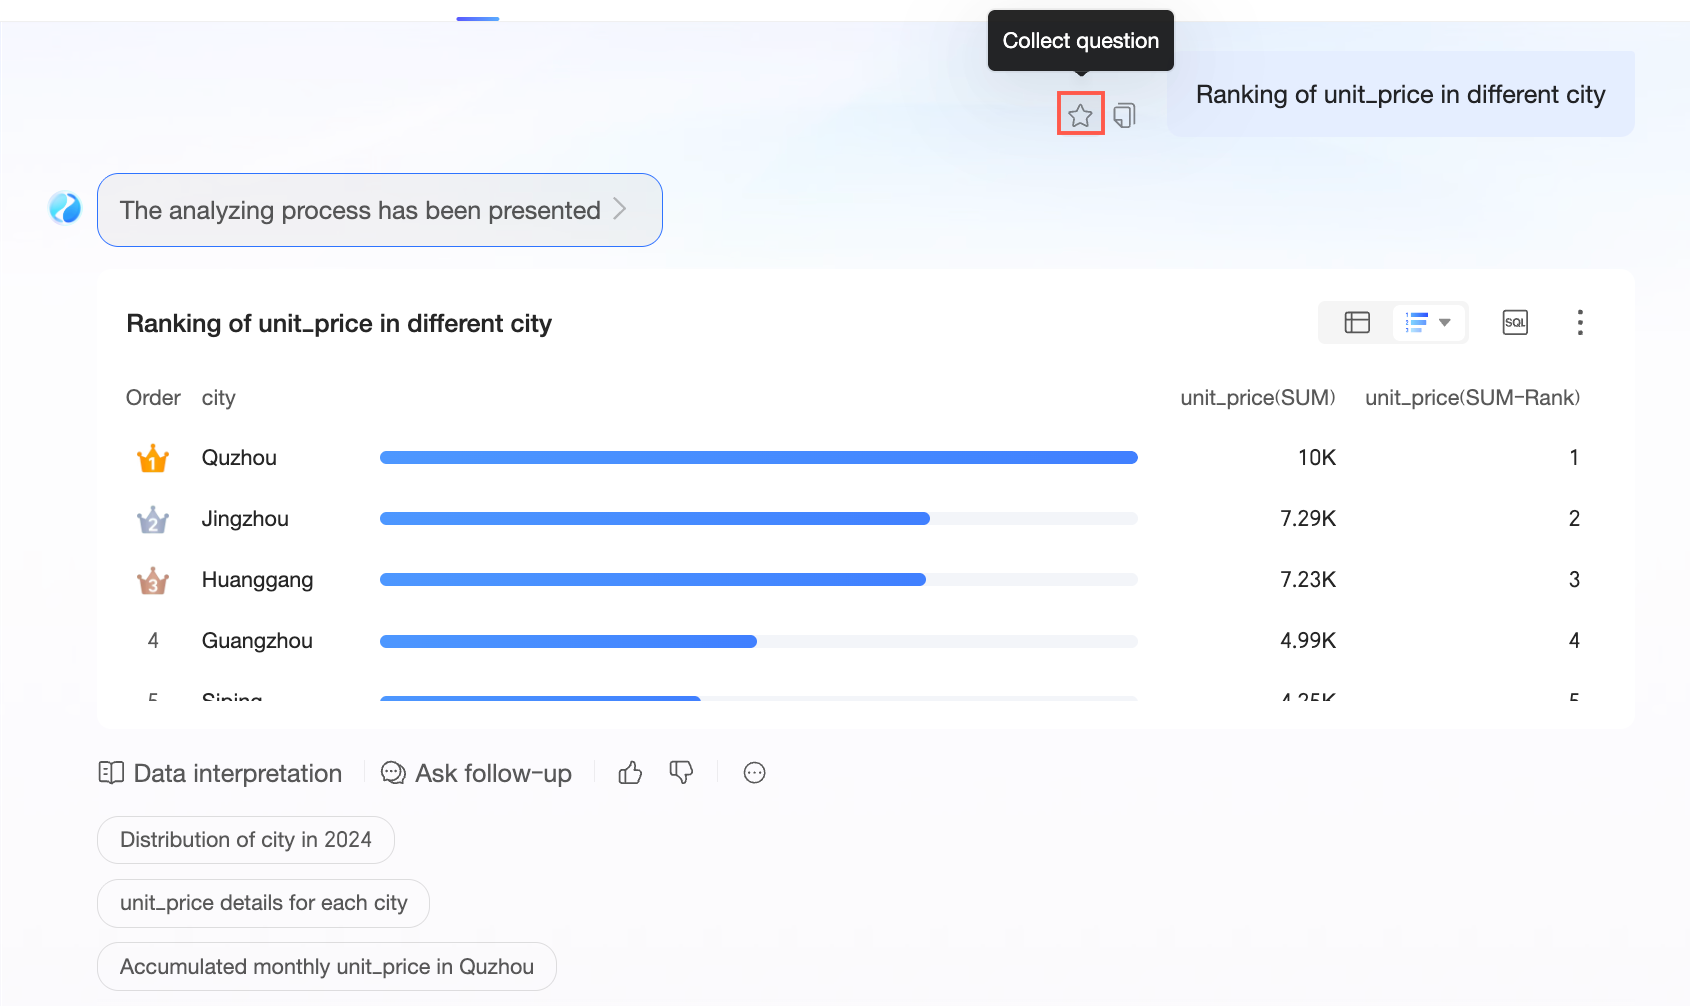
You can access favorited questions from the quick query menu.
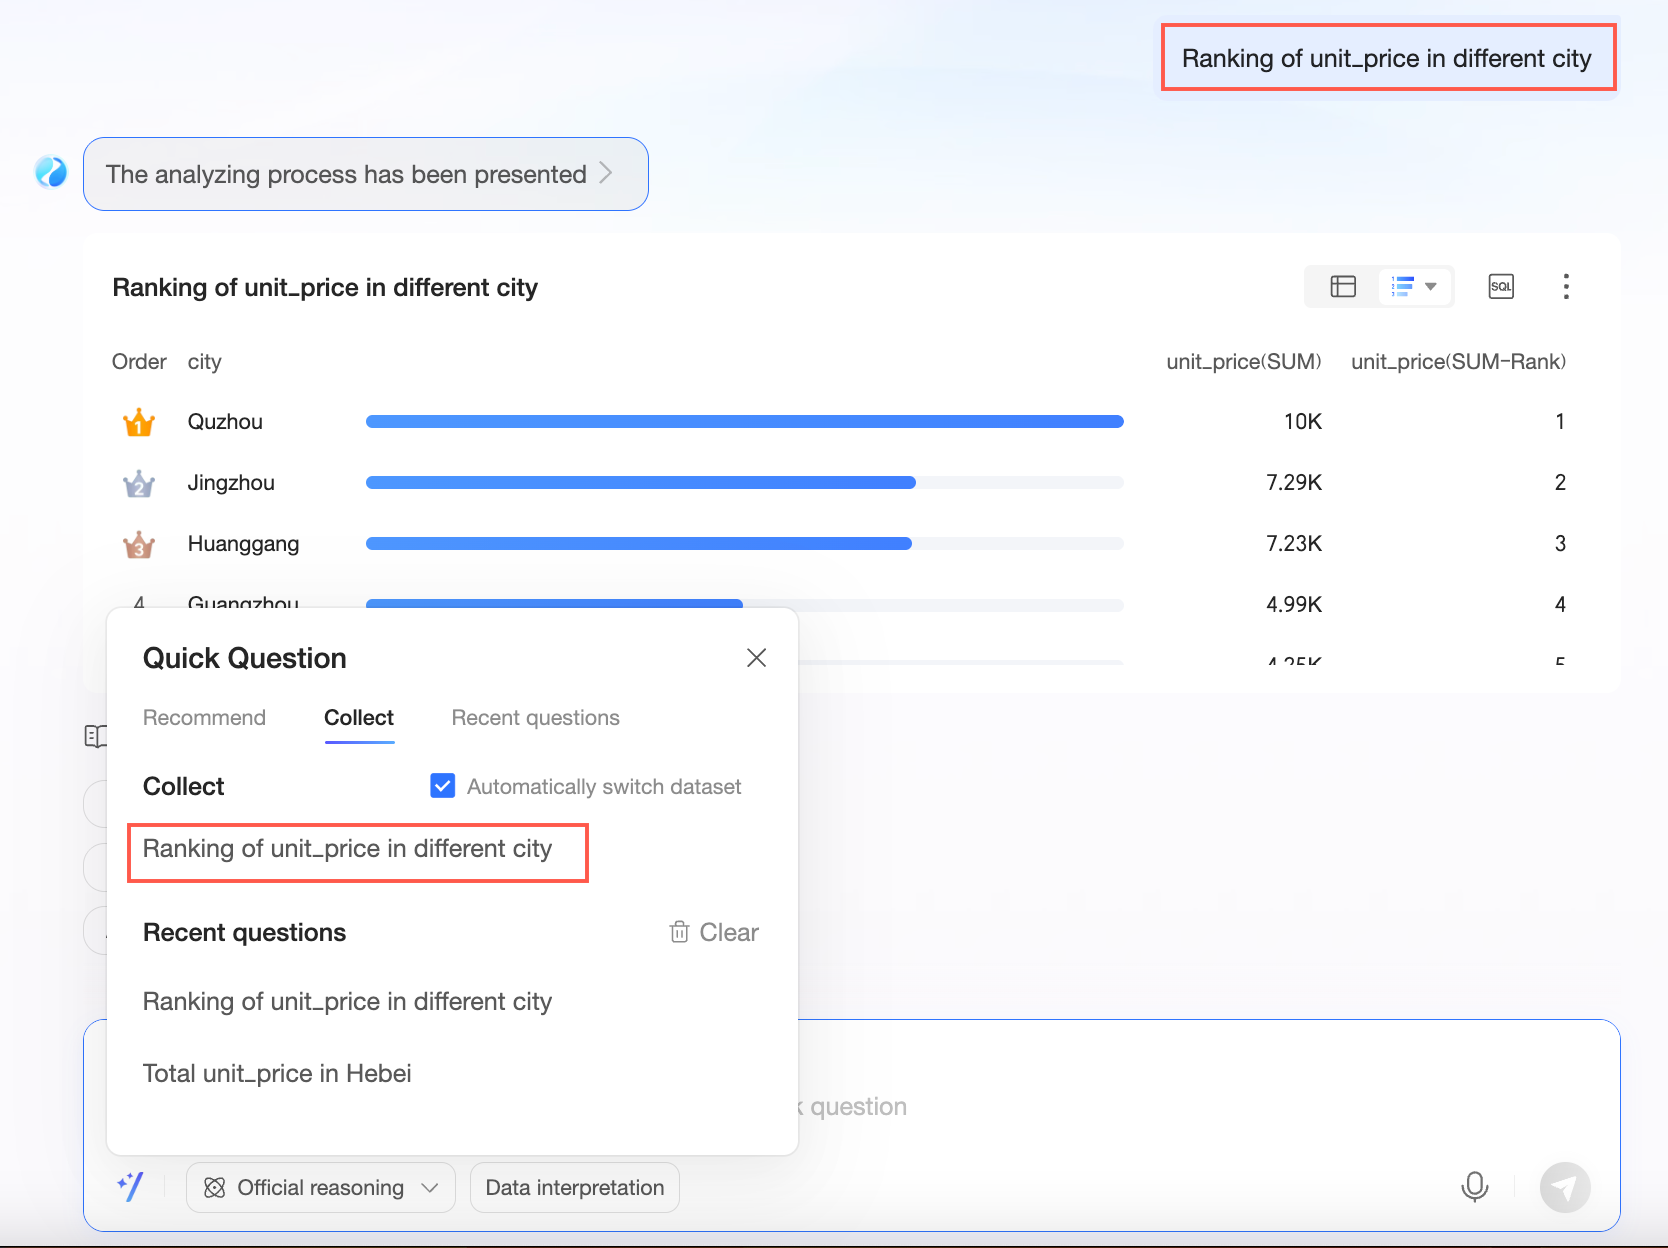
If no dataset is selected, you can click a favorited question to ask it directly.
Click the
 icon again to remove the question from your favorites.
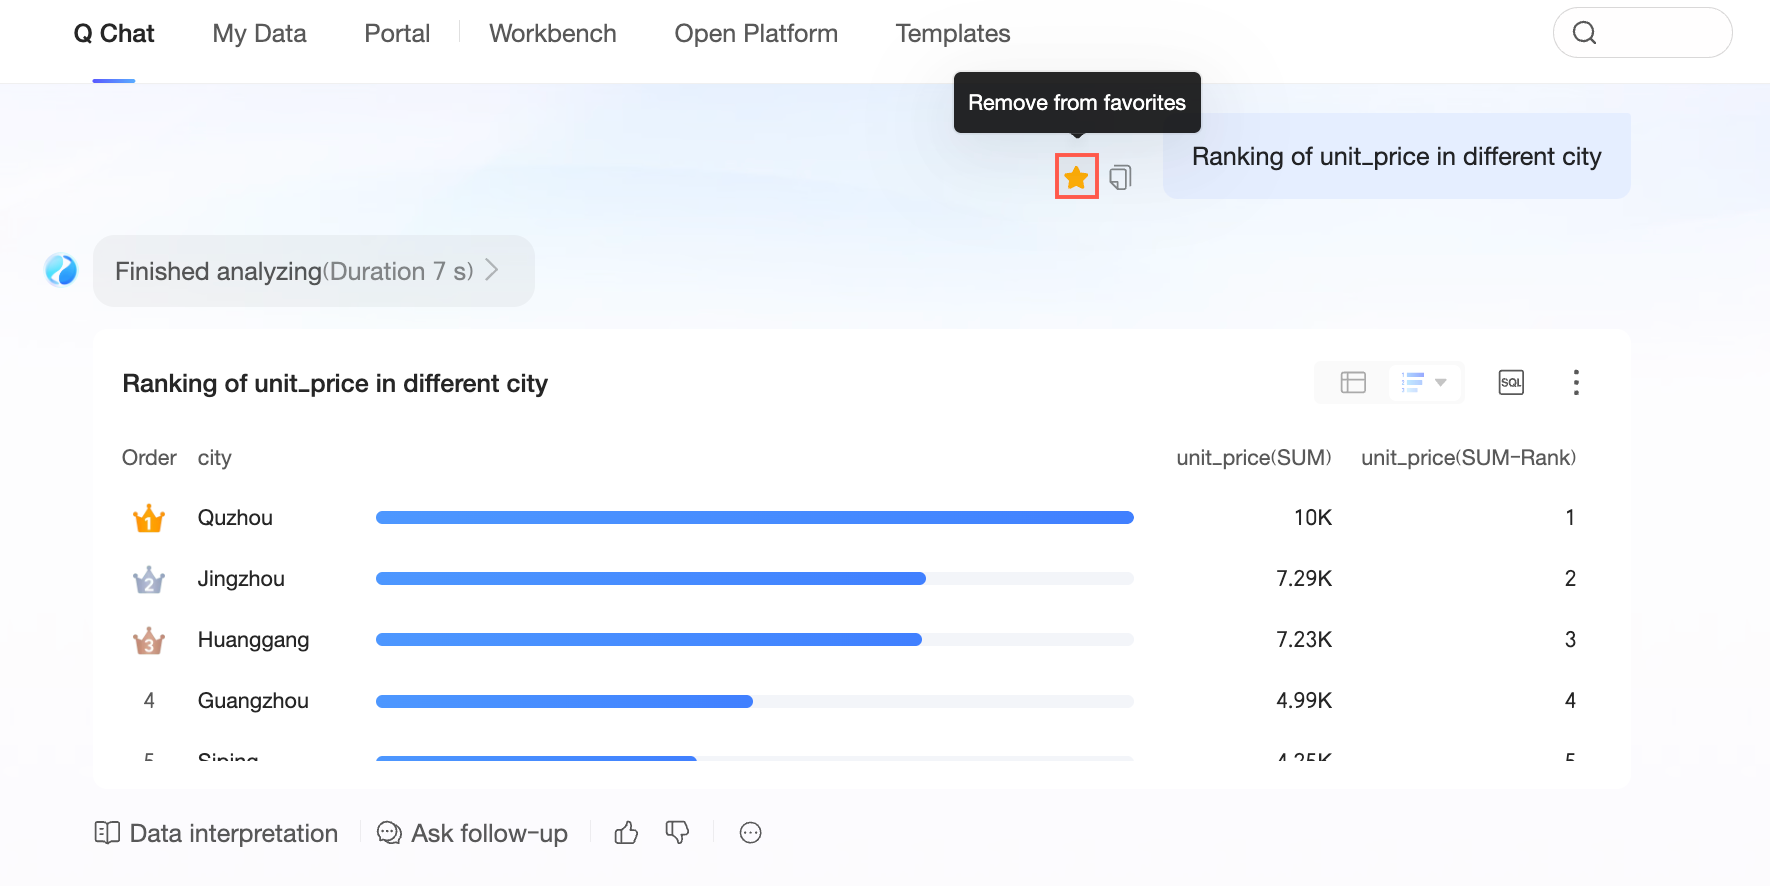
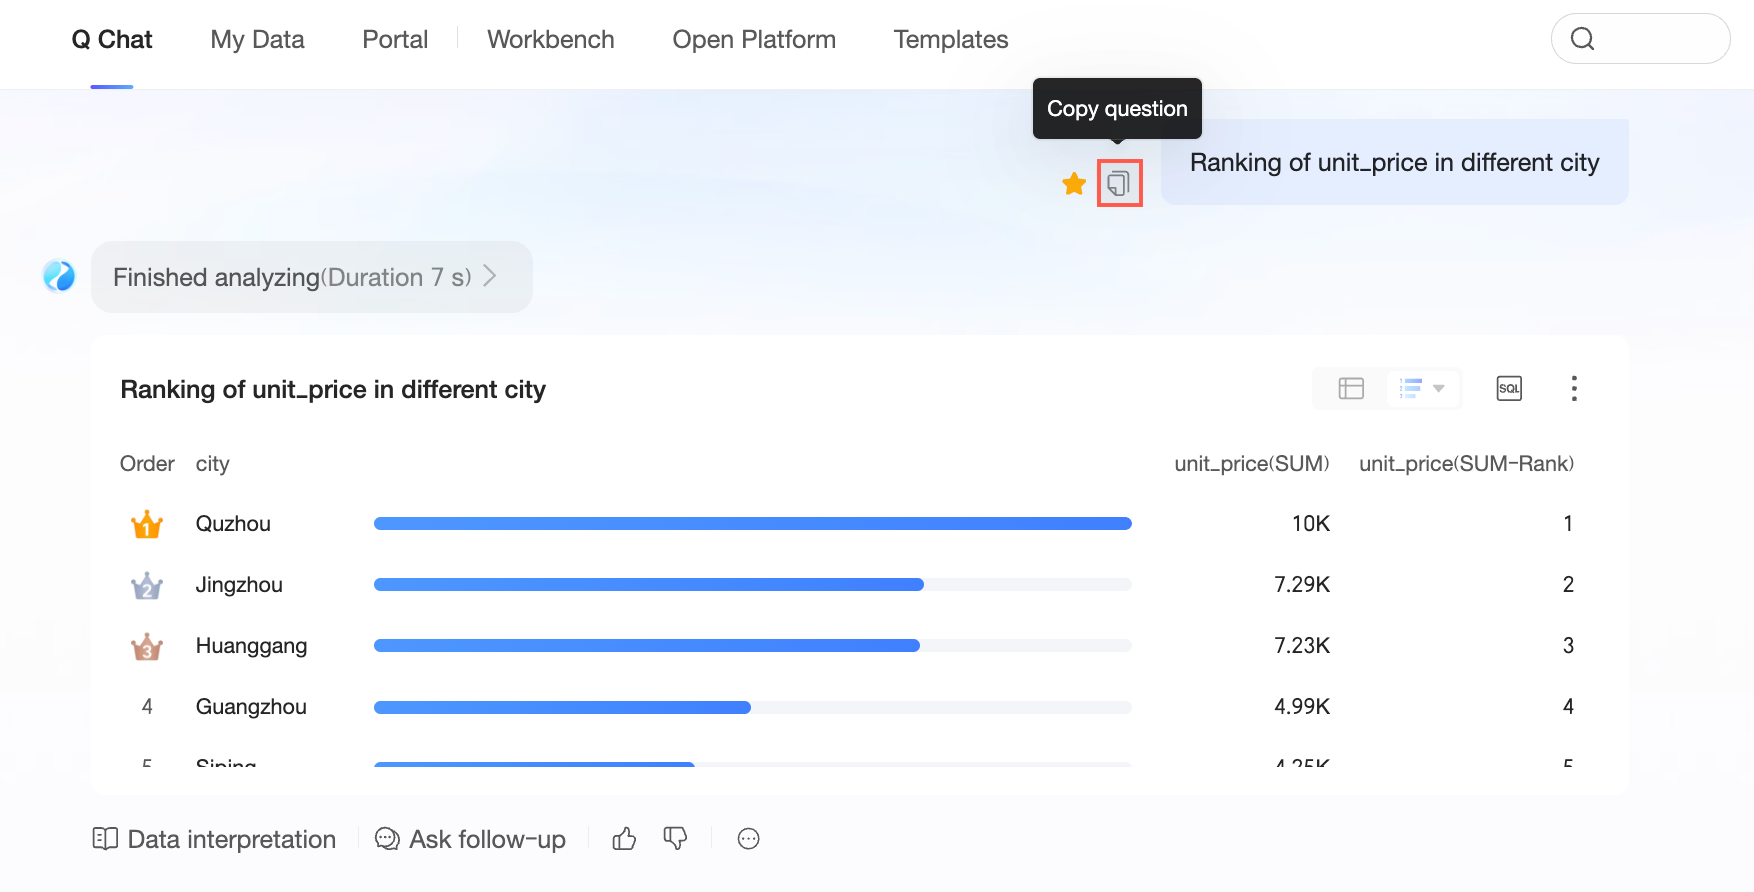
Copy a question
Click the ![]() icon to the left of a question to copy the question text.
icon to the left of a question to copy the question text.
Quick query
Click the
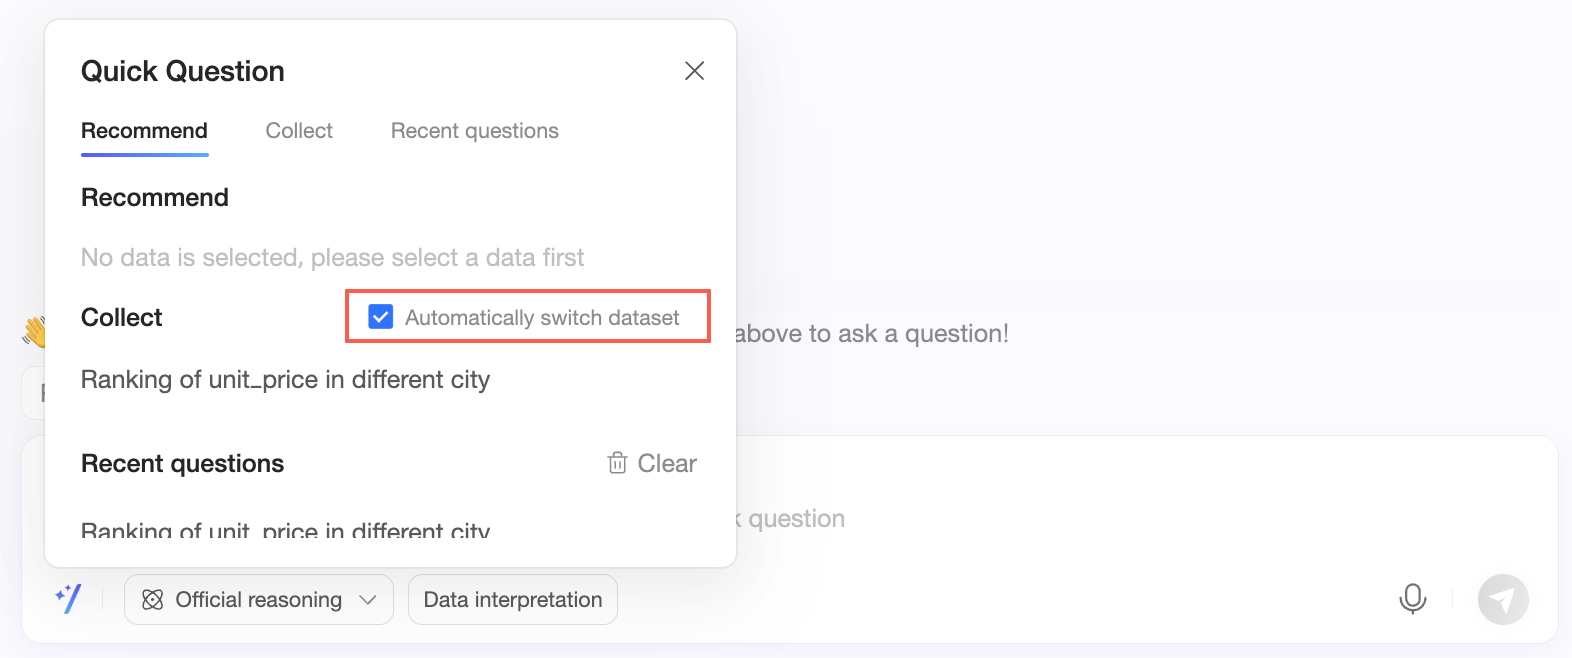
 icon in the lower-left corner of the input box to open the quick query menu. You can then select a question from the Favorites, Recommended, or Recently Used tabs.
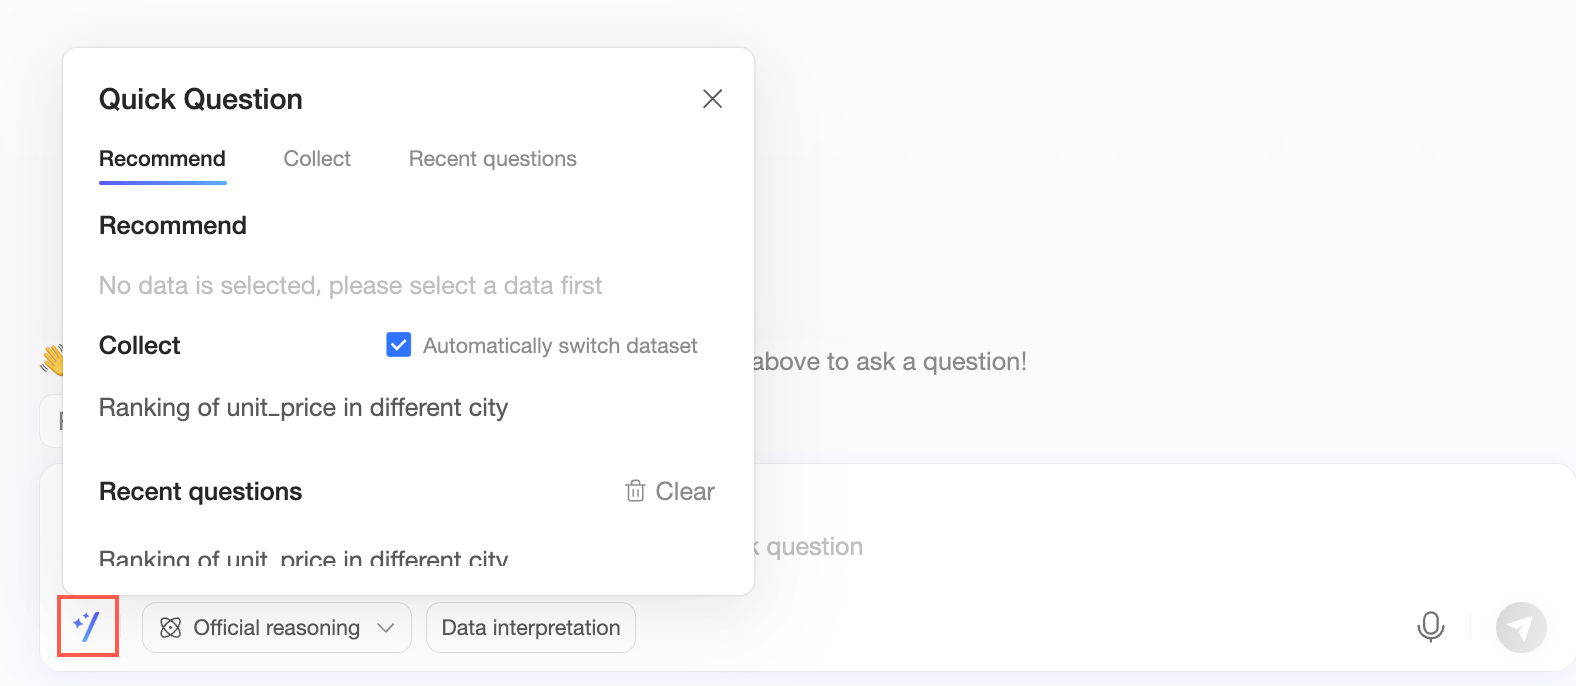
On the Favorites tab, you can select the Automatically switch dataset checkbox. This option is selected by default. When selected, clicking a favorited question switches to its associated dataset before asking the question. If you clear this checkbox, Q Chat uses the current dataset for the question.
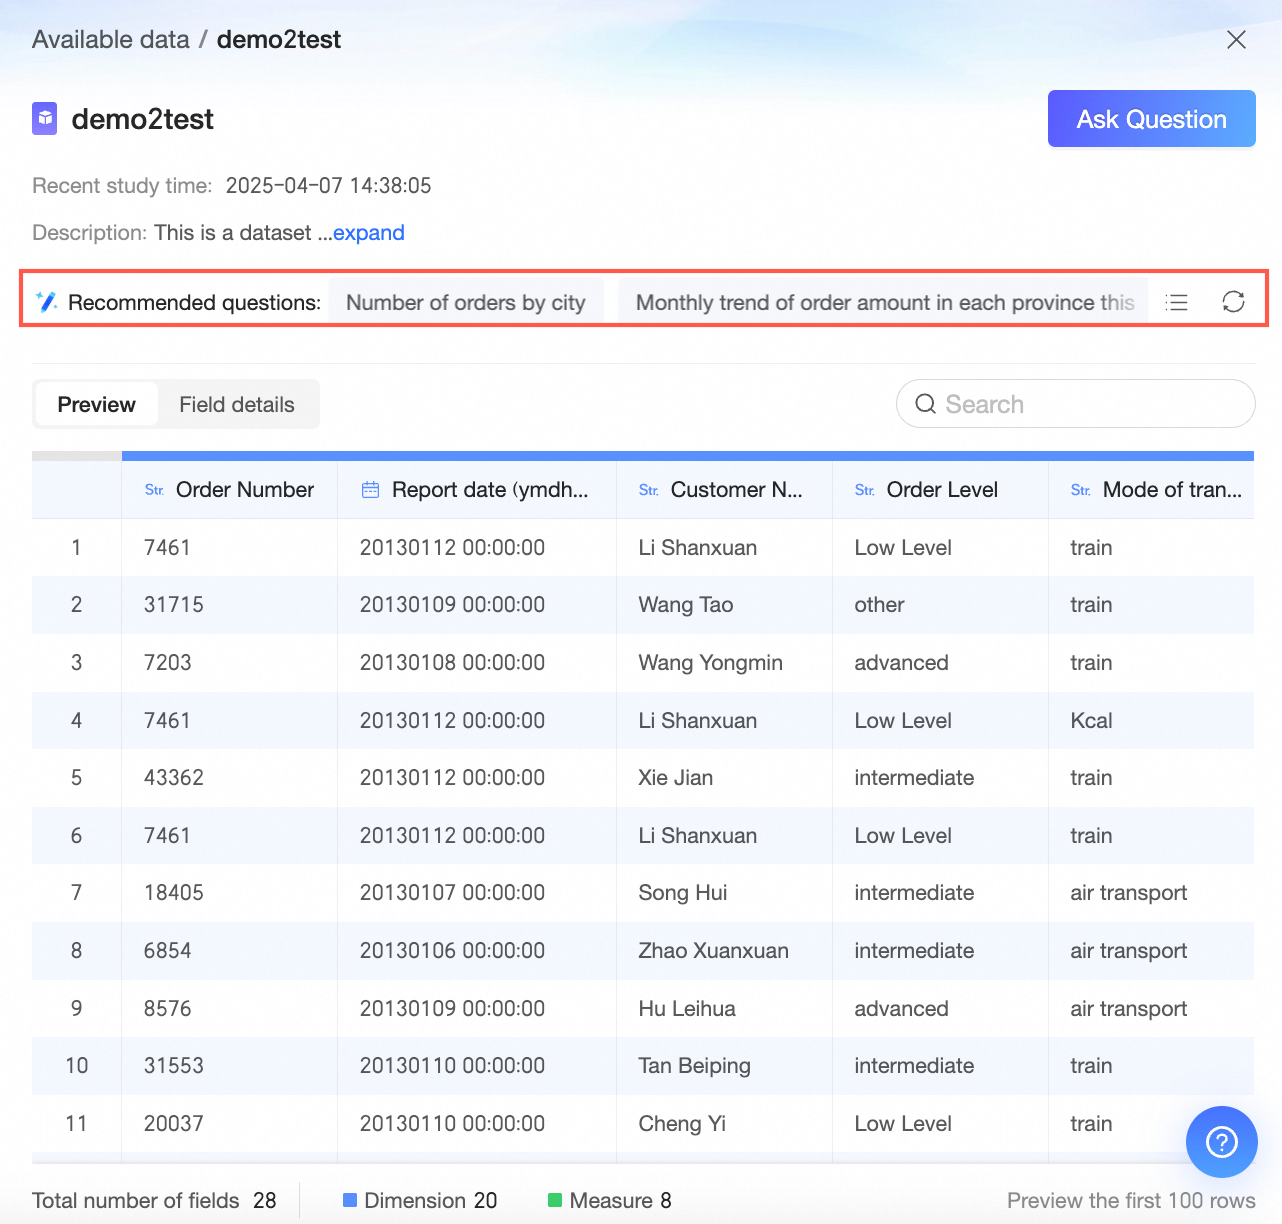
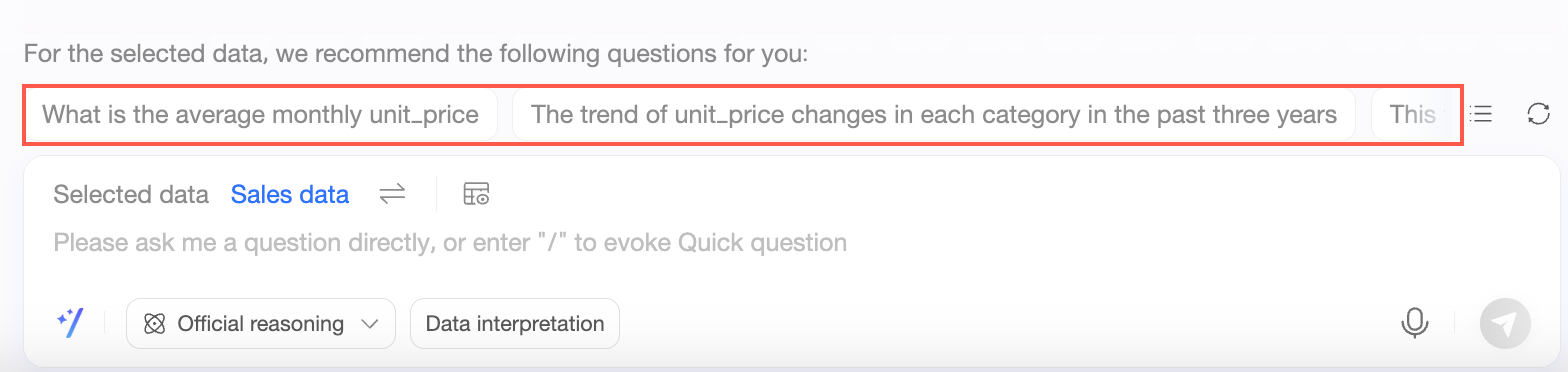
You can also click one of the recommended questions above the input box.
Click the
 icon to see a different set of recommended questions.
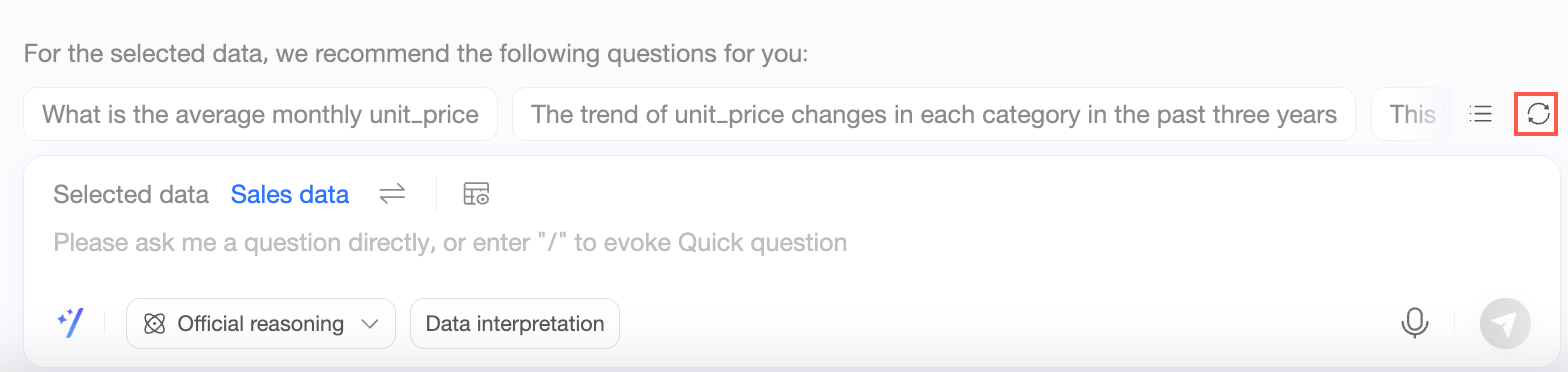
After each round of conversation, you can also select one of the three recommended questions below the chart to continue your analysis.
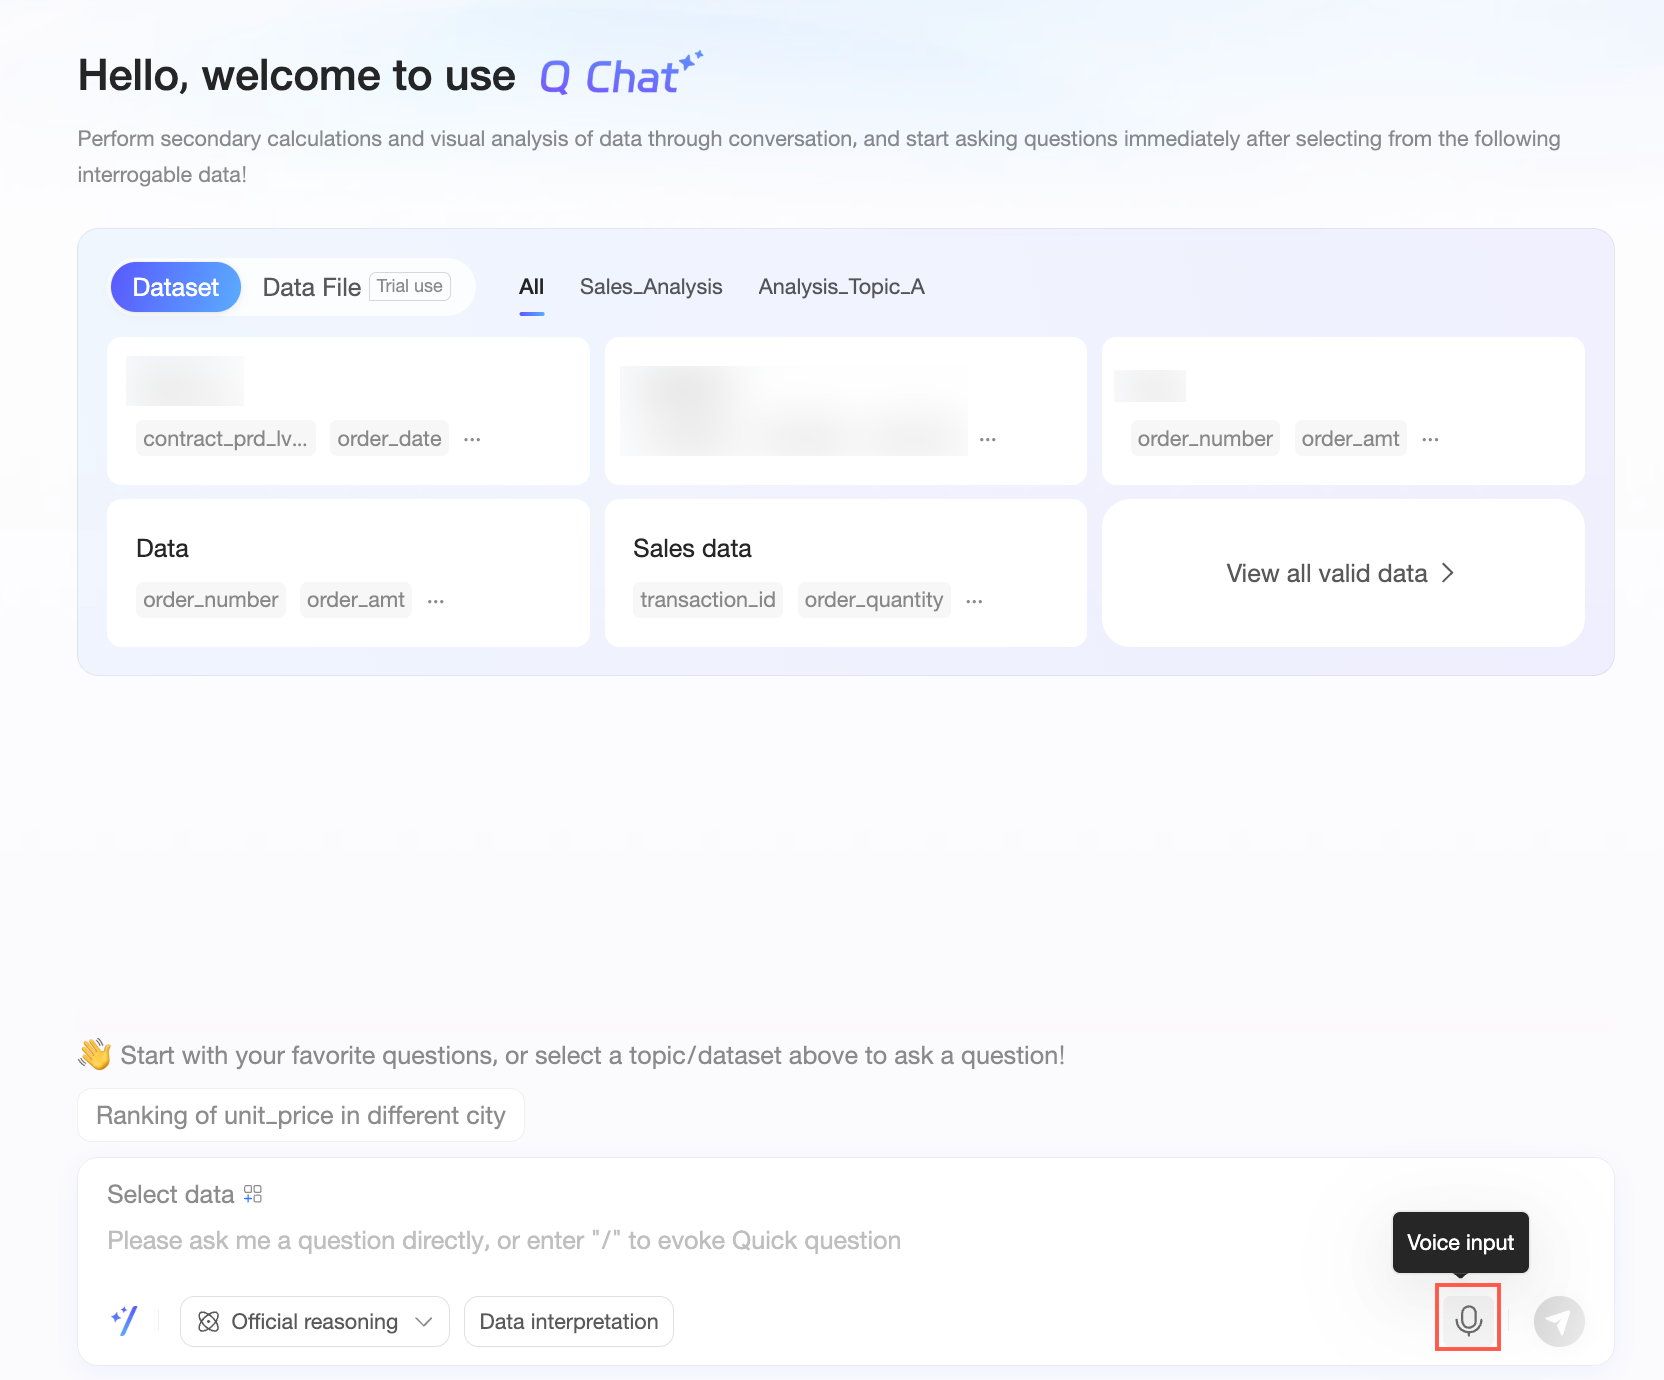
Voice input
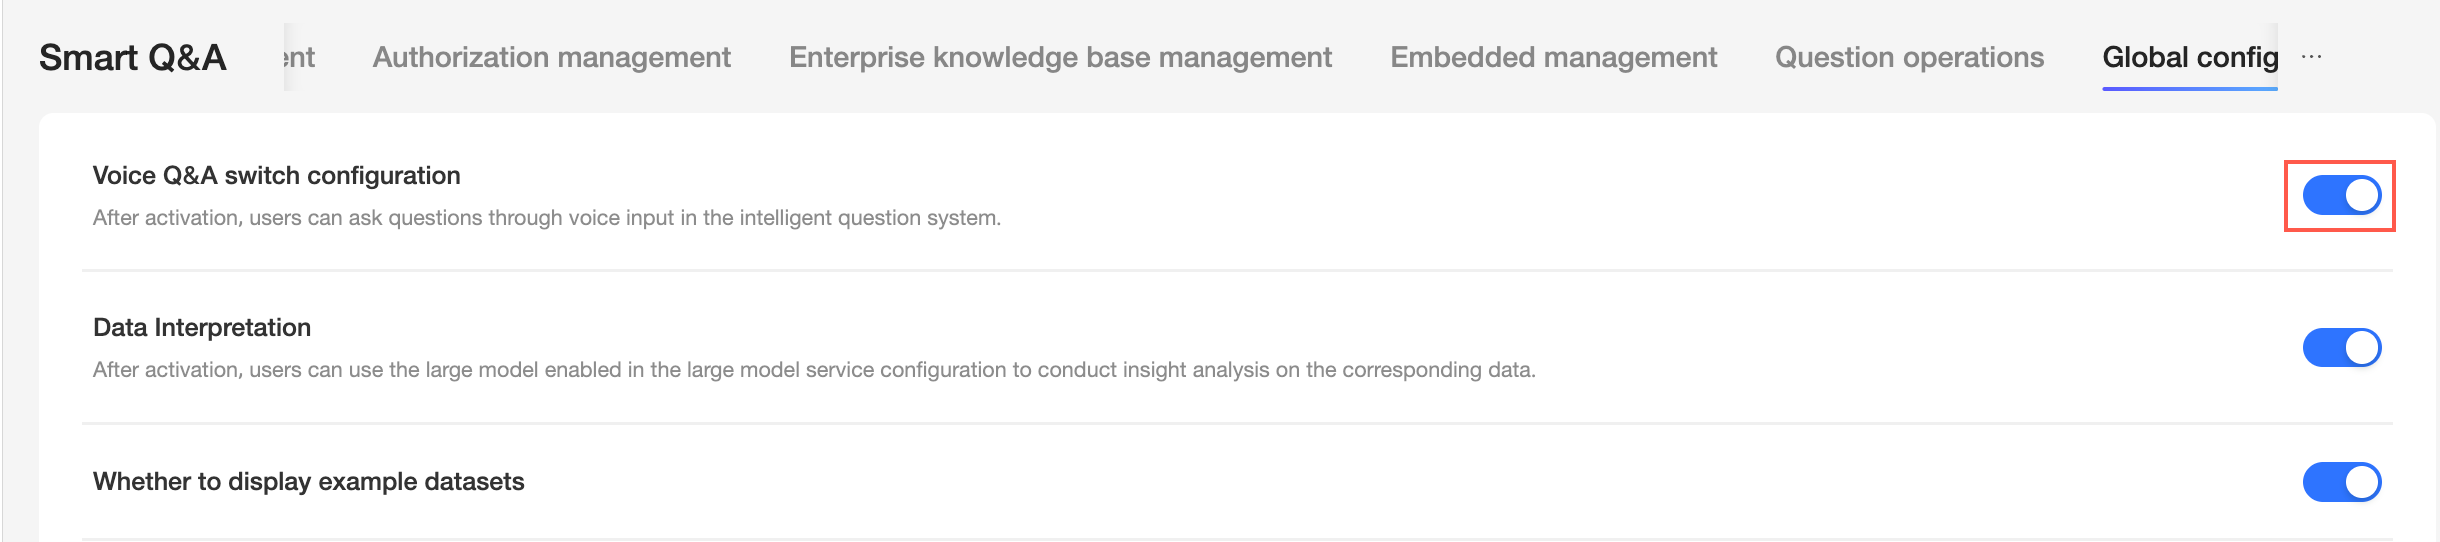
After you enable voice Q&A, you can ask questions using voice input.
Click the Voice input icon to open the voice conversation interface.
In the voice conversation interface, ask your question.
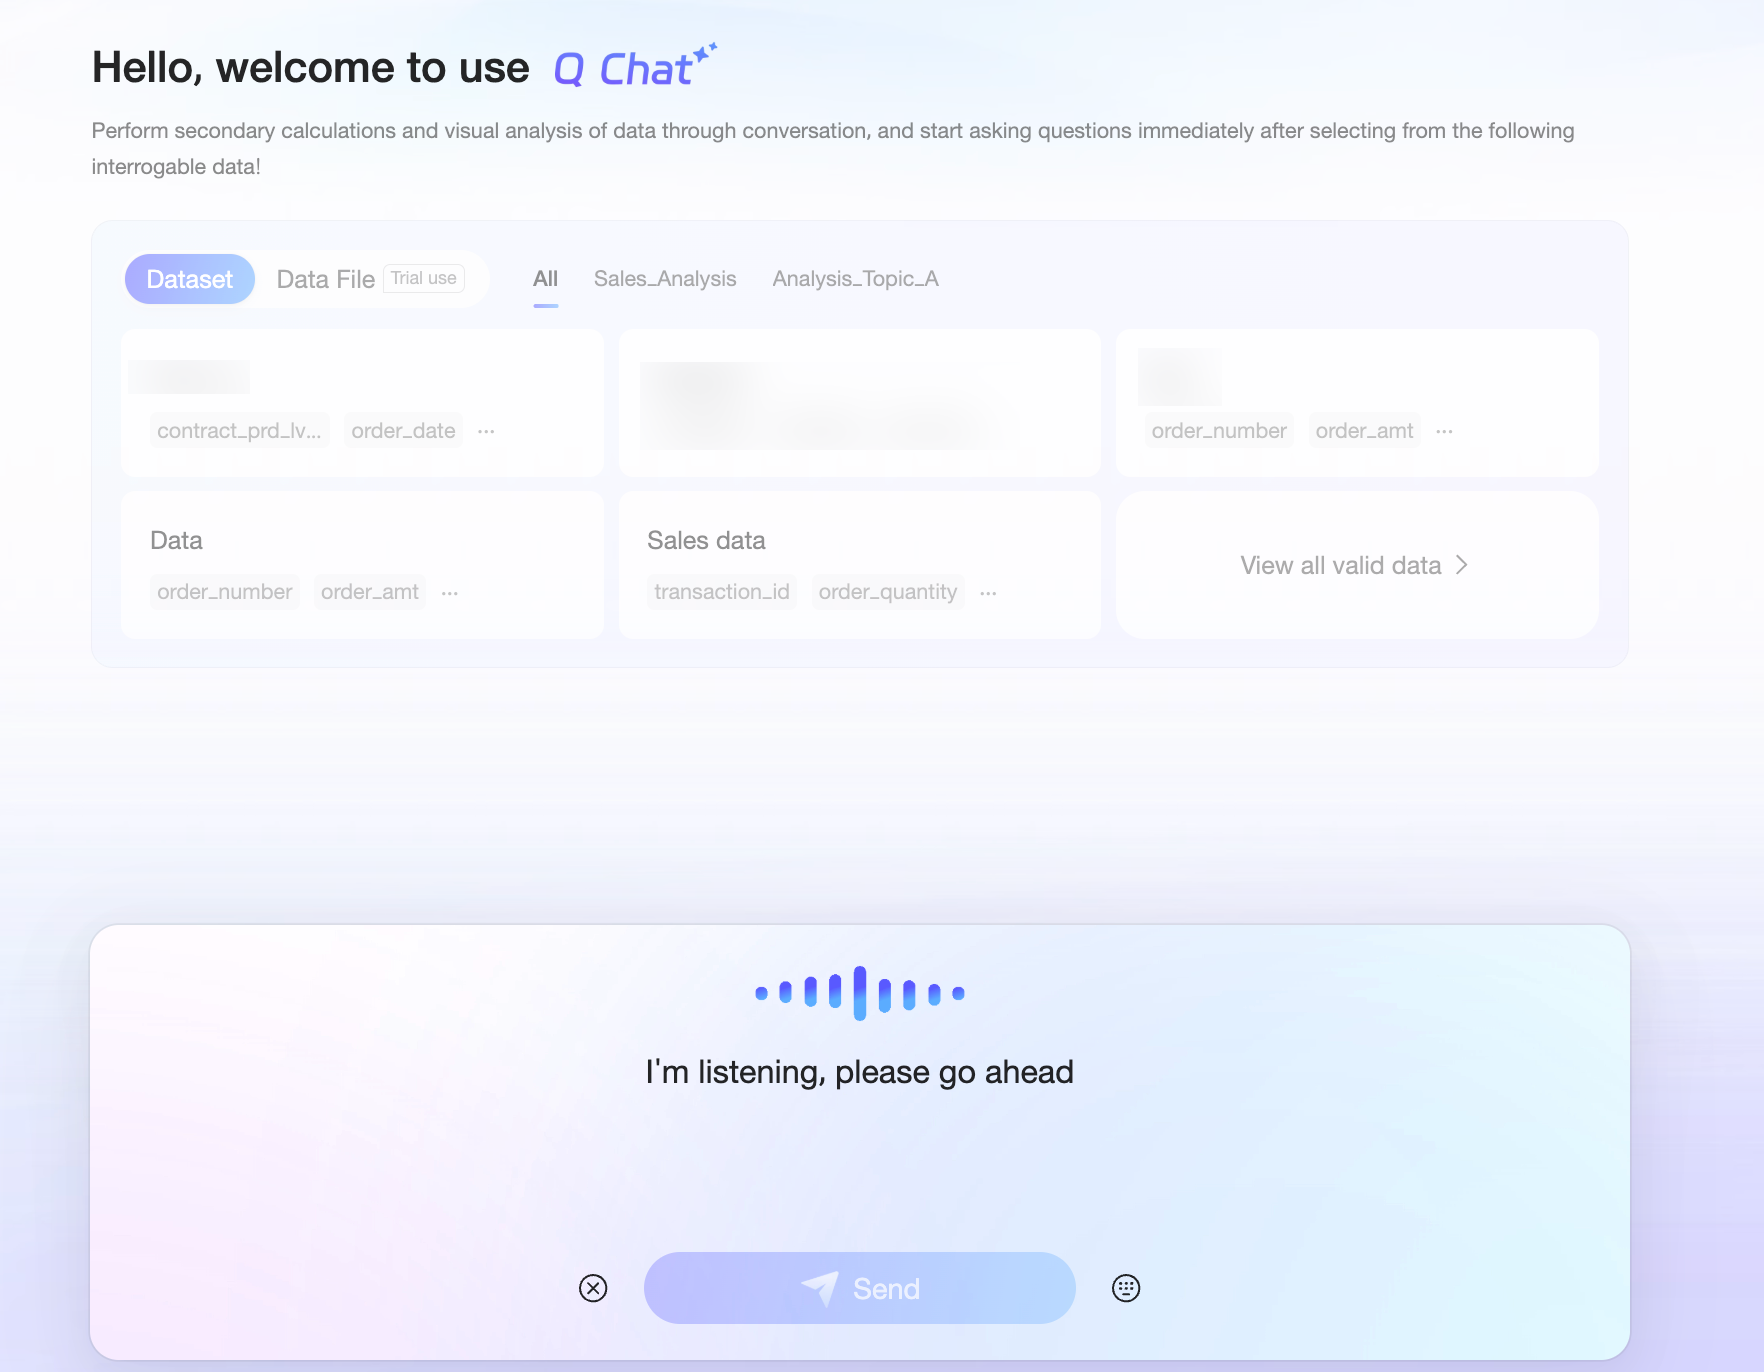
The system recognizes your speech and converts it to text.
You can click the
 icon on the left to cancel, or click the
  icon on the right to switch to text input.
Click Send or press Enter. The system returns the data analysis results.
View results
While viewing the data, you can use the following features.
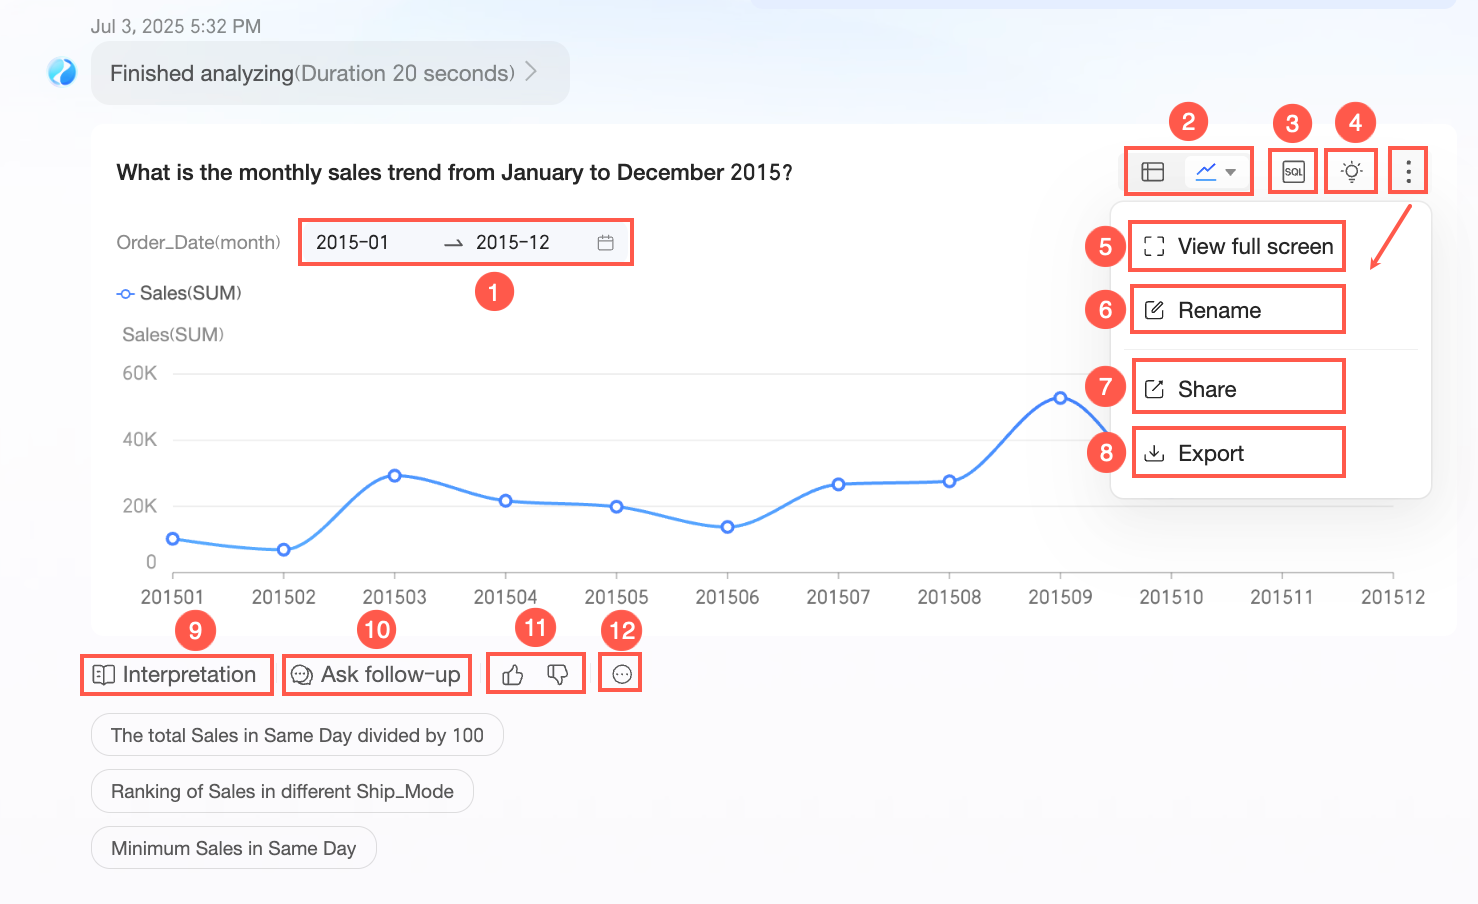
Data filtering (①): The query conditions for the current data retrieval appear in the chart. You can change these filters.
Chart switching (②): Change the visualization type to better suit your preferences. The available chart types vary based on the data.
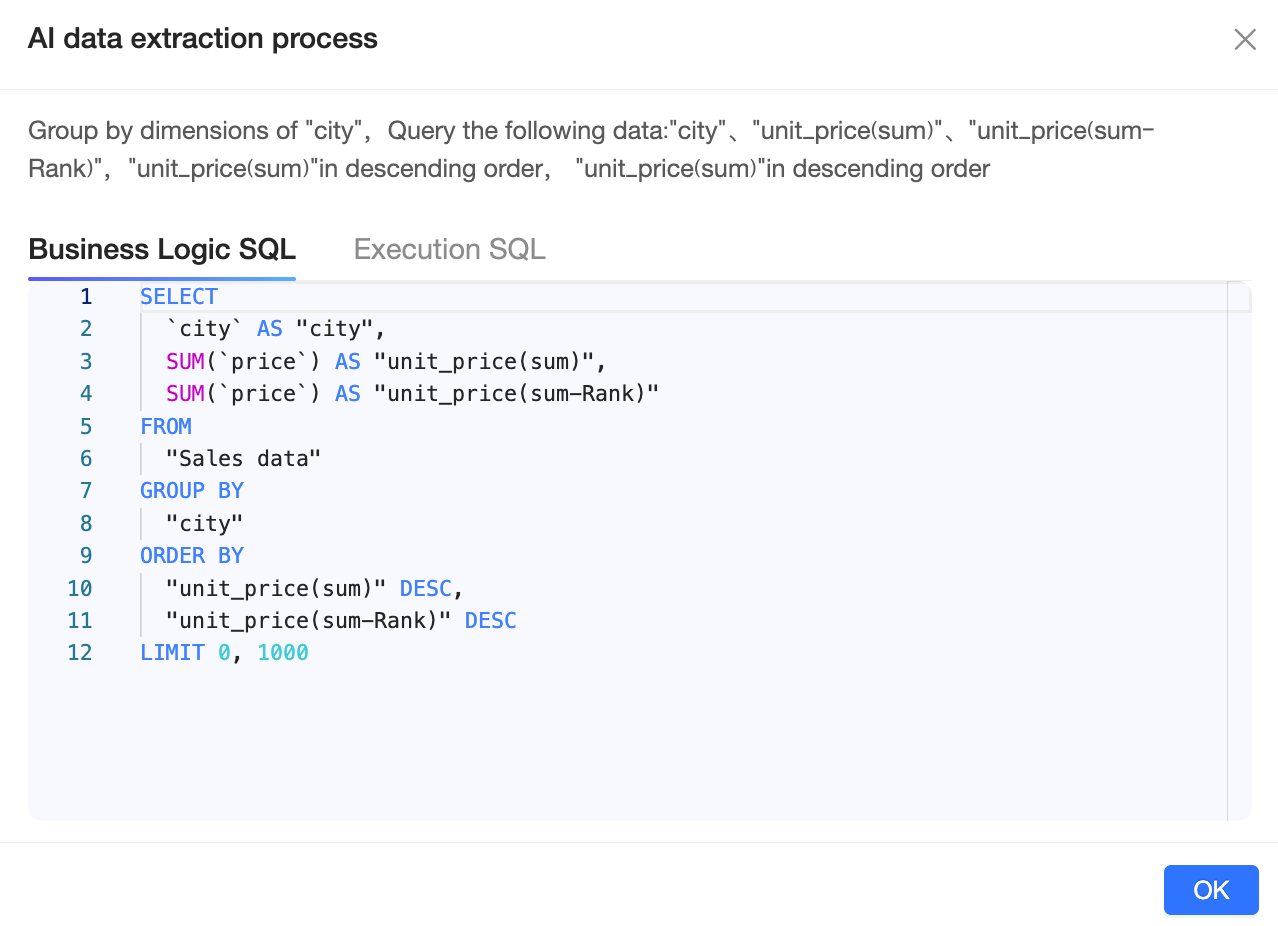
View AI data retrieval process (③): Verify that the retrieval results meet your requirements. You can view the business logic SQL and the executed SQL.
Fluctuation attribution and trend forecast (④)
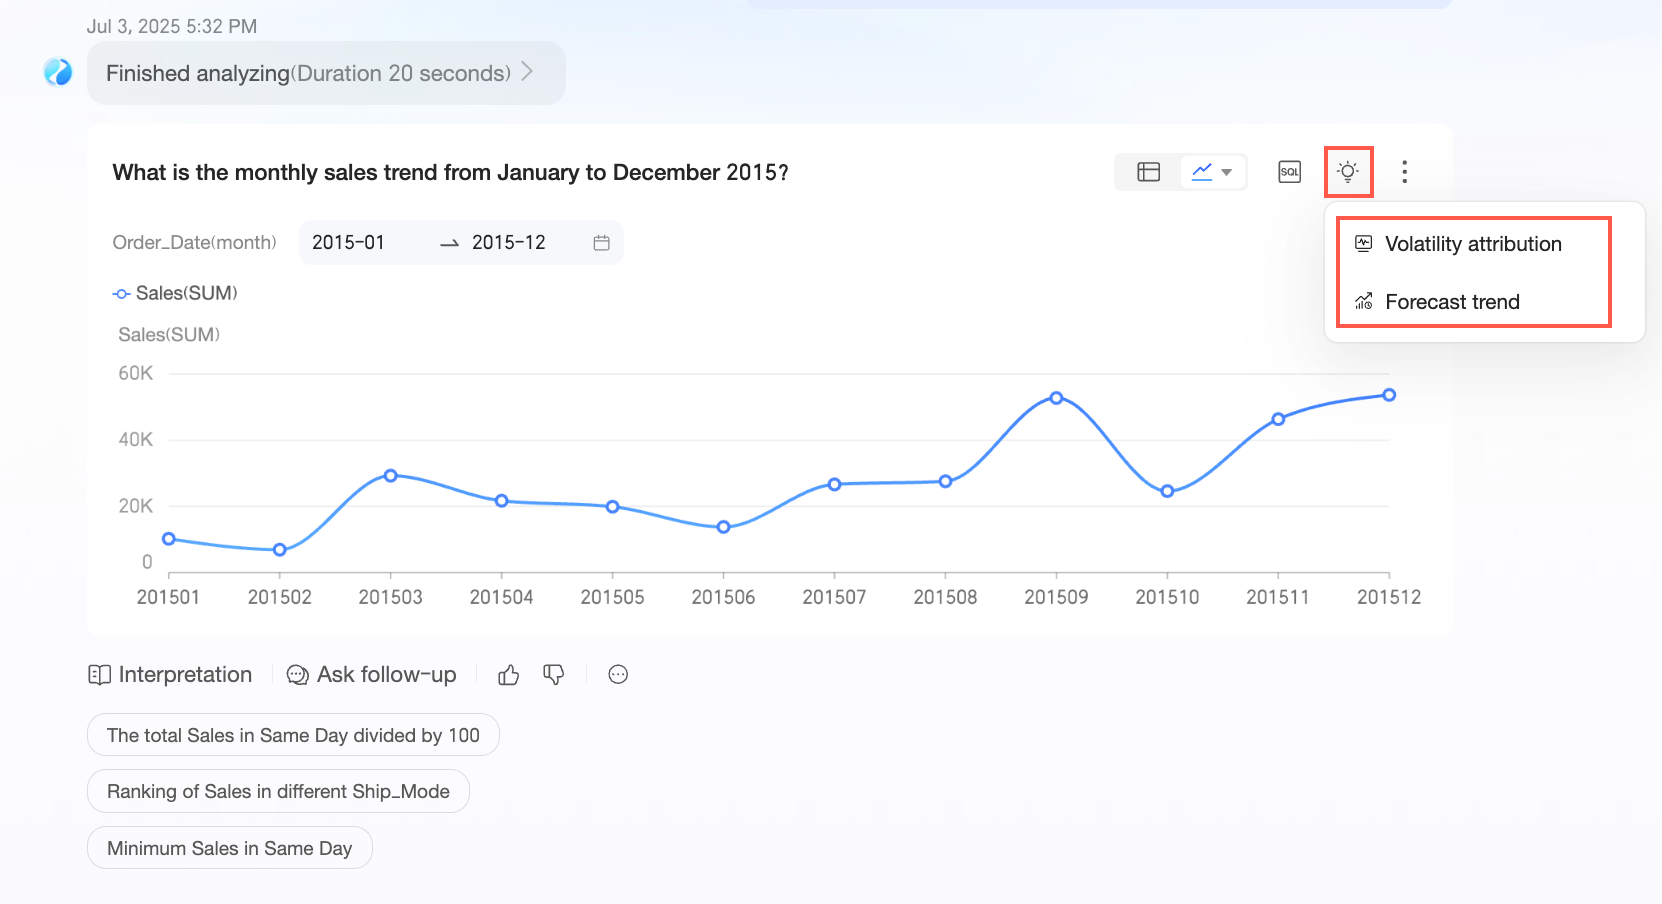
Fluctuation attribution
 Note
NoteFluctuation attribution is available for KPI cards and line charts if the following conditions are met:
Supported chart types: KPI card and standard line chart (not a forecast line chart).
The chart contains exactly one dimension.
The dimension is a date type, and the chart has no legend.
The chart must be error-free.
Line chart requirements: 1 date dimension and 1 to 3 measures.
KPI card requirements: 1 date dimension and 1 measure.
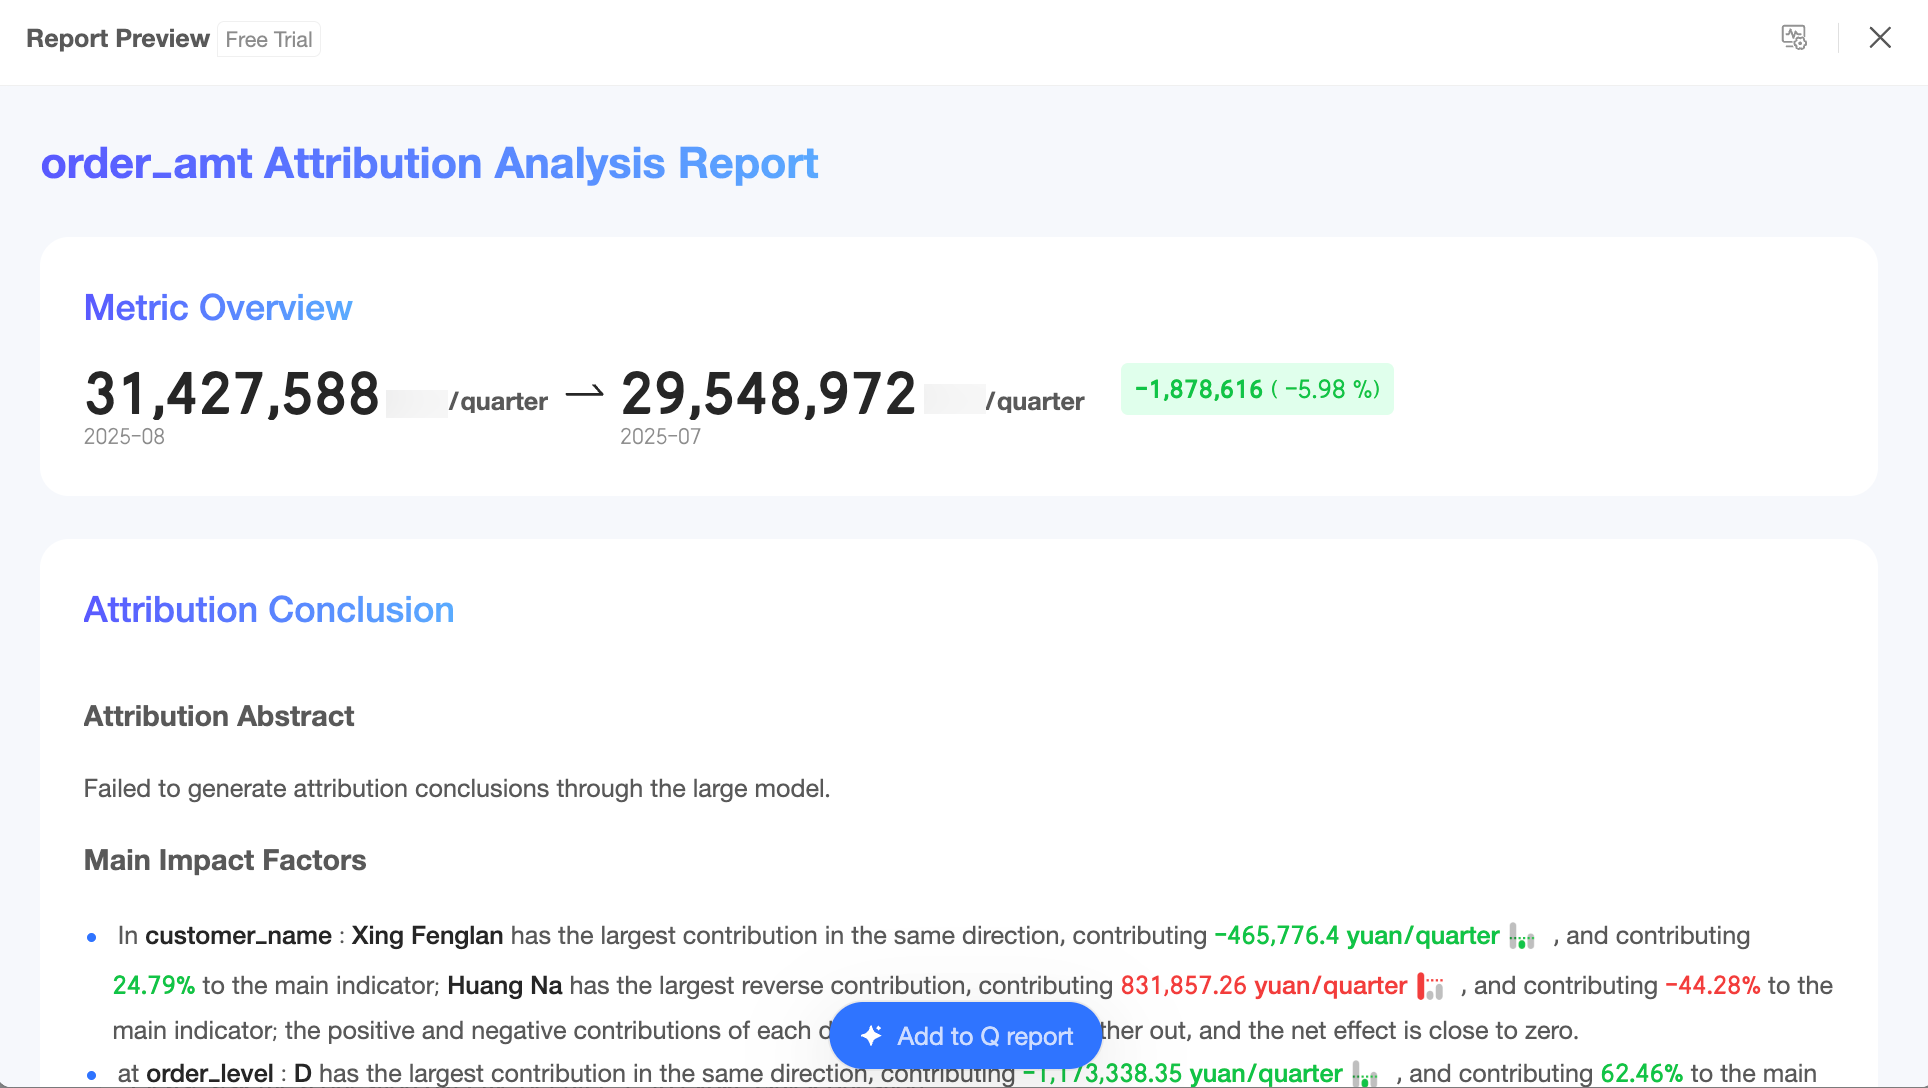
Click the
 icon in the upper-right corner to open the Attribution Report Settings.
You can modify the attribution metric, data interpretation approach, and model selection. After you click OK, the system automatically updates the attribution report. For more information, see Q Chat Insight.
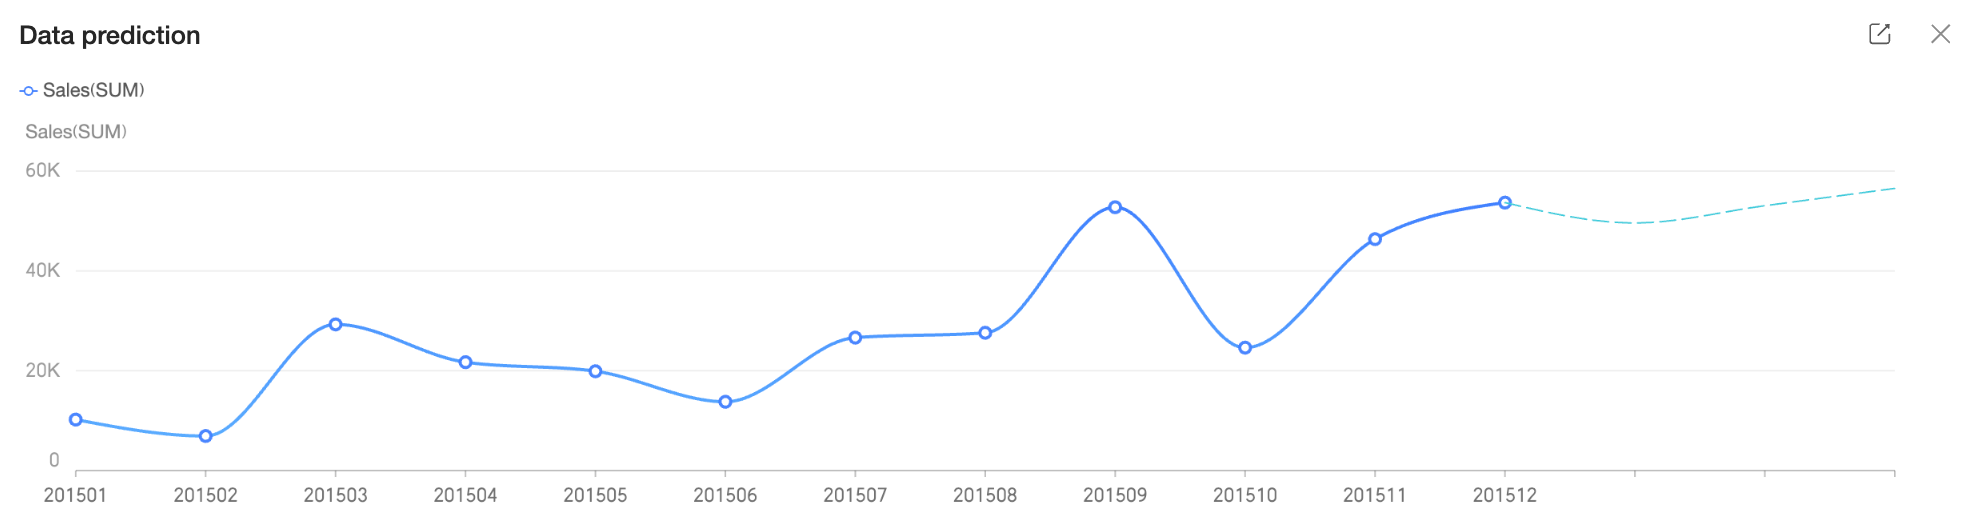
Trend forecast
 Note
NoteTrend forecast is available for line and bar charts if the following conditions are met:
Supported chart types: Line chart or bar chart that contains a date dimension and has no legend.
The chart is not a forecast result itself.
The chart must be error-free.
The chart must have 12 or more dimension values.
Line chart requirements: 1 date dimension and 1 to 3 measures.
You can click the
 icon in the upper-right corner to share the trend forecast.
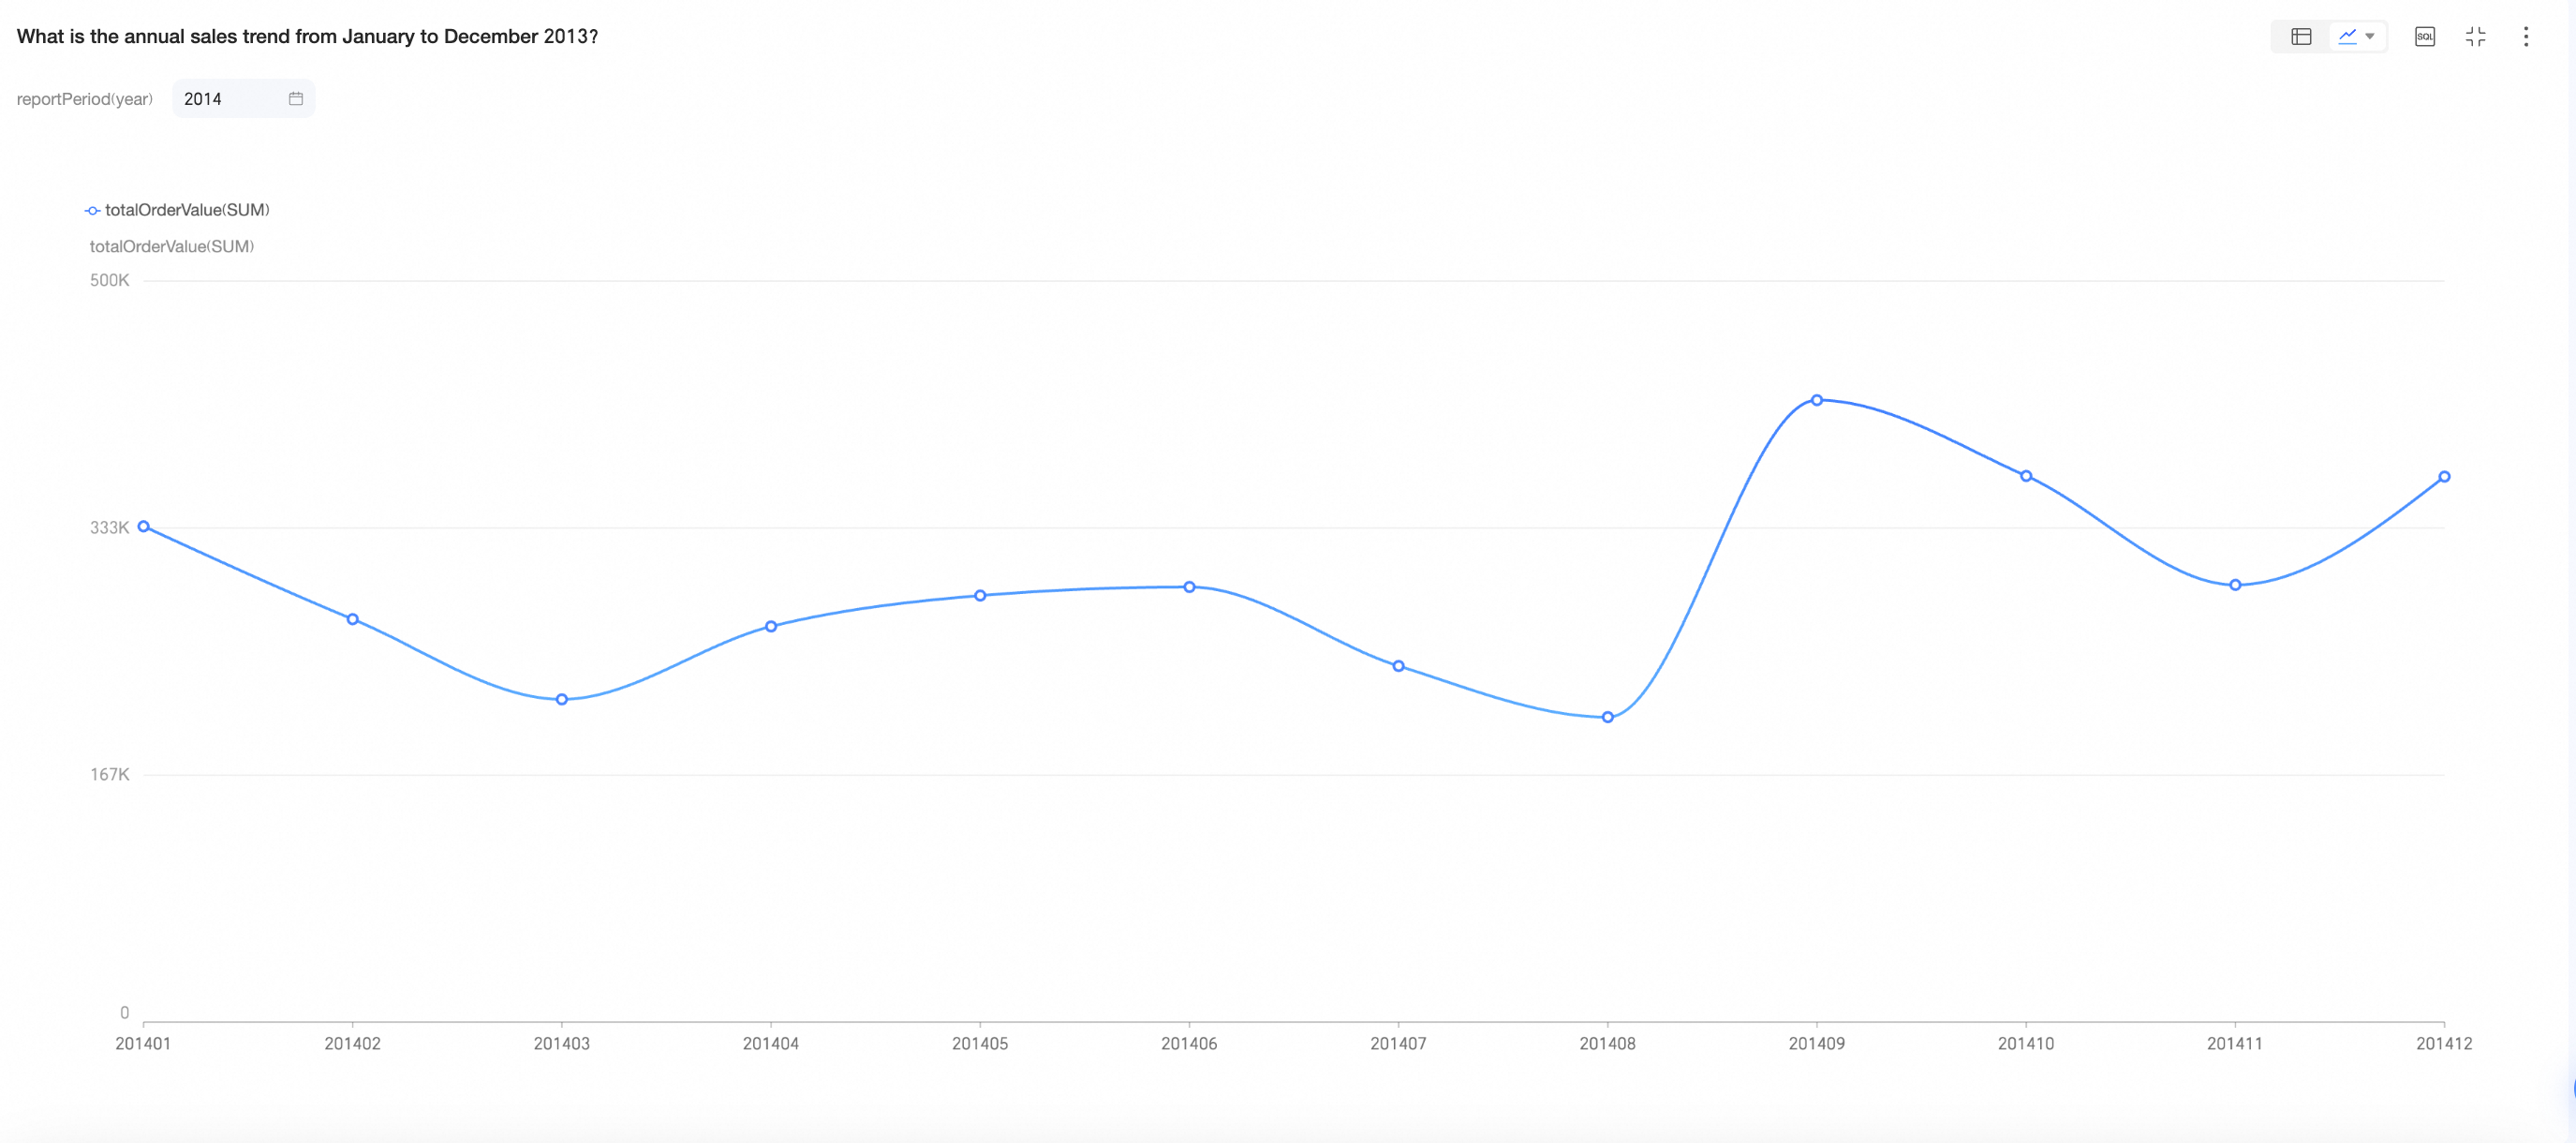
View in full screen (⑤).
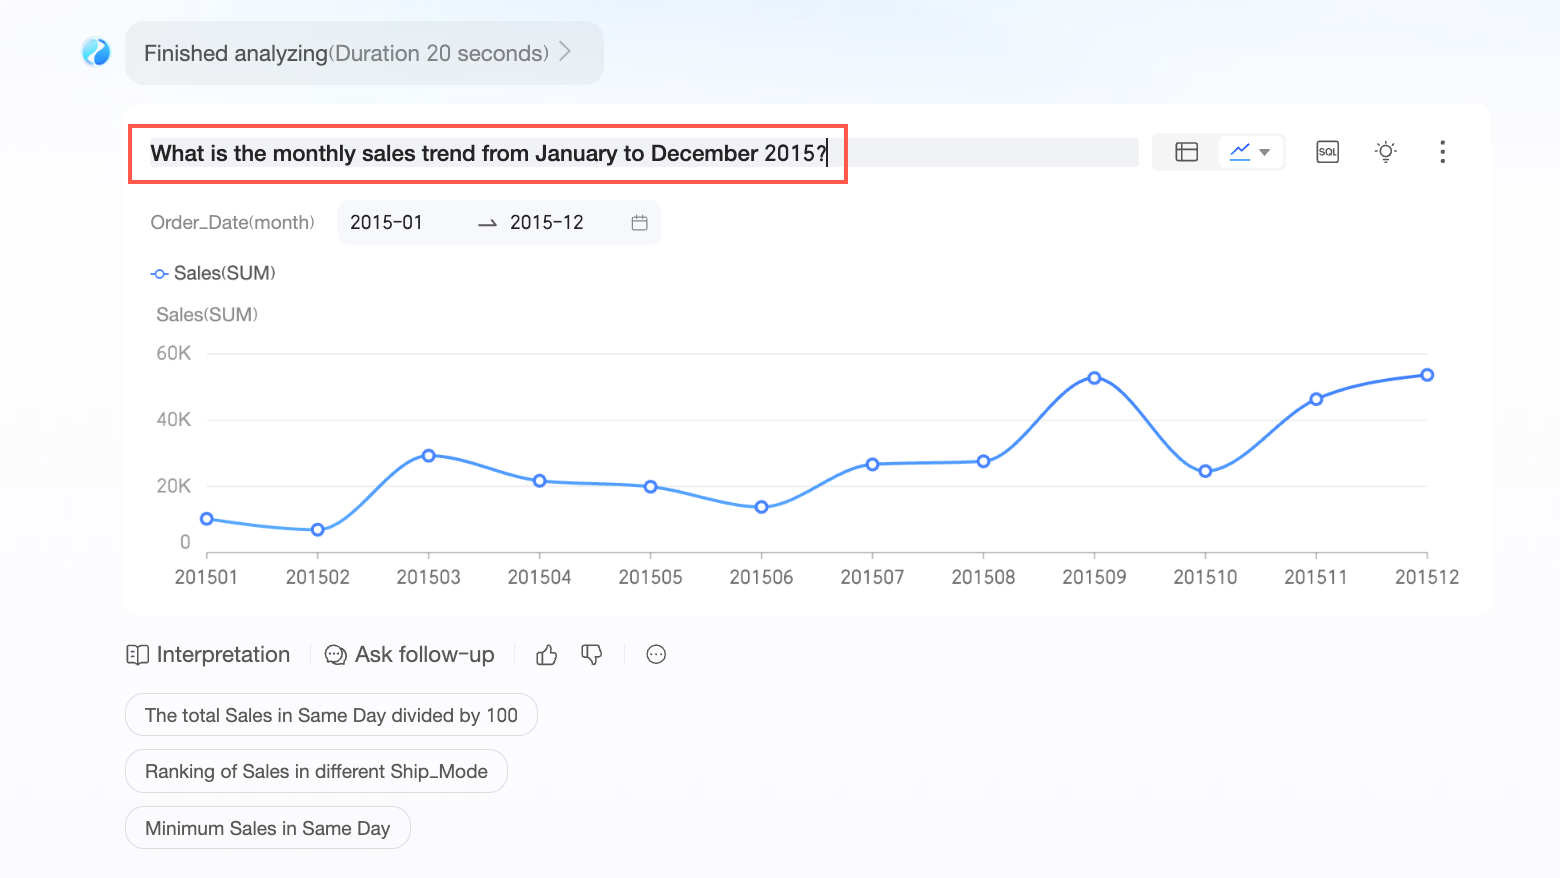
Rename (⑥)
You can rename the result. You can also click the title area (highlighted in the red box) to rename it.
Share data (⑦)
You can copy the link to share.

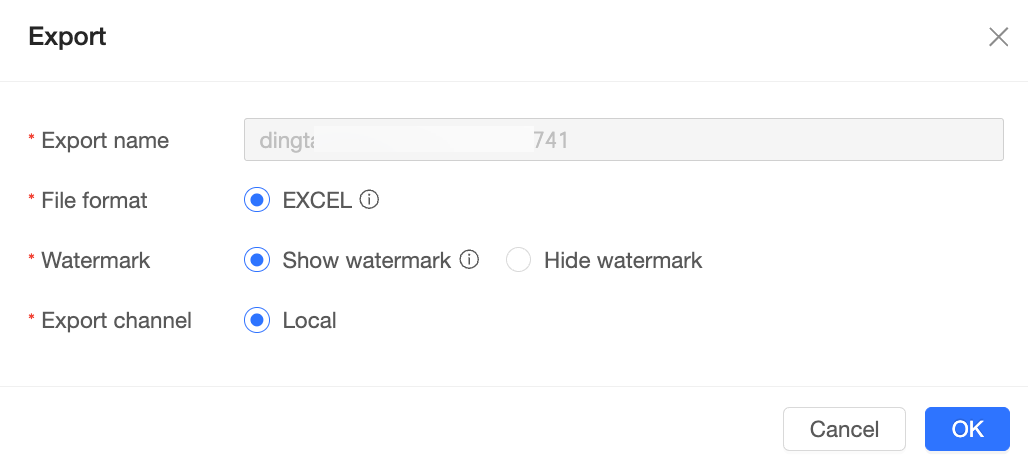
Export data (⑧)
You can export the data as an Excel file. You can also specify a custom export name.
NoteThe export function is available only on PC and is not supported on the mobile client.
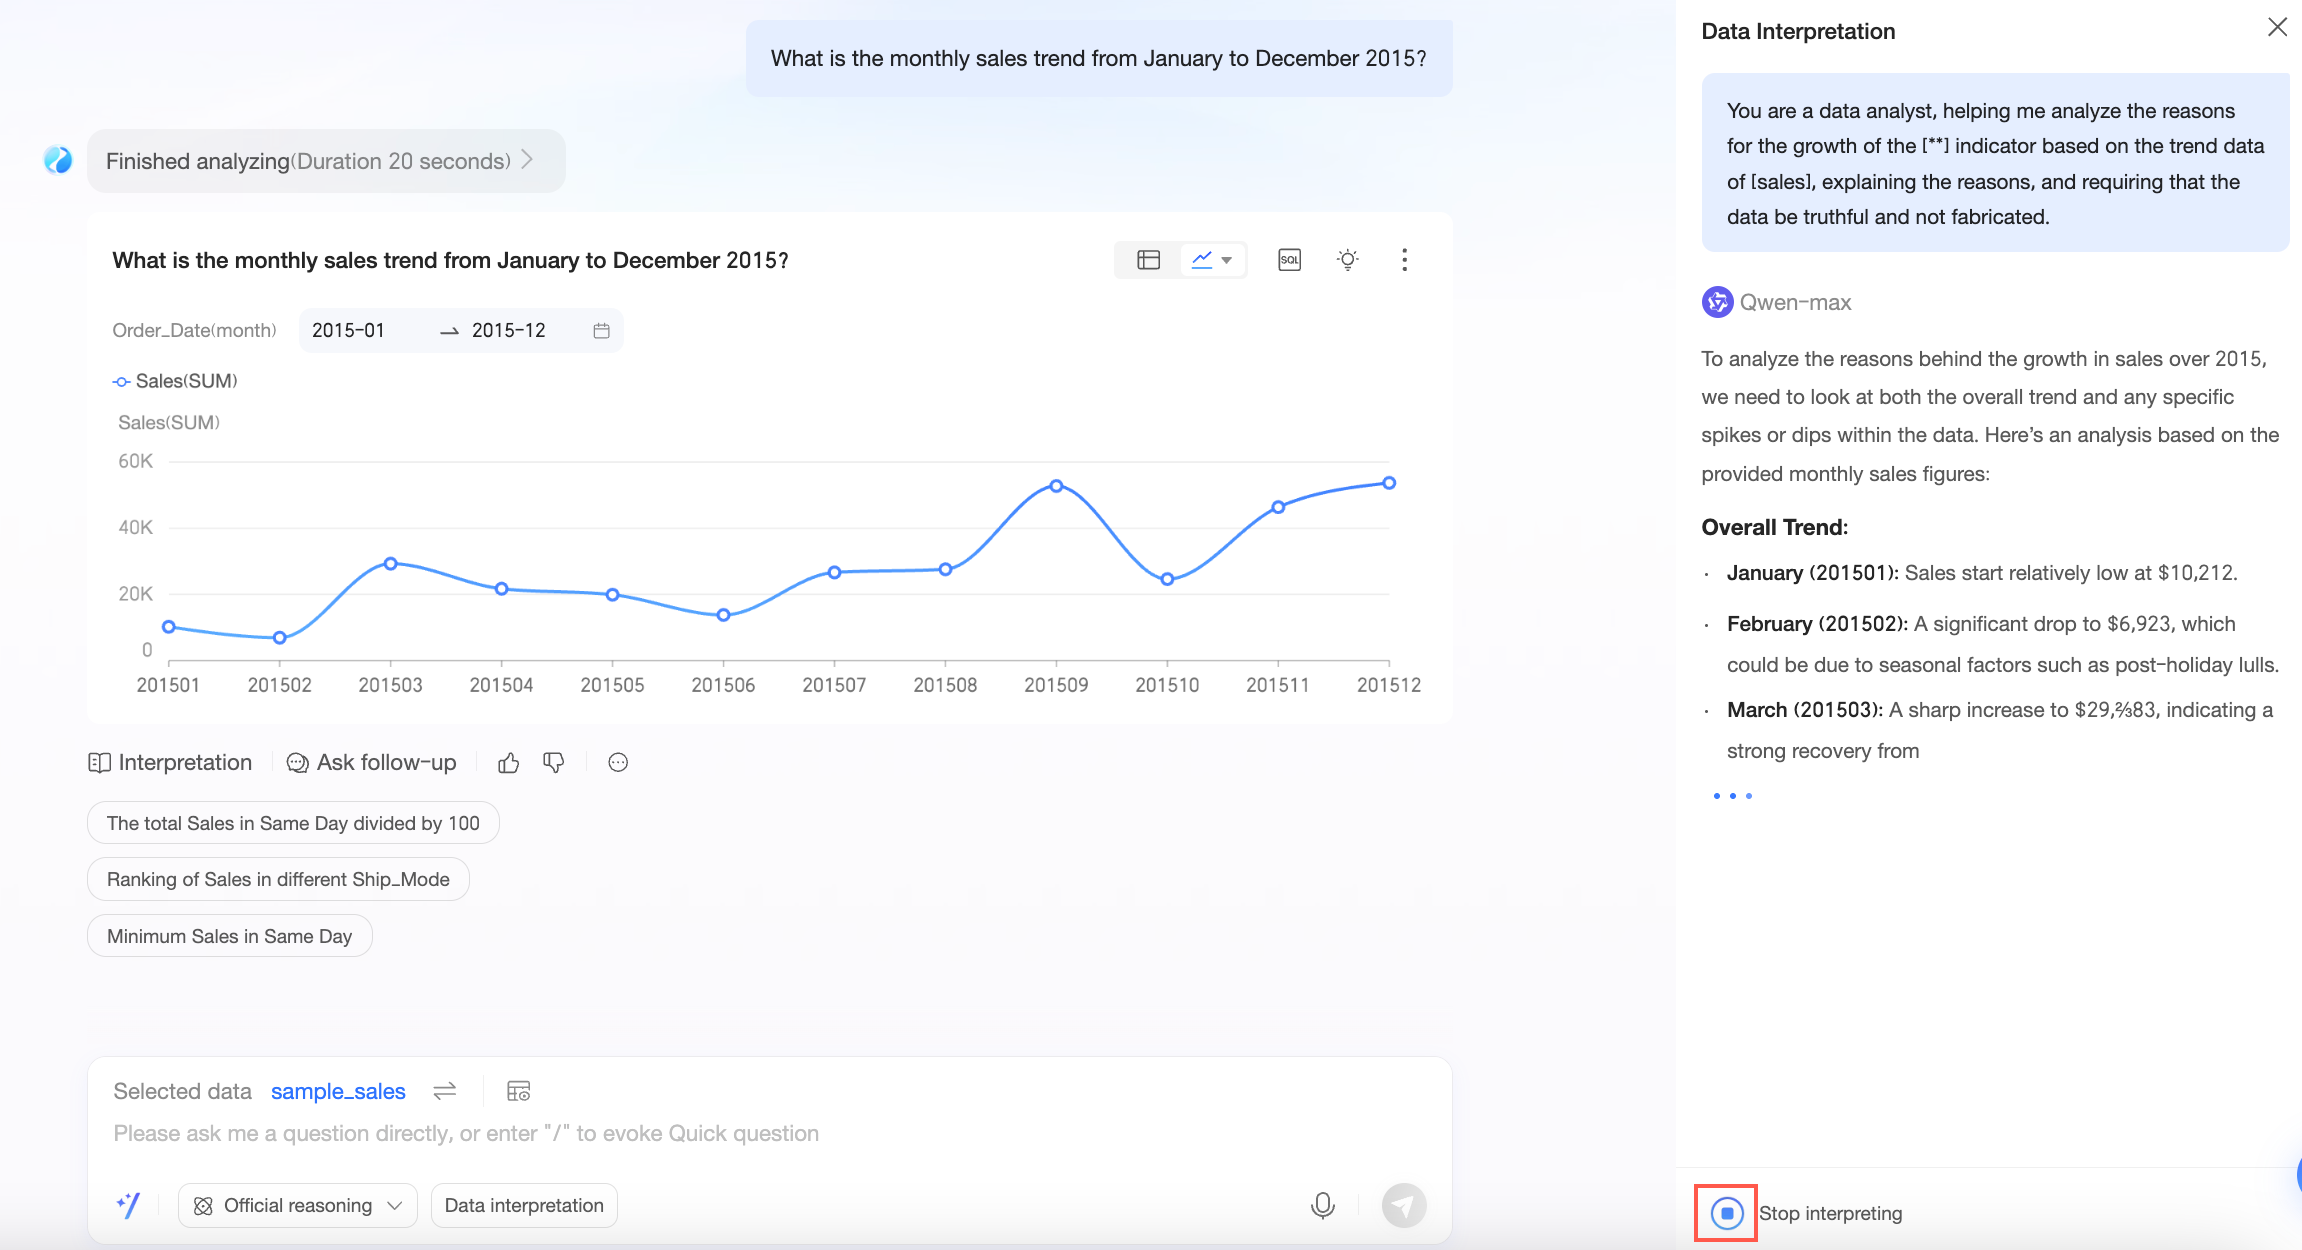
Data interpretation (⑨)
NoteThis feature lets you initiate a custom data interpretation. You can specify the interpretation approach and model for the query result.
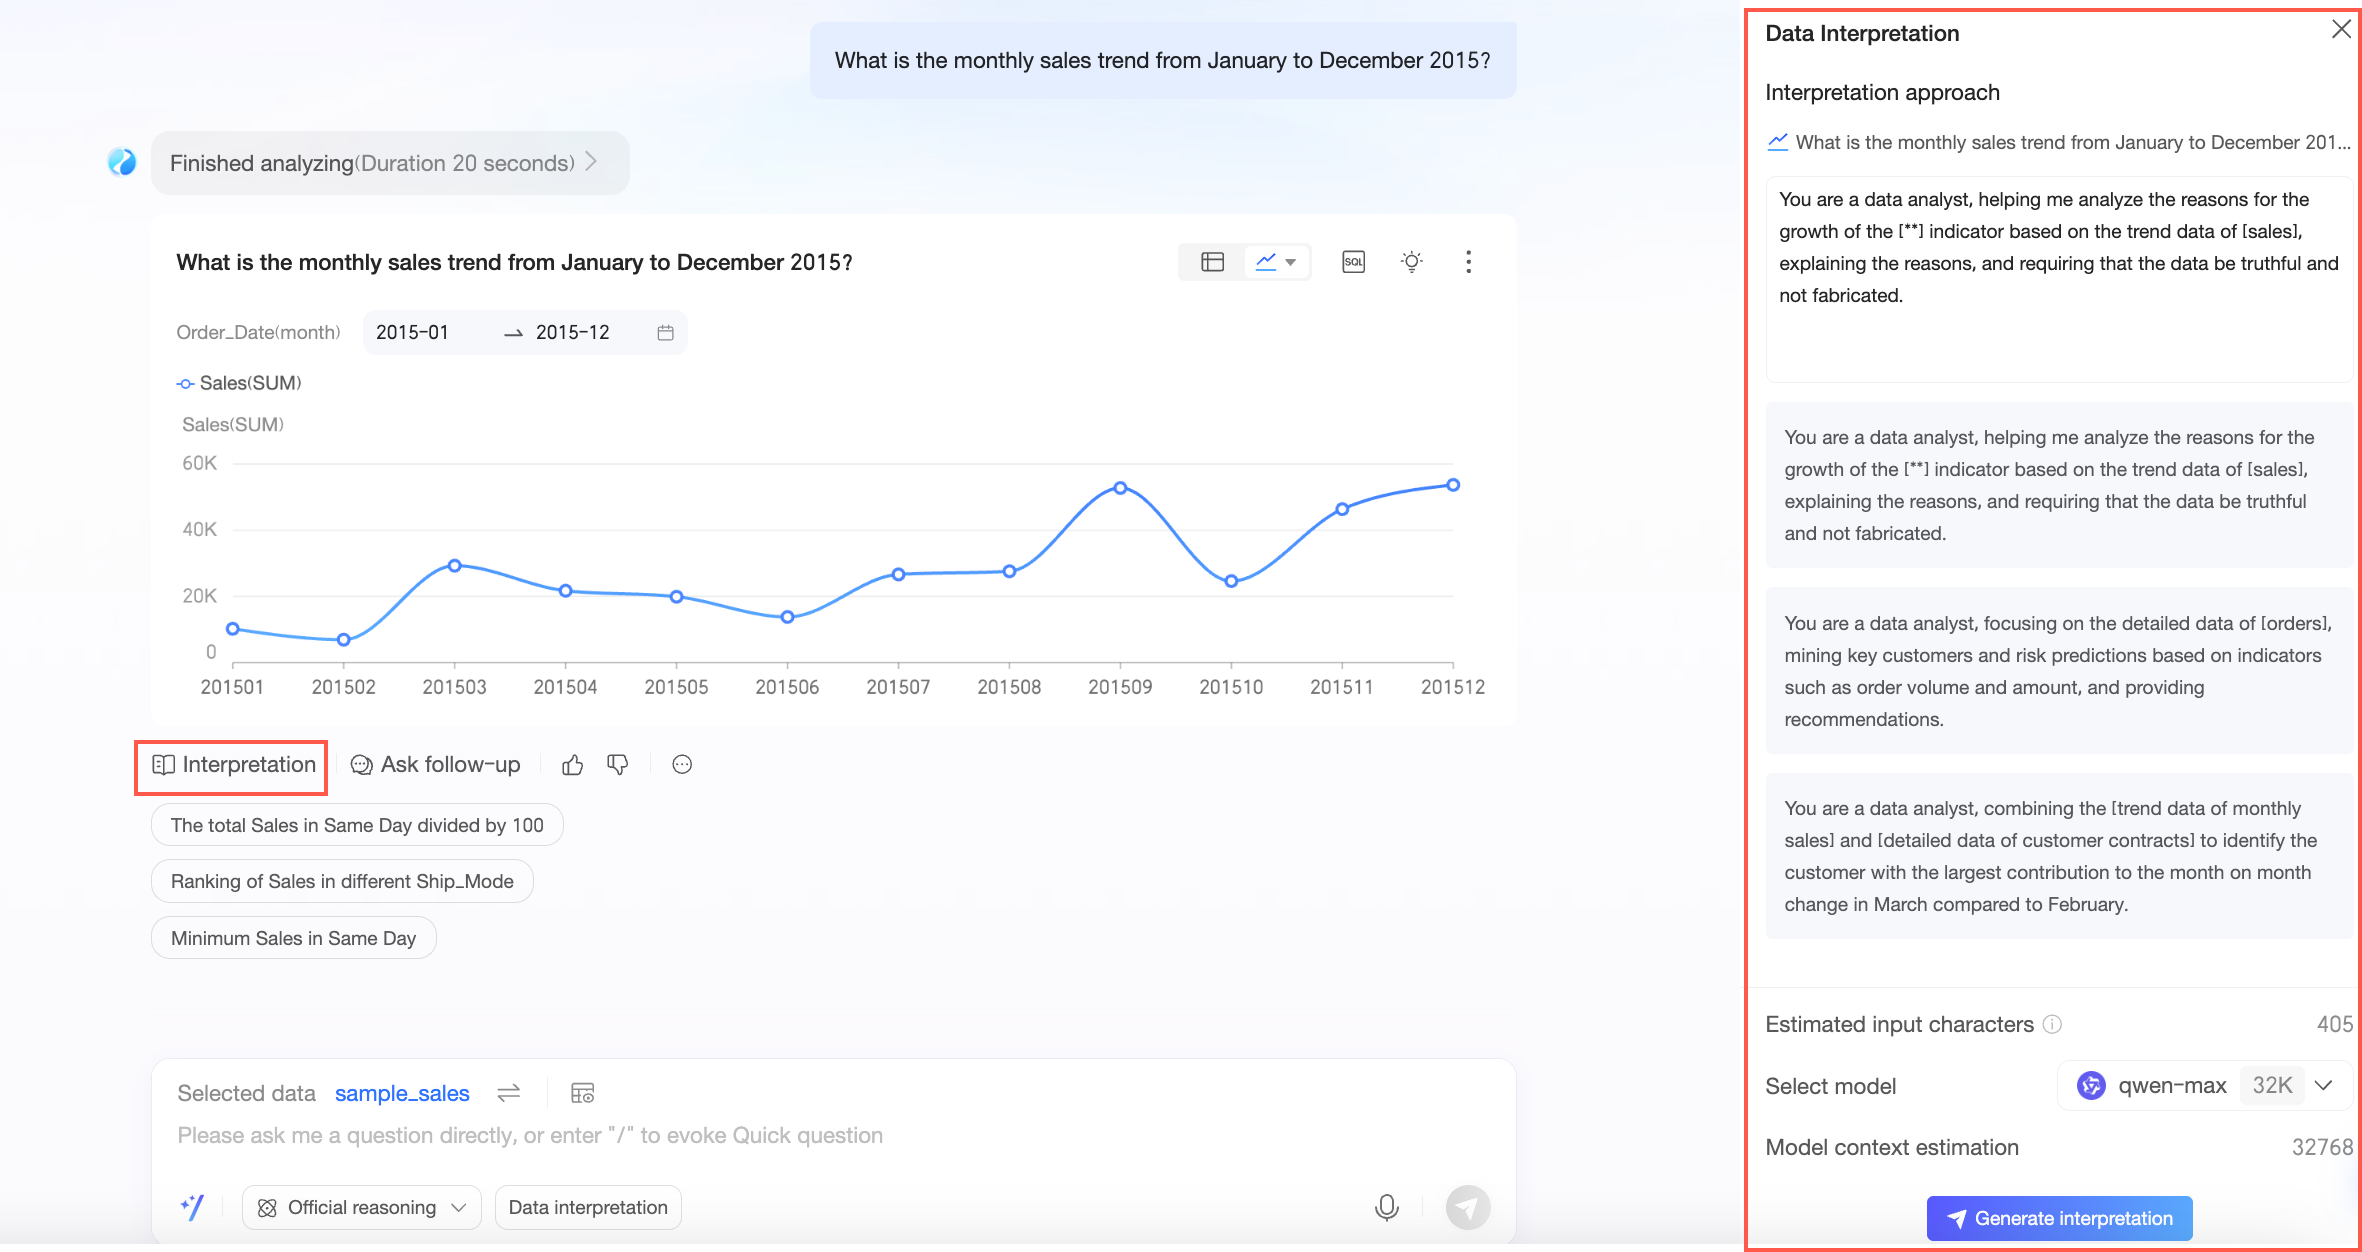
You can enter a custom interpretation approach, referencing the provided examples, select a model, and click Generate Interpretation. The system will automatically interpret the data for you.
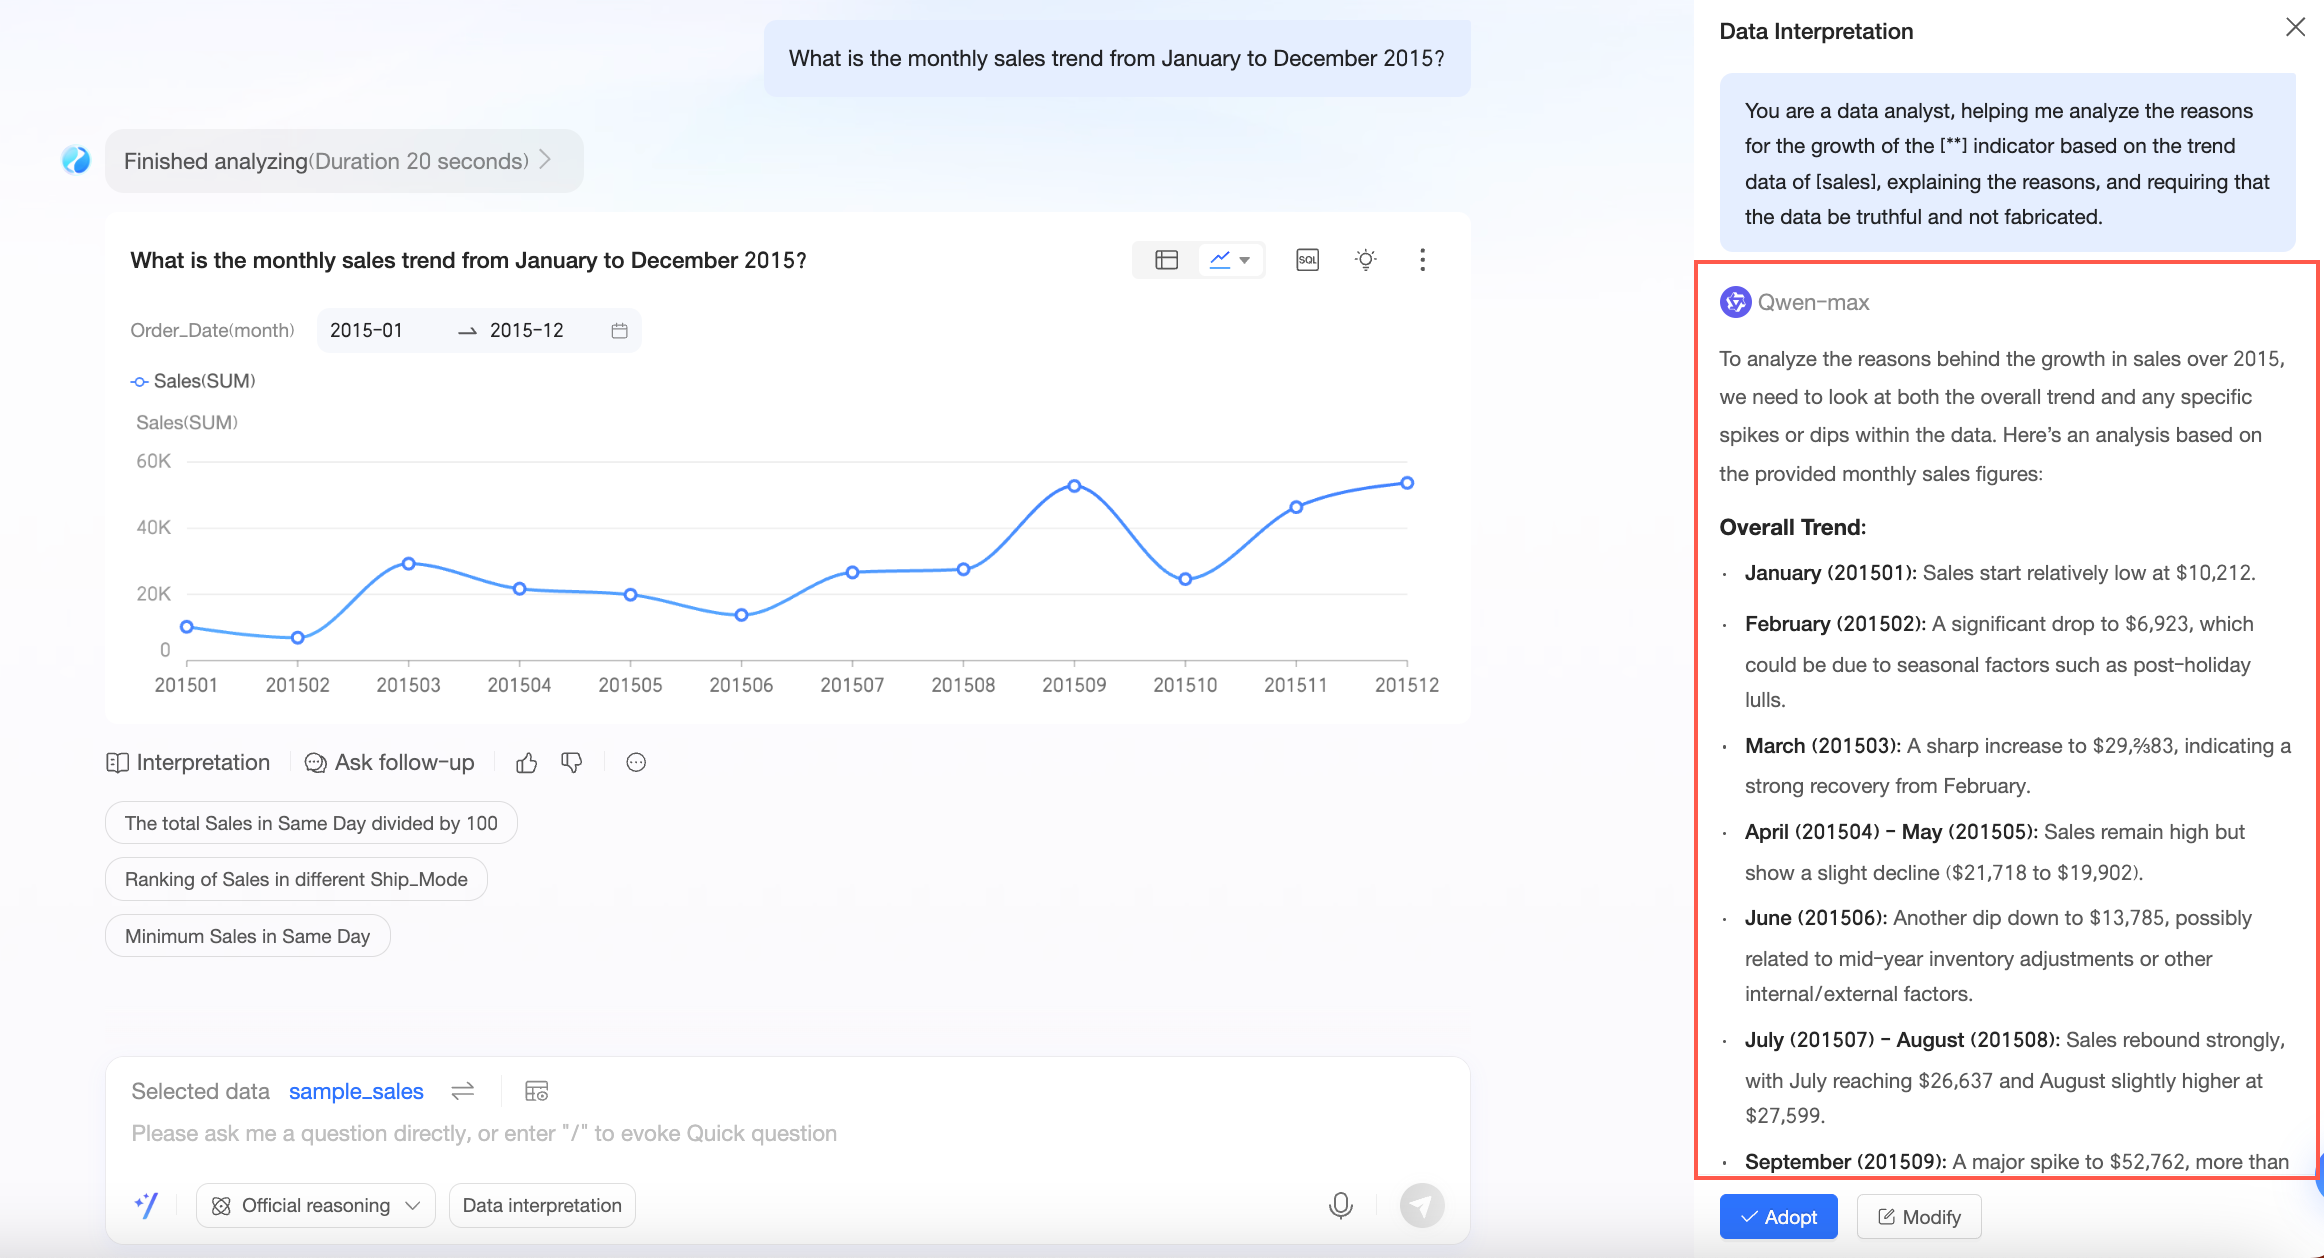
You can stop interpretation while the result is being generated.
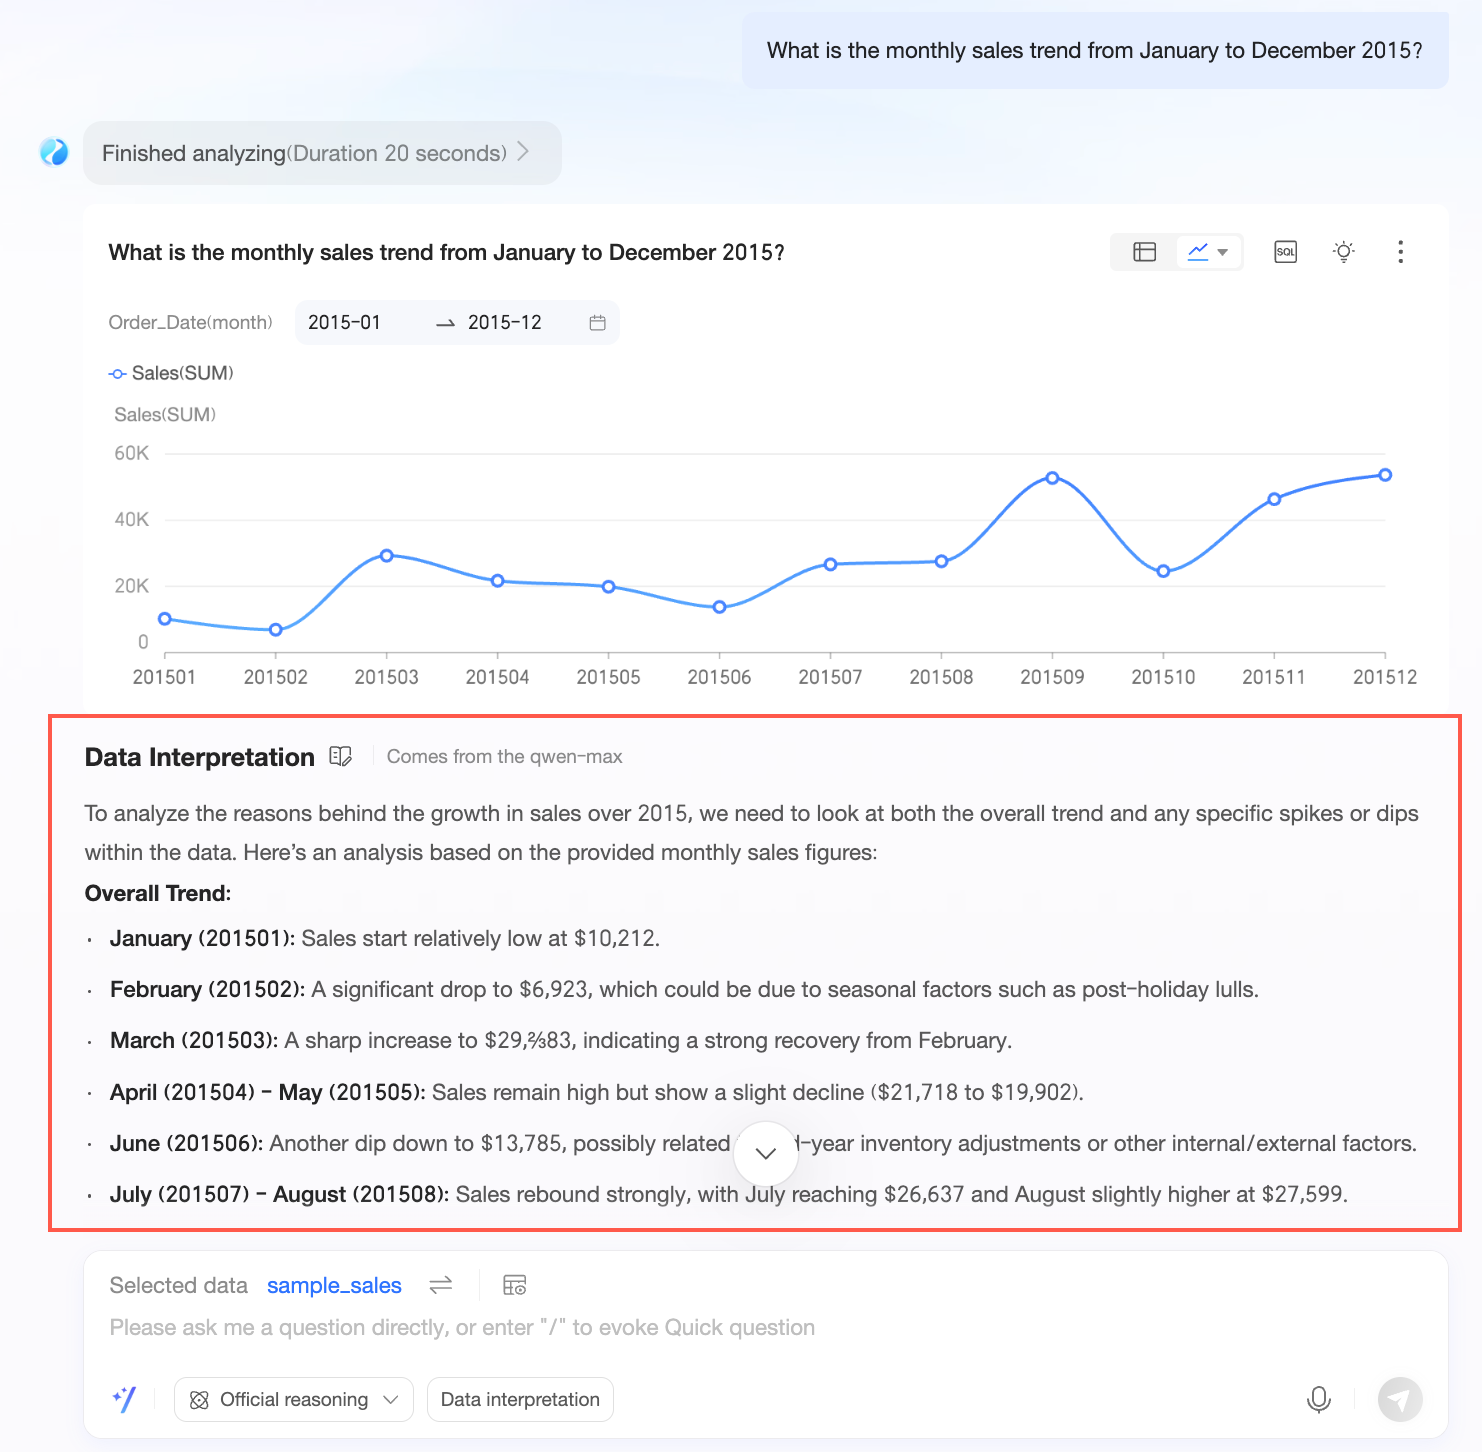
Adopting the result generates a data interpretation report.
If you want to modify the data interpretation approach or model for a second interpretation, click the
 icon to the right of the data interpretation, make your changes, and generate a new report.
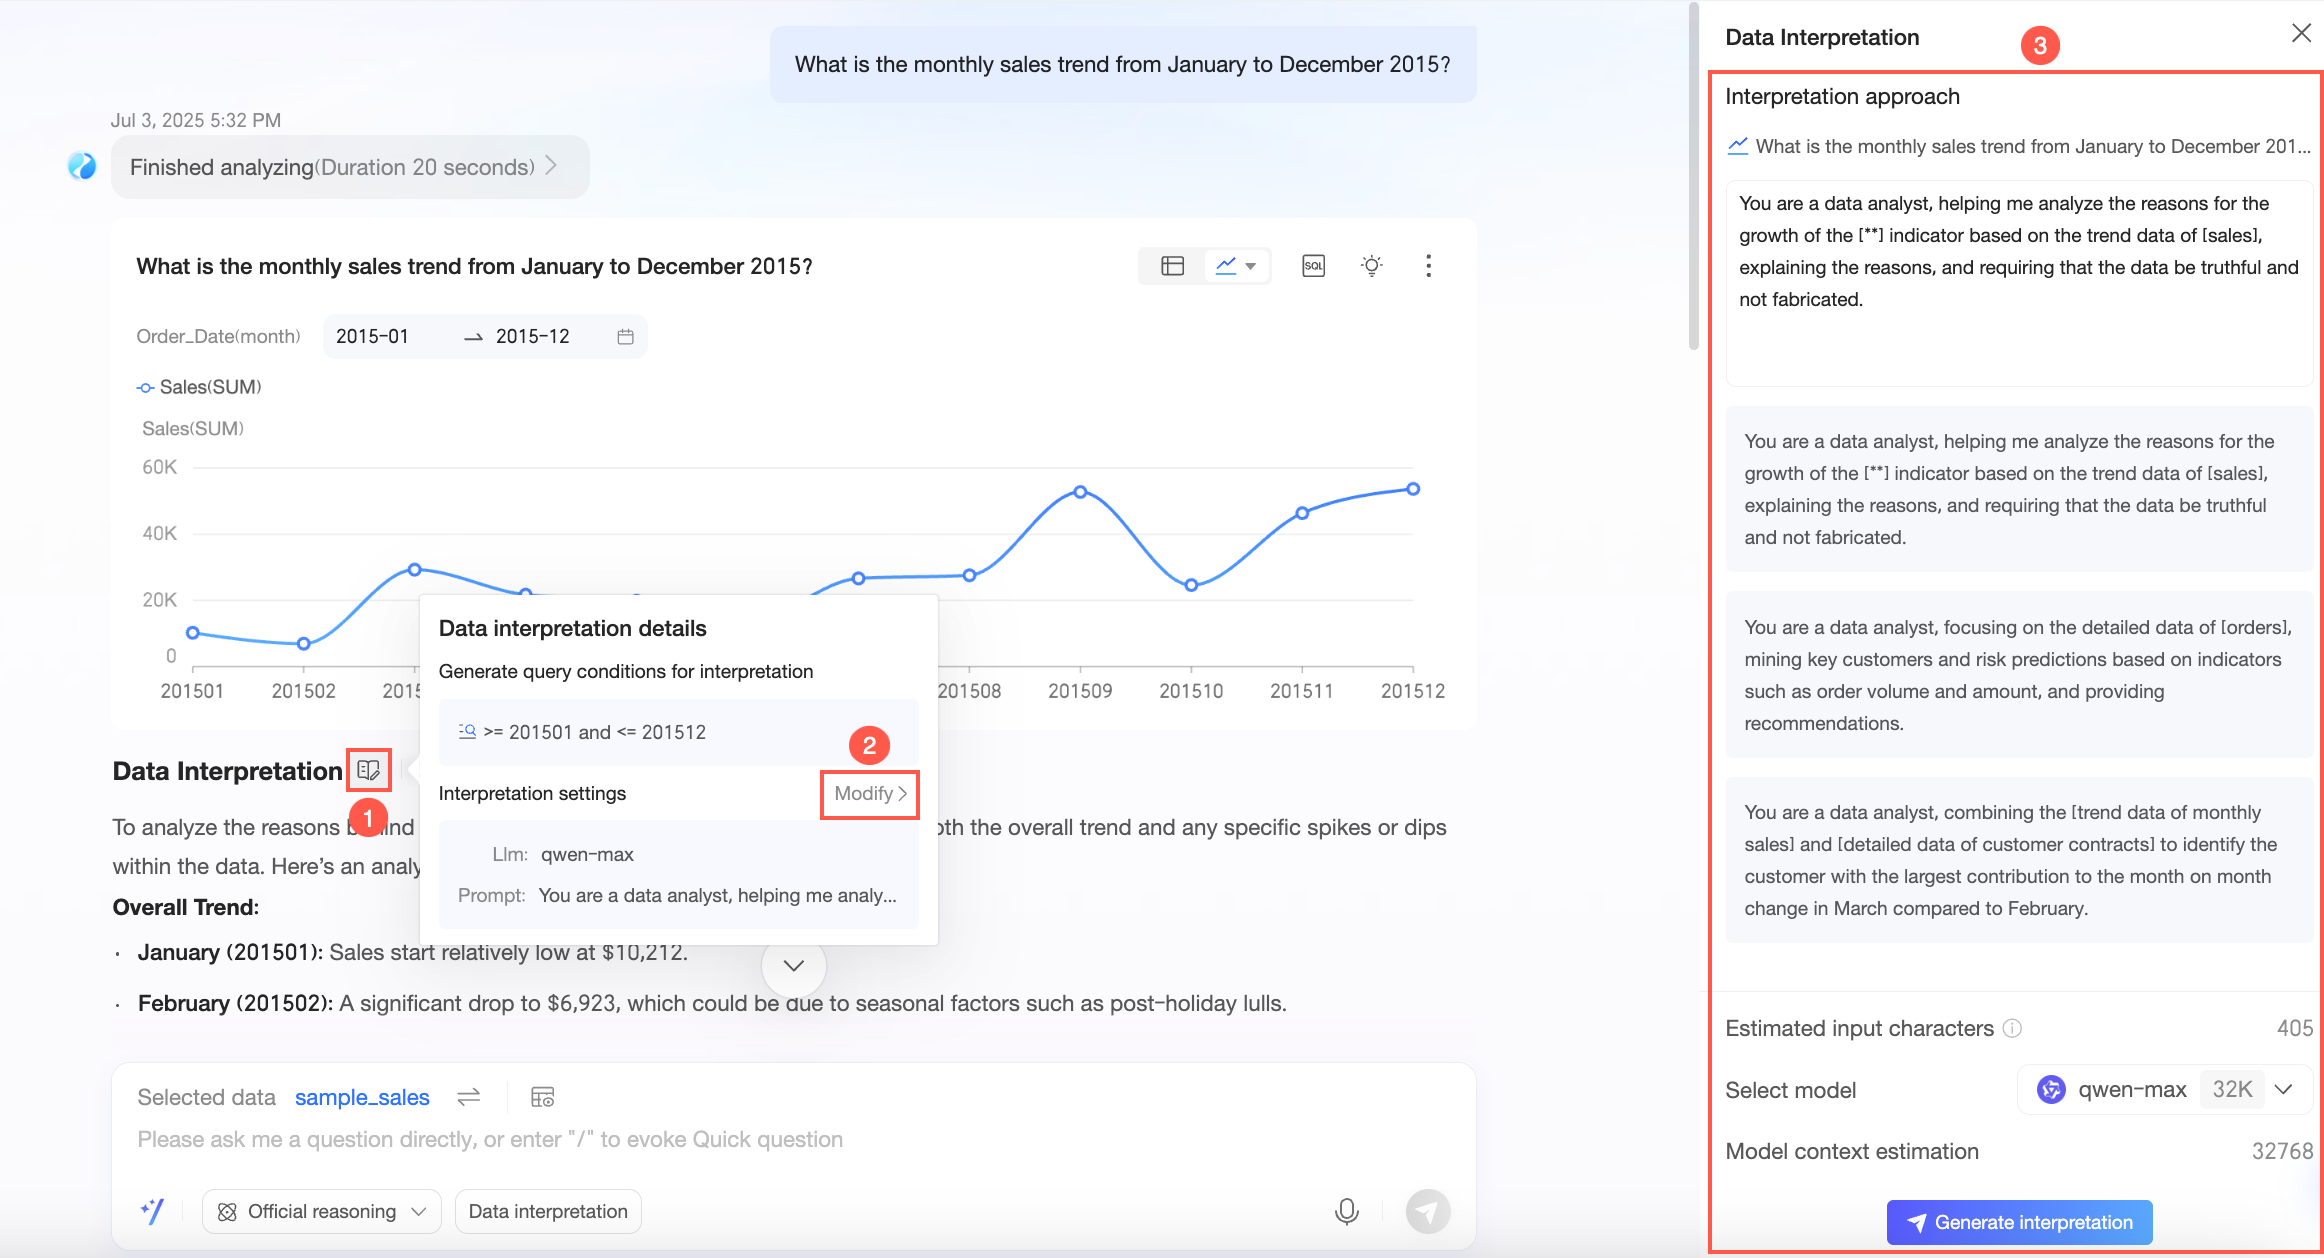
Follow-up Q&A (⑩)
Feedback (⑪)
Click
 to give a thumbs-up or
  to give a thumbs-down. When you give a thumbs-down, you can provide feedback.
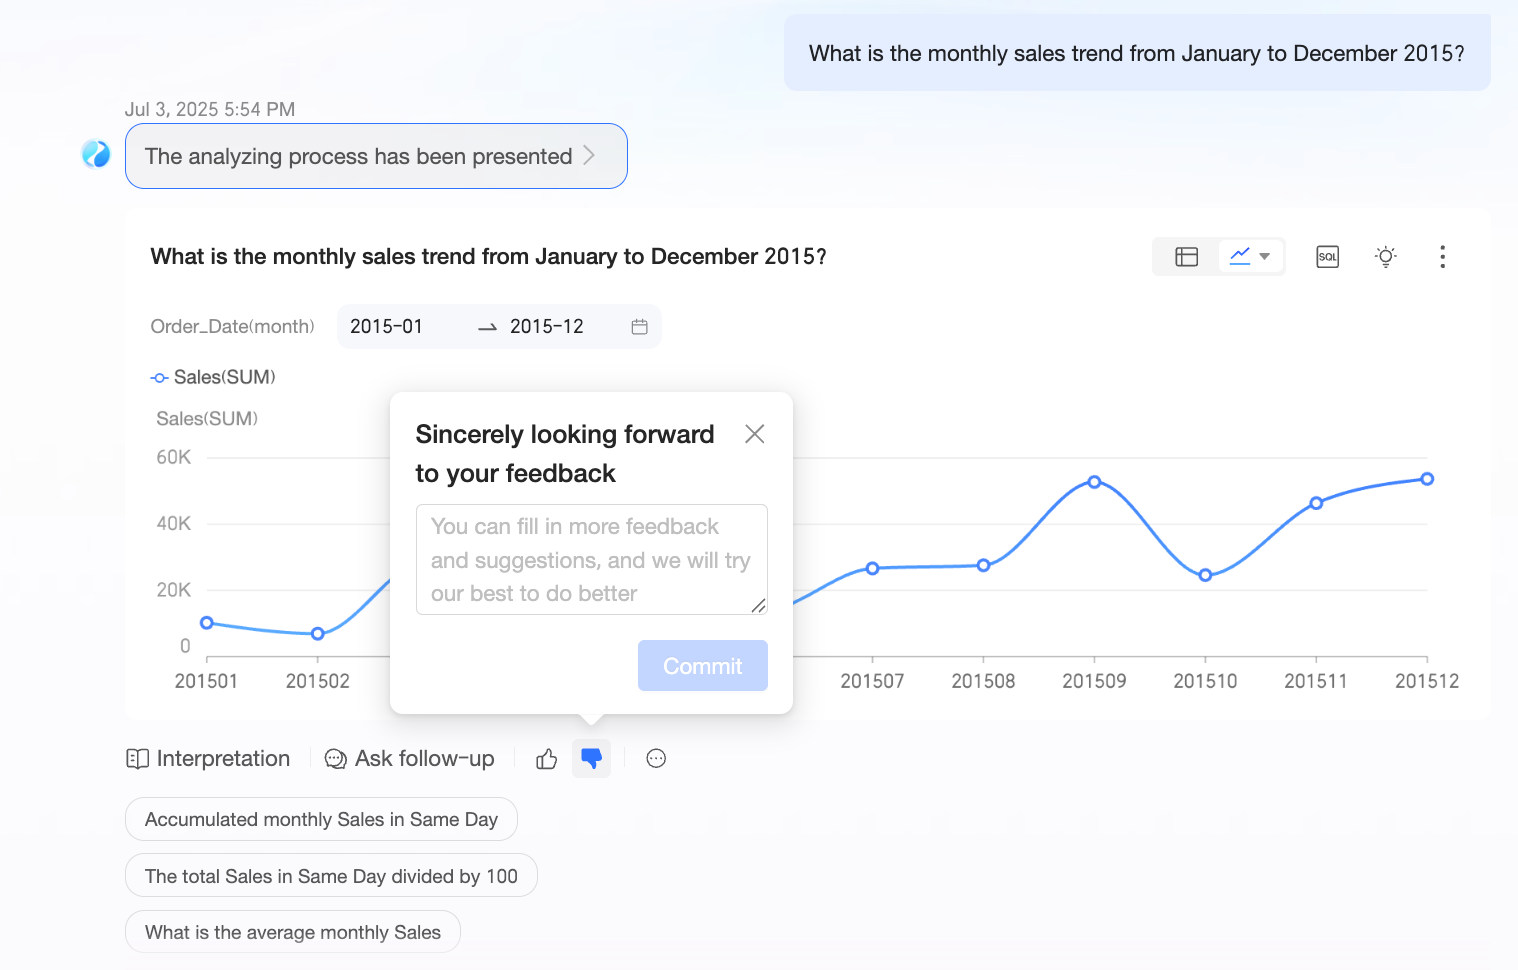
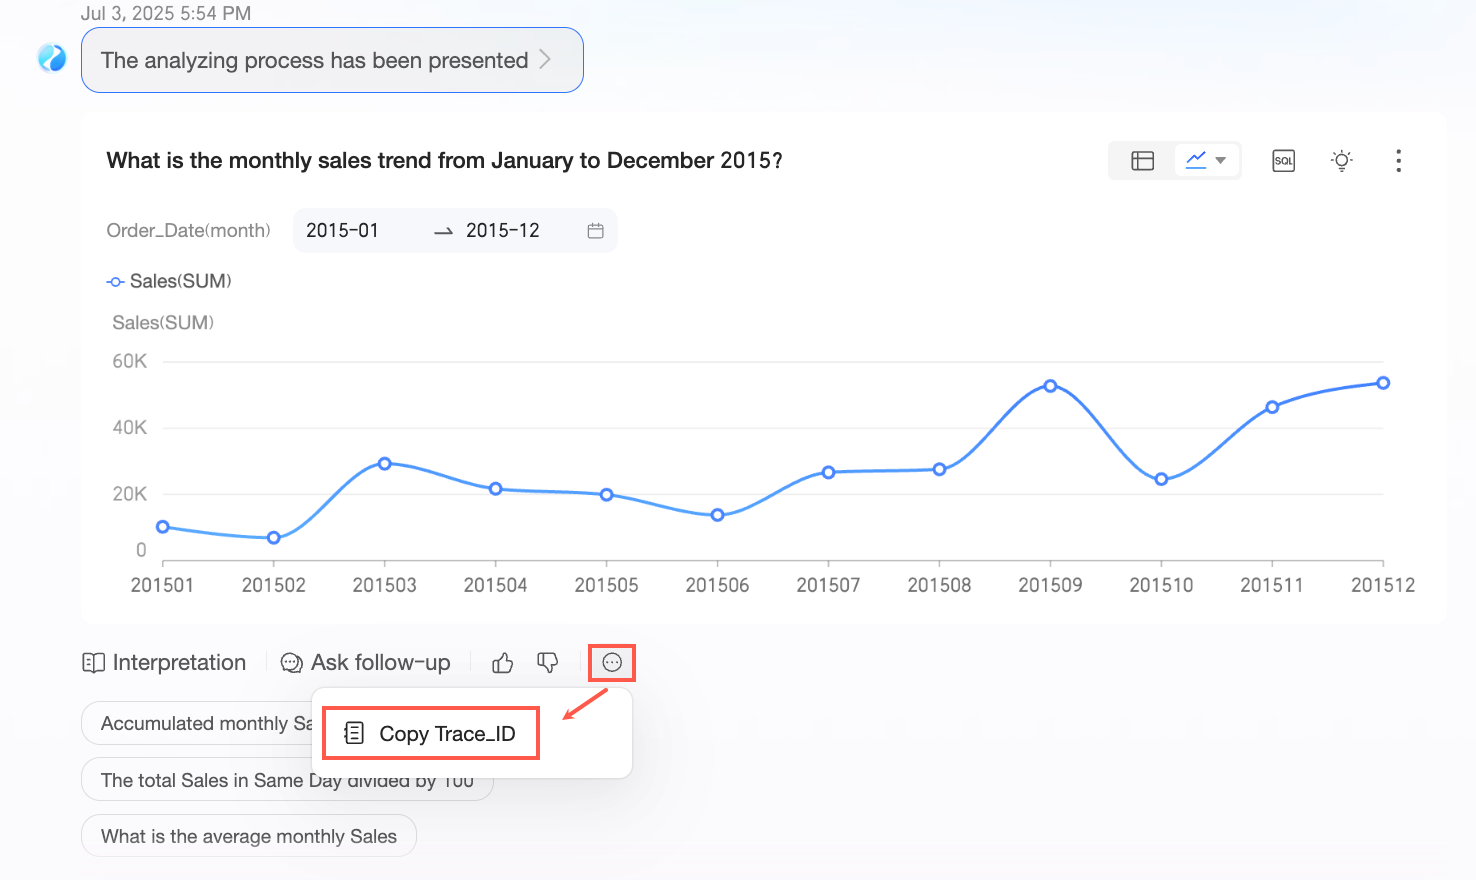
Copy Trace ID (⑫)
Inference and interpretation methods
Methods
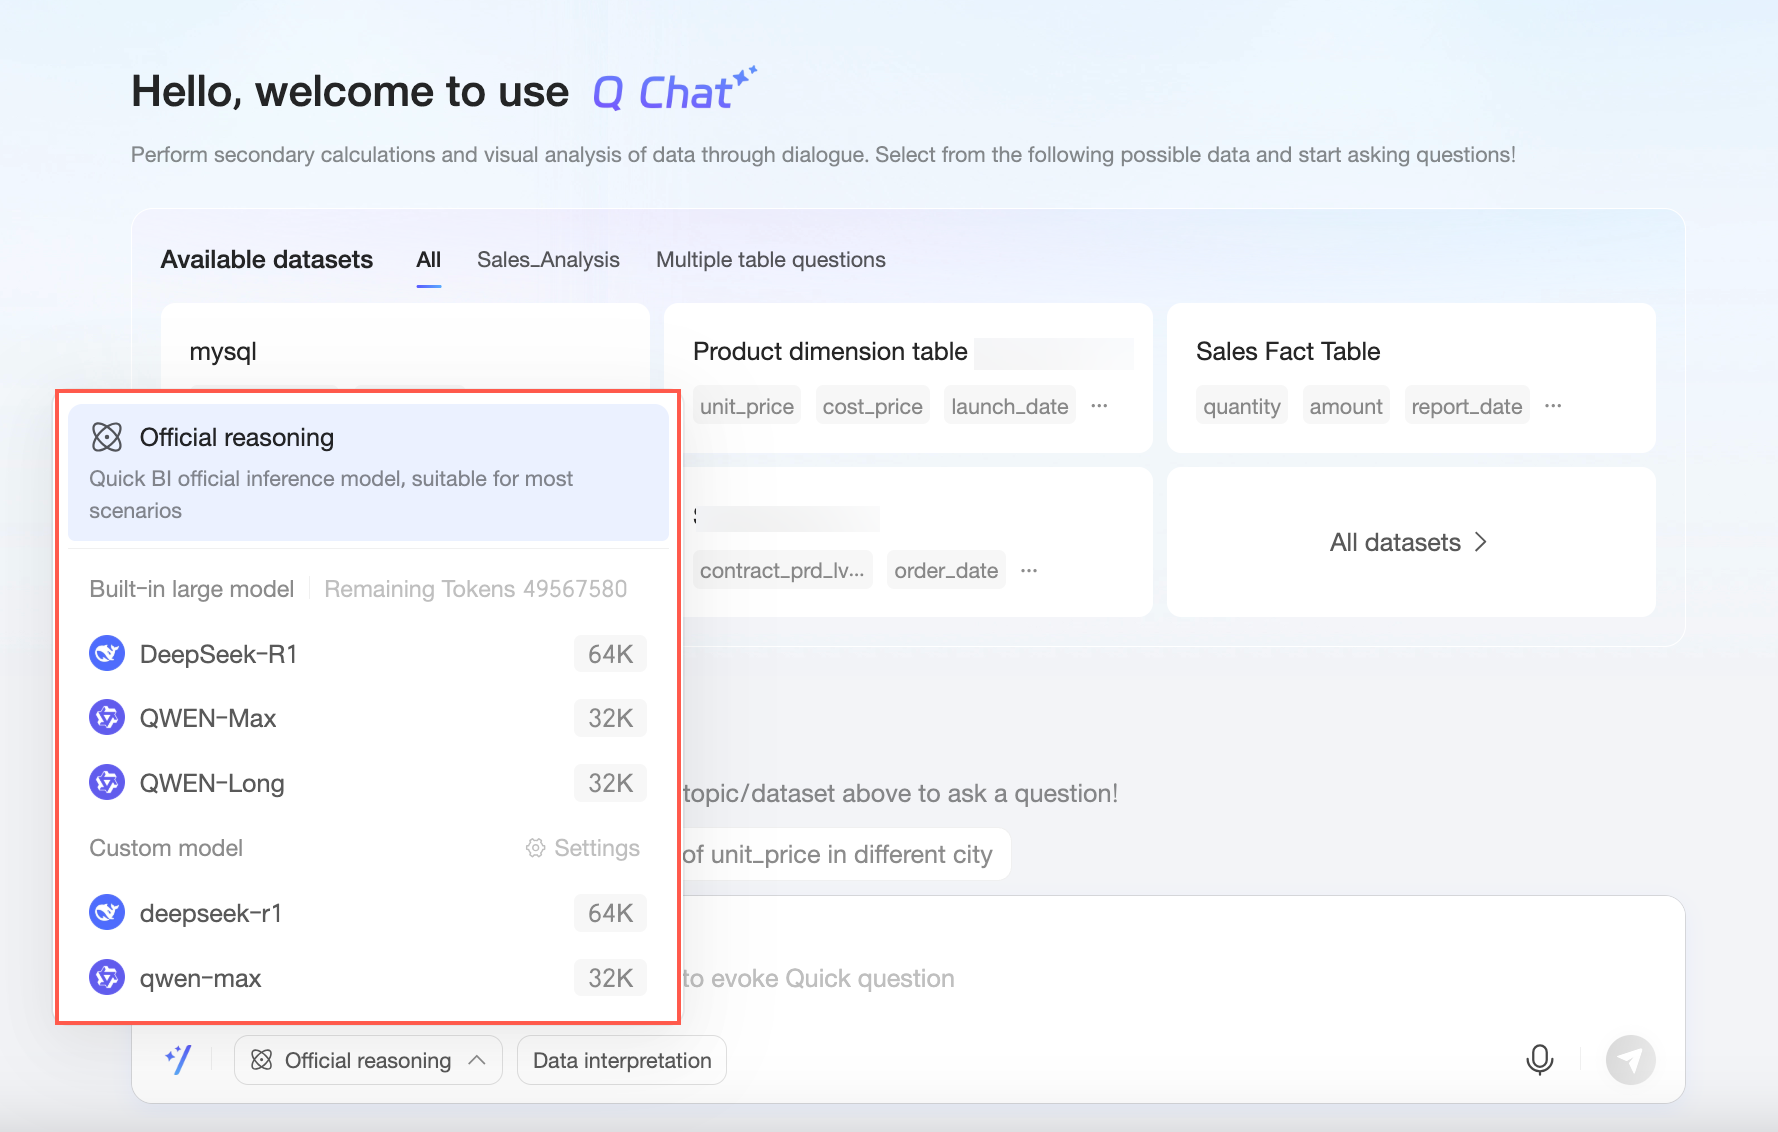
By default, the system uses its own models for inference and interpretation. You can choose between the system's built-in LLM and your own custom model. Select the appropriate inference and interpretation methods based on your business needs.
Examples
The following examples show the results for the question "What is the proportion of orders for each order level?" using different inference and interpretation methods.
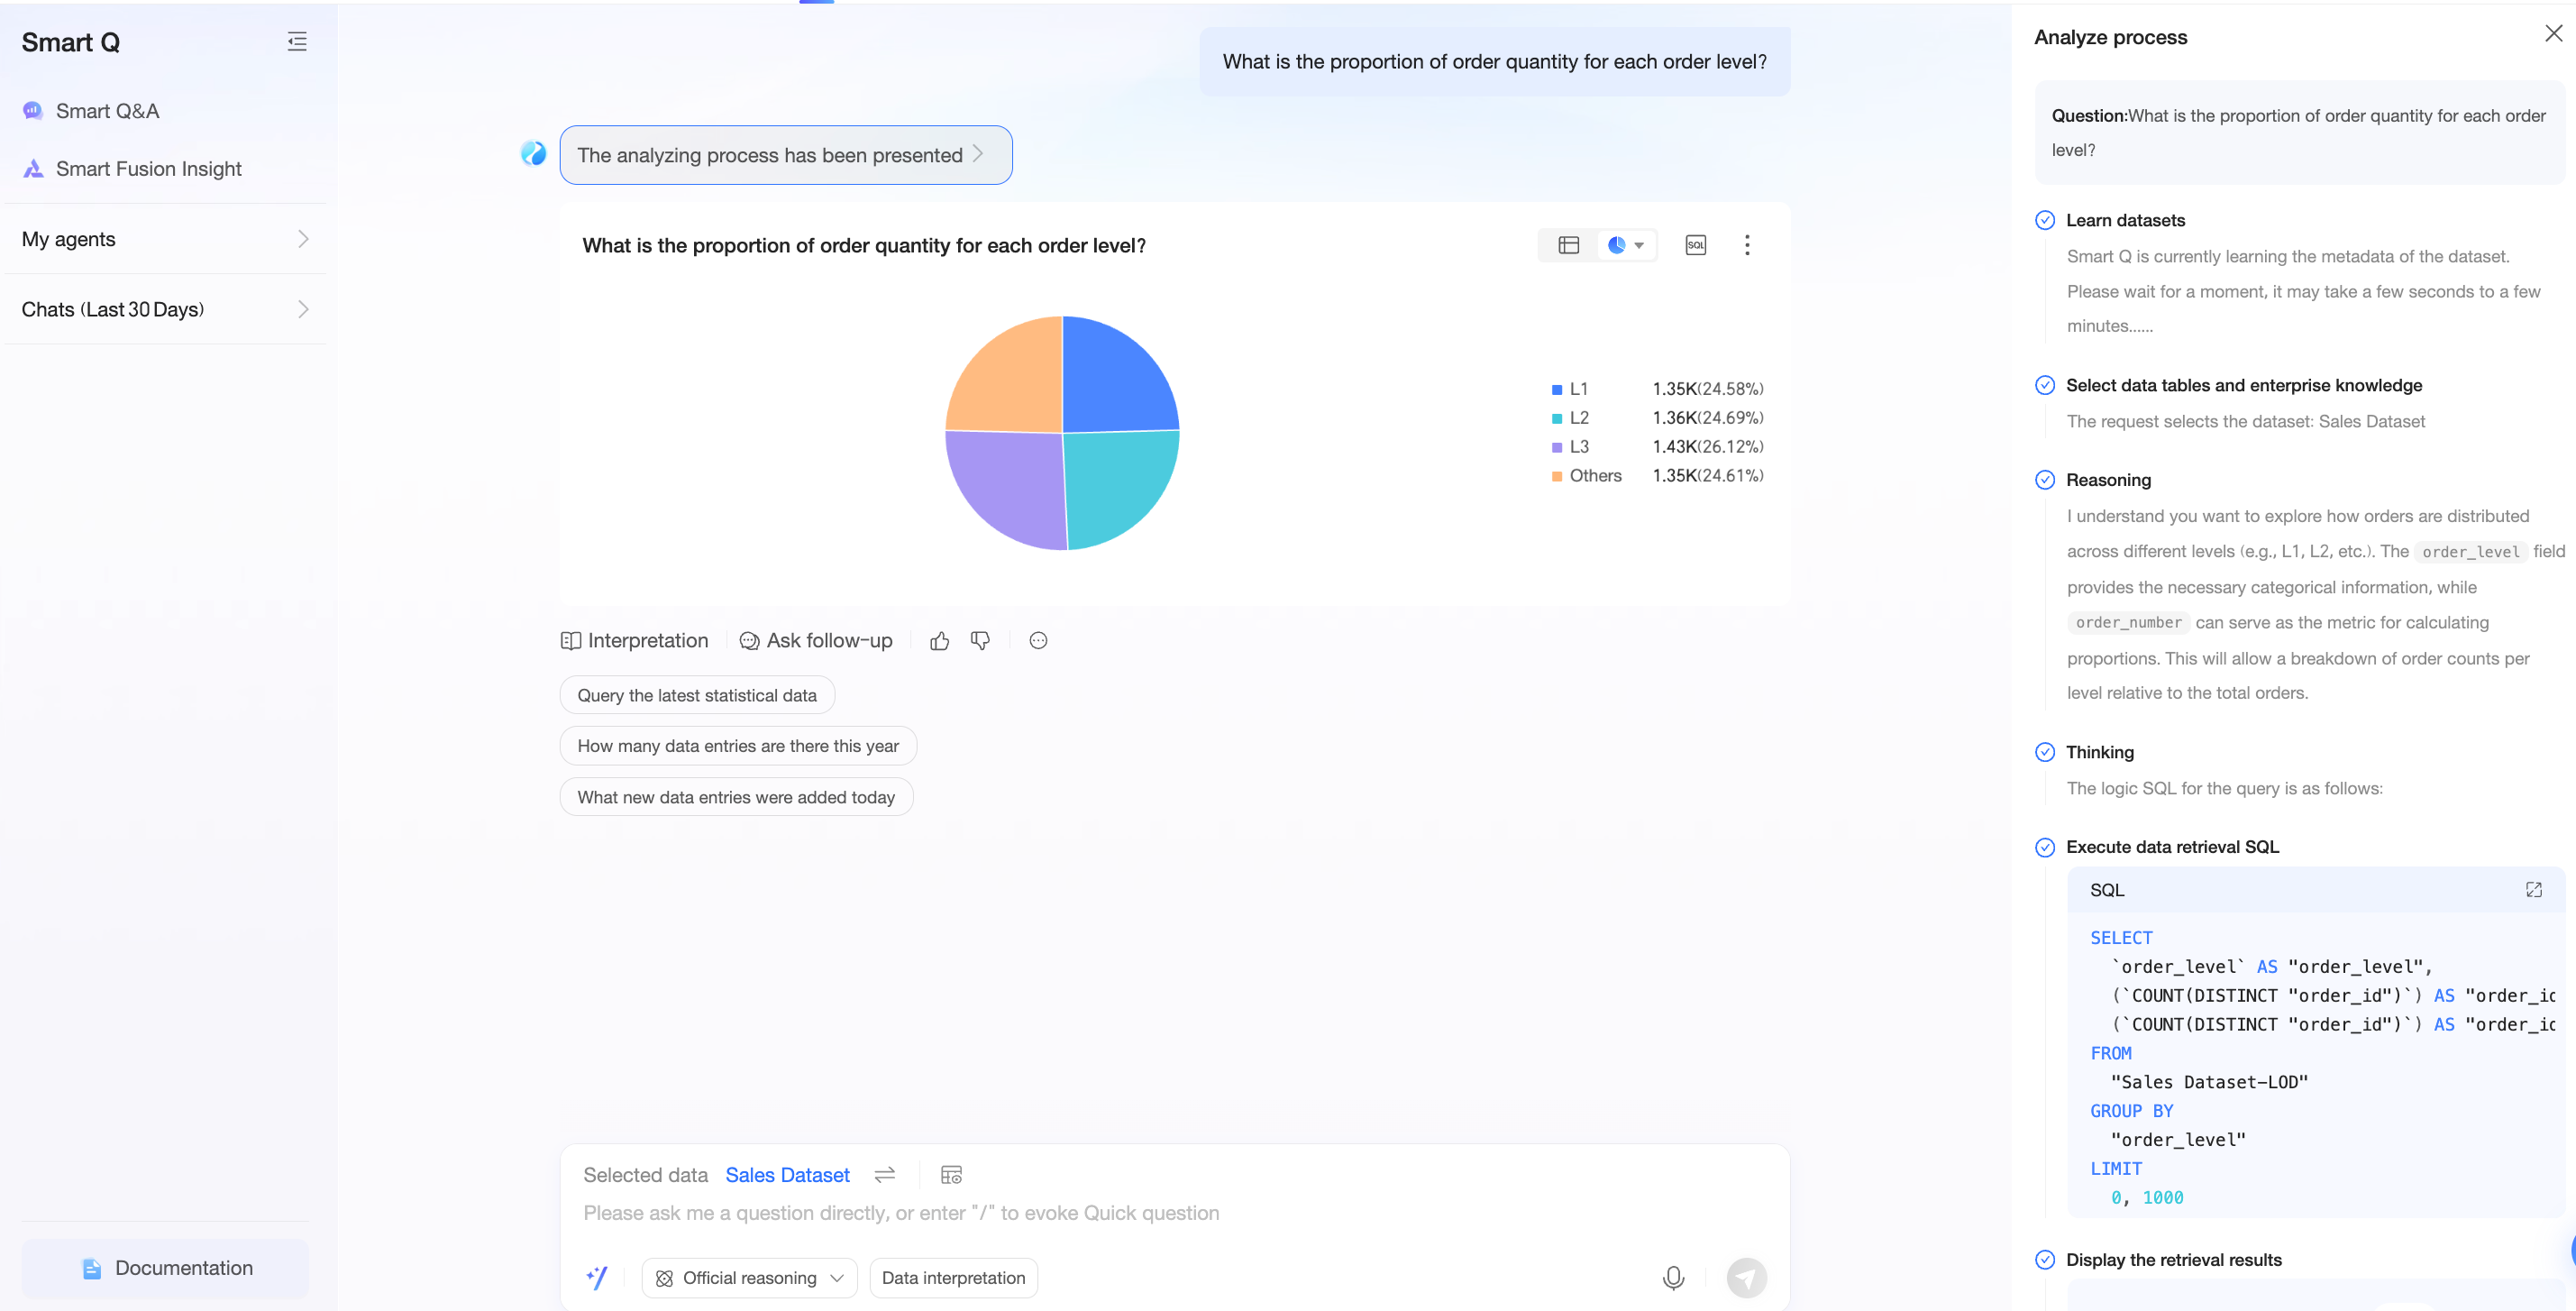
Example 1: Use the default official inference and no data interpretation.
The system returns the analysis process and a chart.
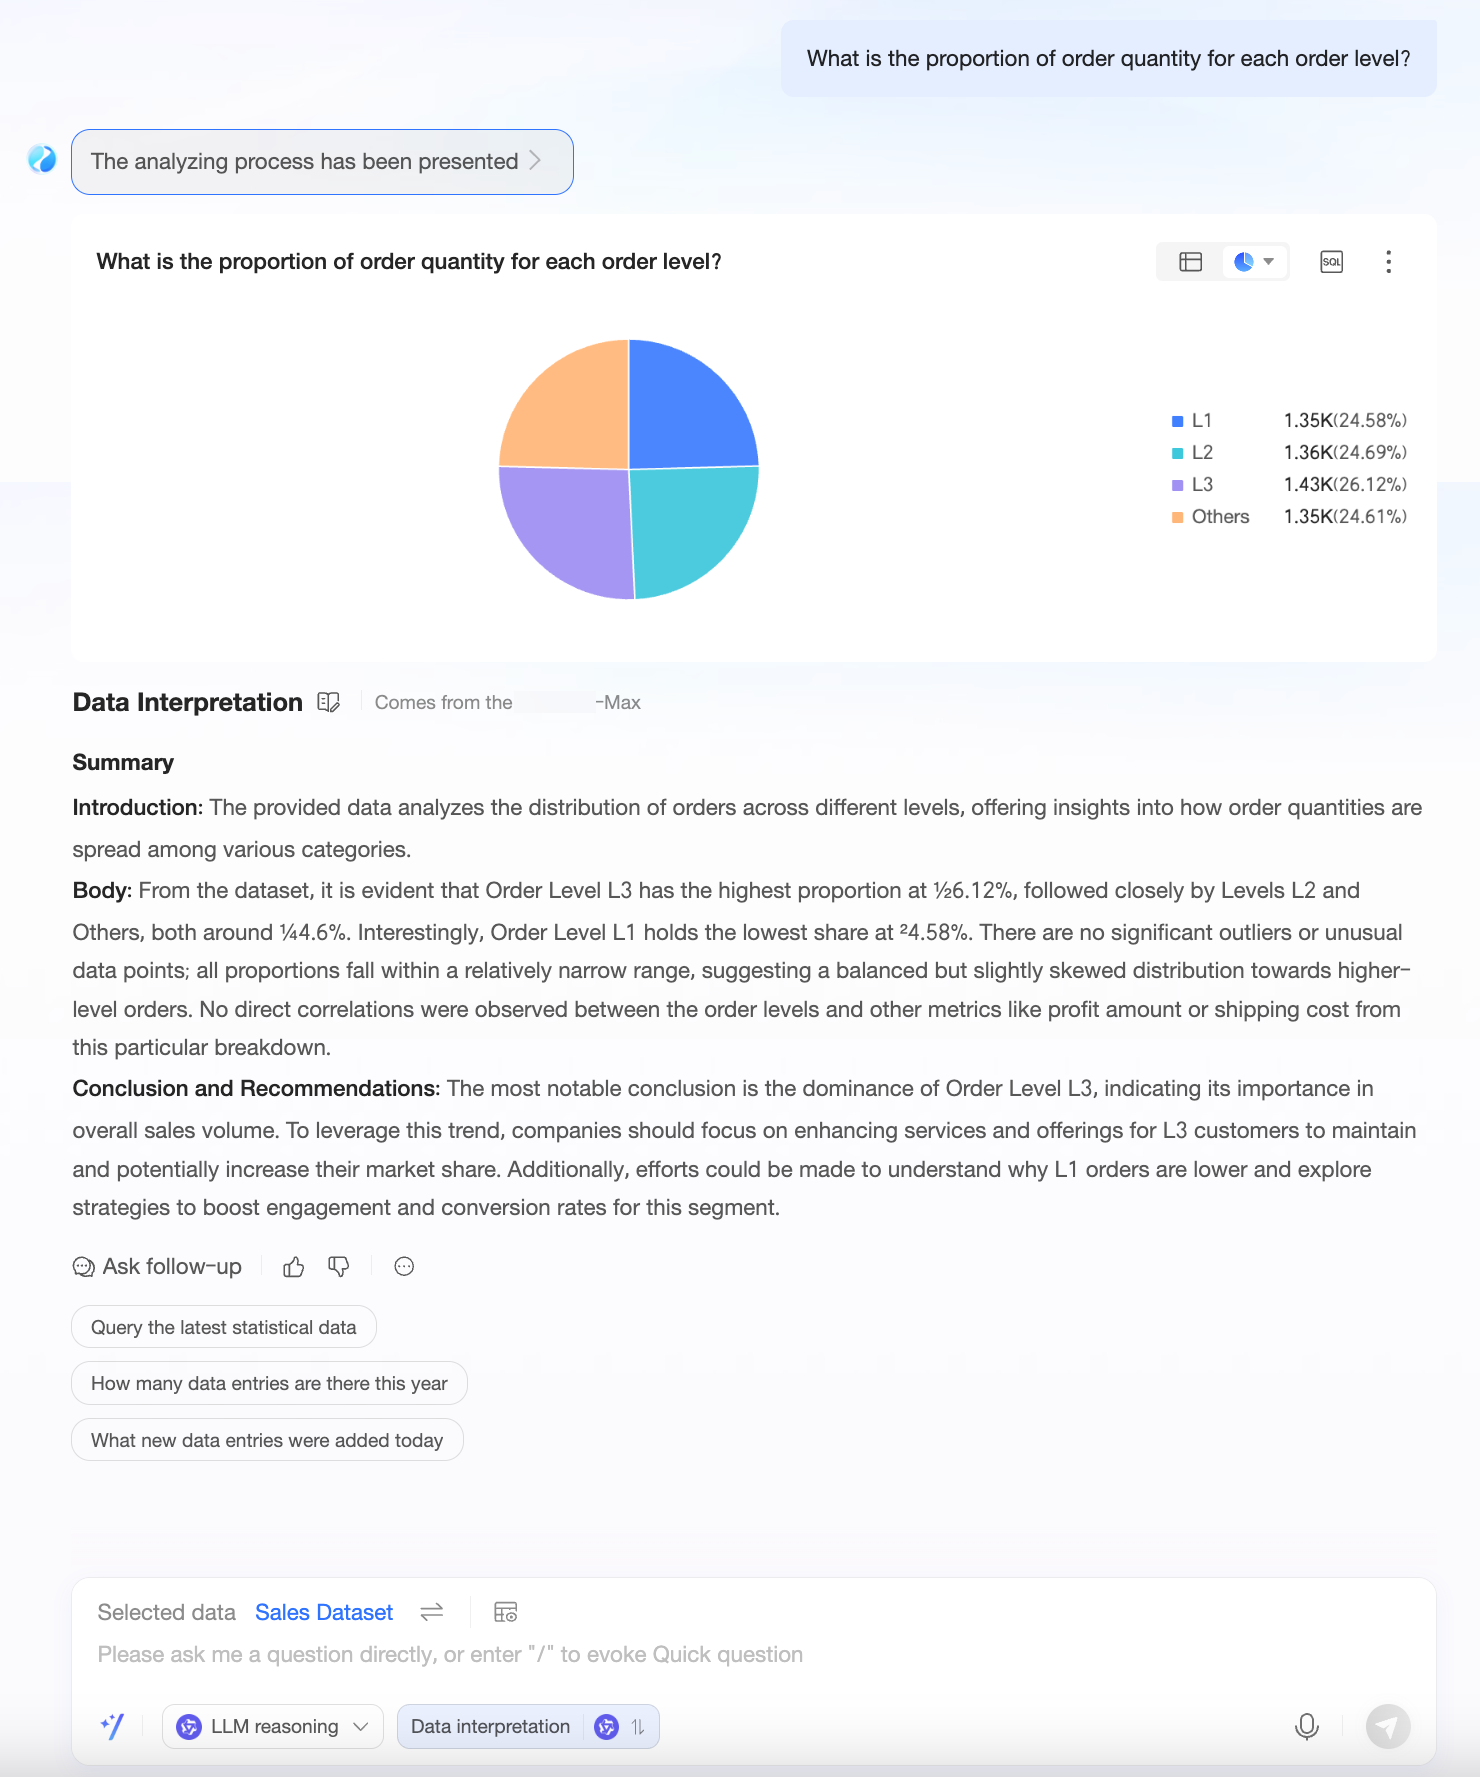
Example 2: Use the built-in Qwen-Max model for both inference and data interpretation.
The system uses the Qwen-Max model to return the inference process, data interpretation result, and a chart.
Example 3: Use the built-in DeepSeek-R1 model for both inference and data interpretation.
The system uses the DeepSeek-R1 model to return the inference process, data interpretation result, and a chart.
Ask a follow-up question
You can use the follow-up Q&A feature to ask for more details about the previous result, for a more focused analysis. The following example shows how to do this.
You can ask only one follow-up question for each main question.
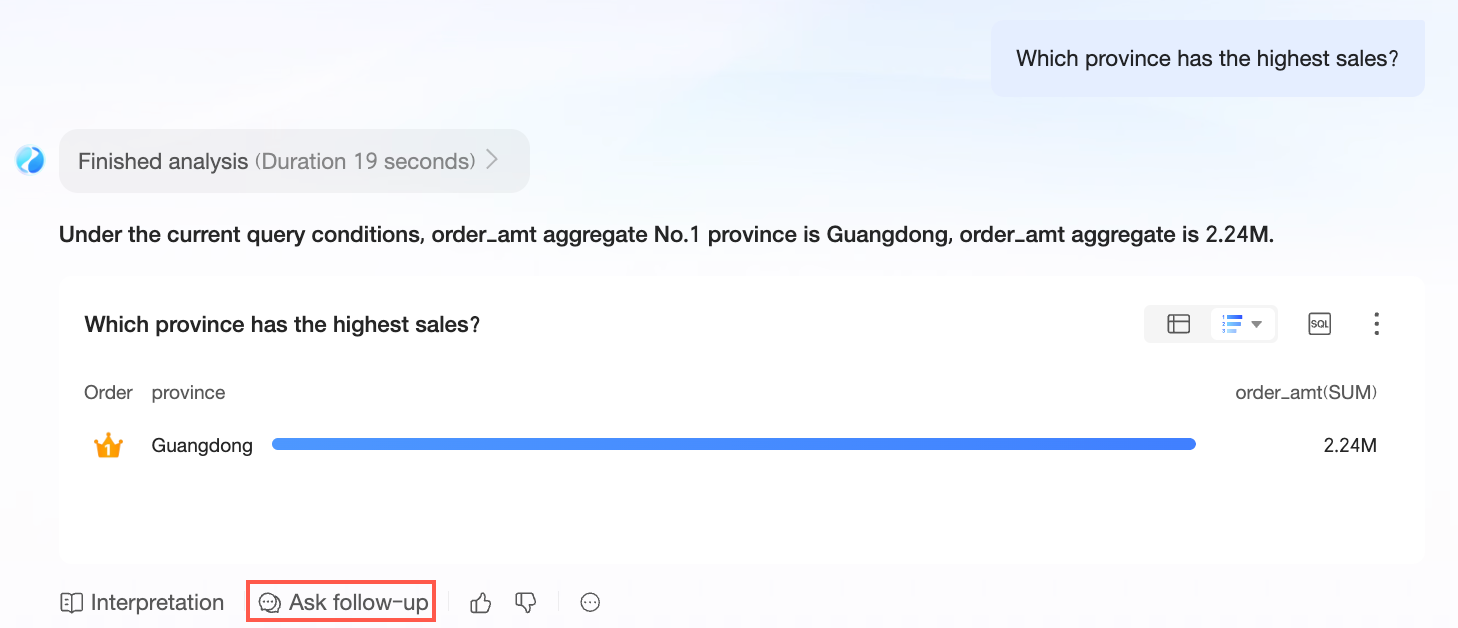
In the conversation interface, click Follow-up Q&A to ask a question related to the answer for "Which province has the highest sales?"
Enter a follow-up question, such as: What is the top-selling product?
Click the
 icon in the lower-right corner of the dialog box or press Enter to send the question and get the analysis result.
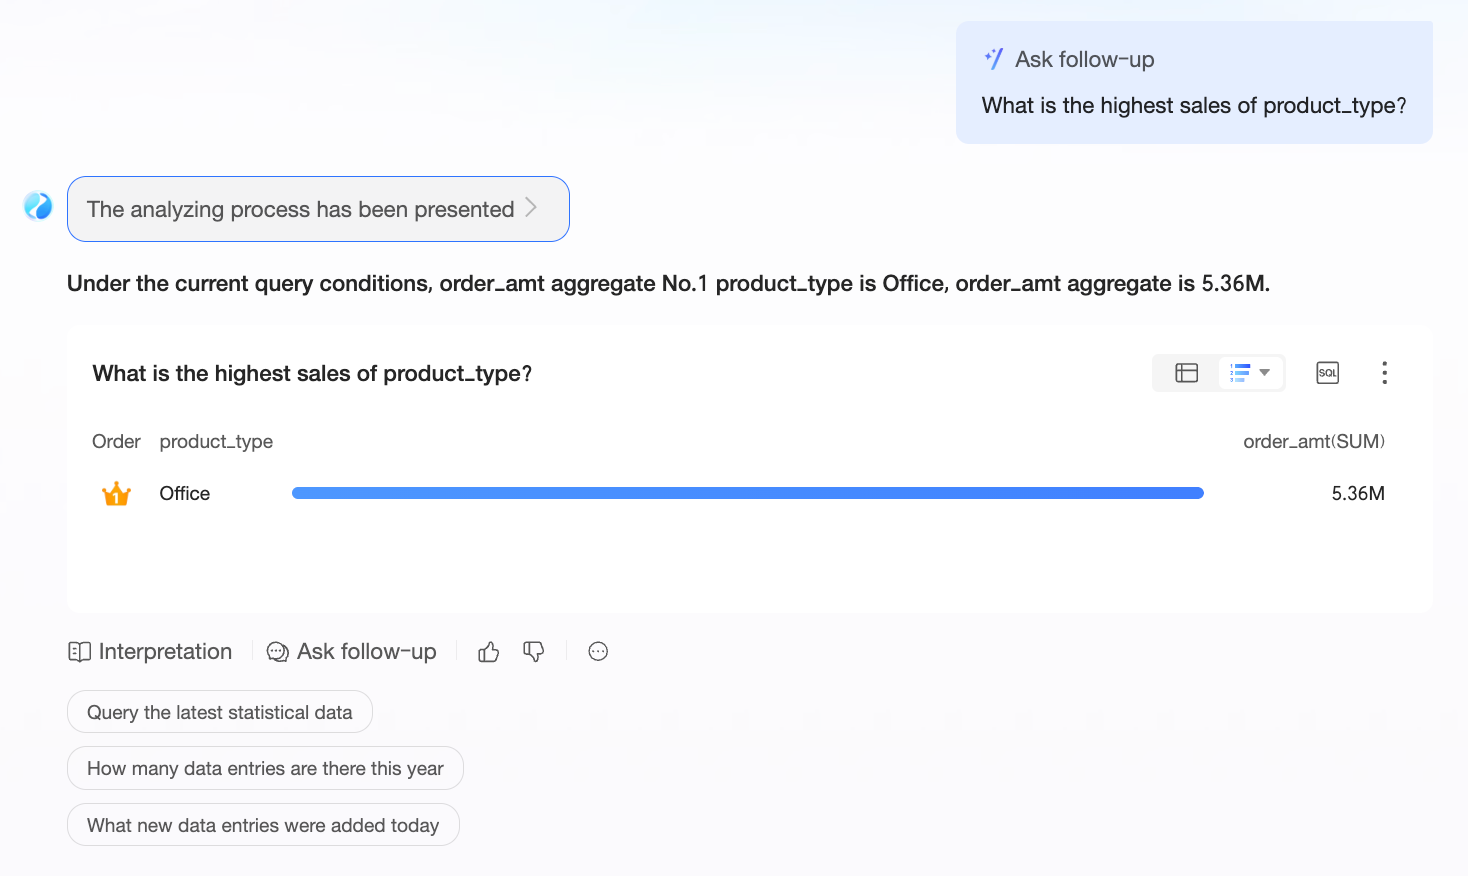 Note
NoteThe system automatically exits follow-up Q&A mode. If you want to ask another follow-up question, click the follow-up Q&A button again.
Conversation list
Click the
 icon in the upper-left corner to view your Q Chat conversation history.
Click the
 icon to start a new Q Chat session.
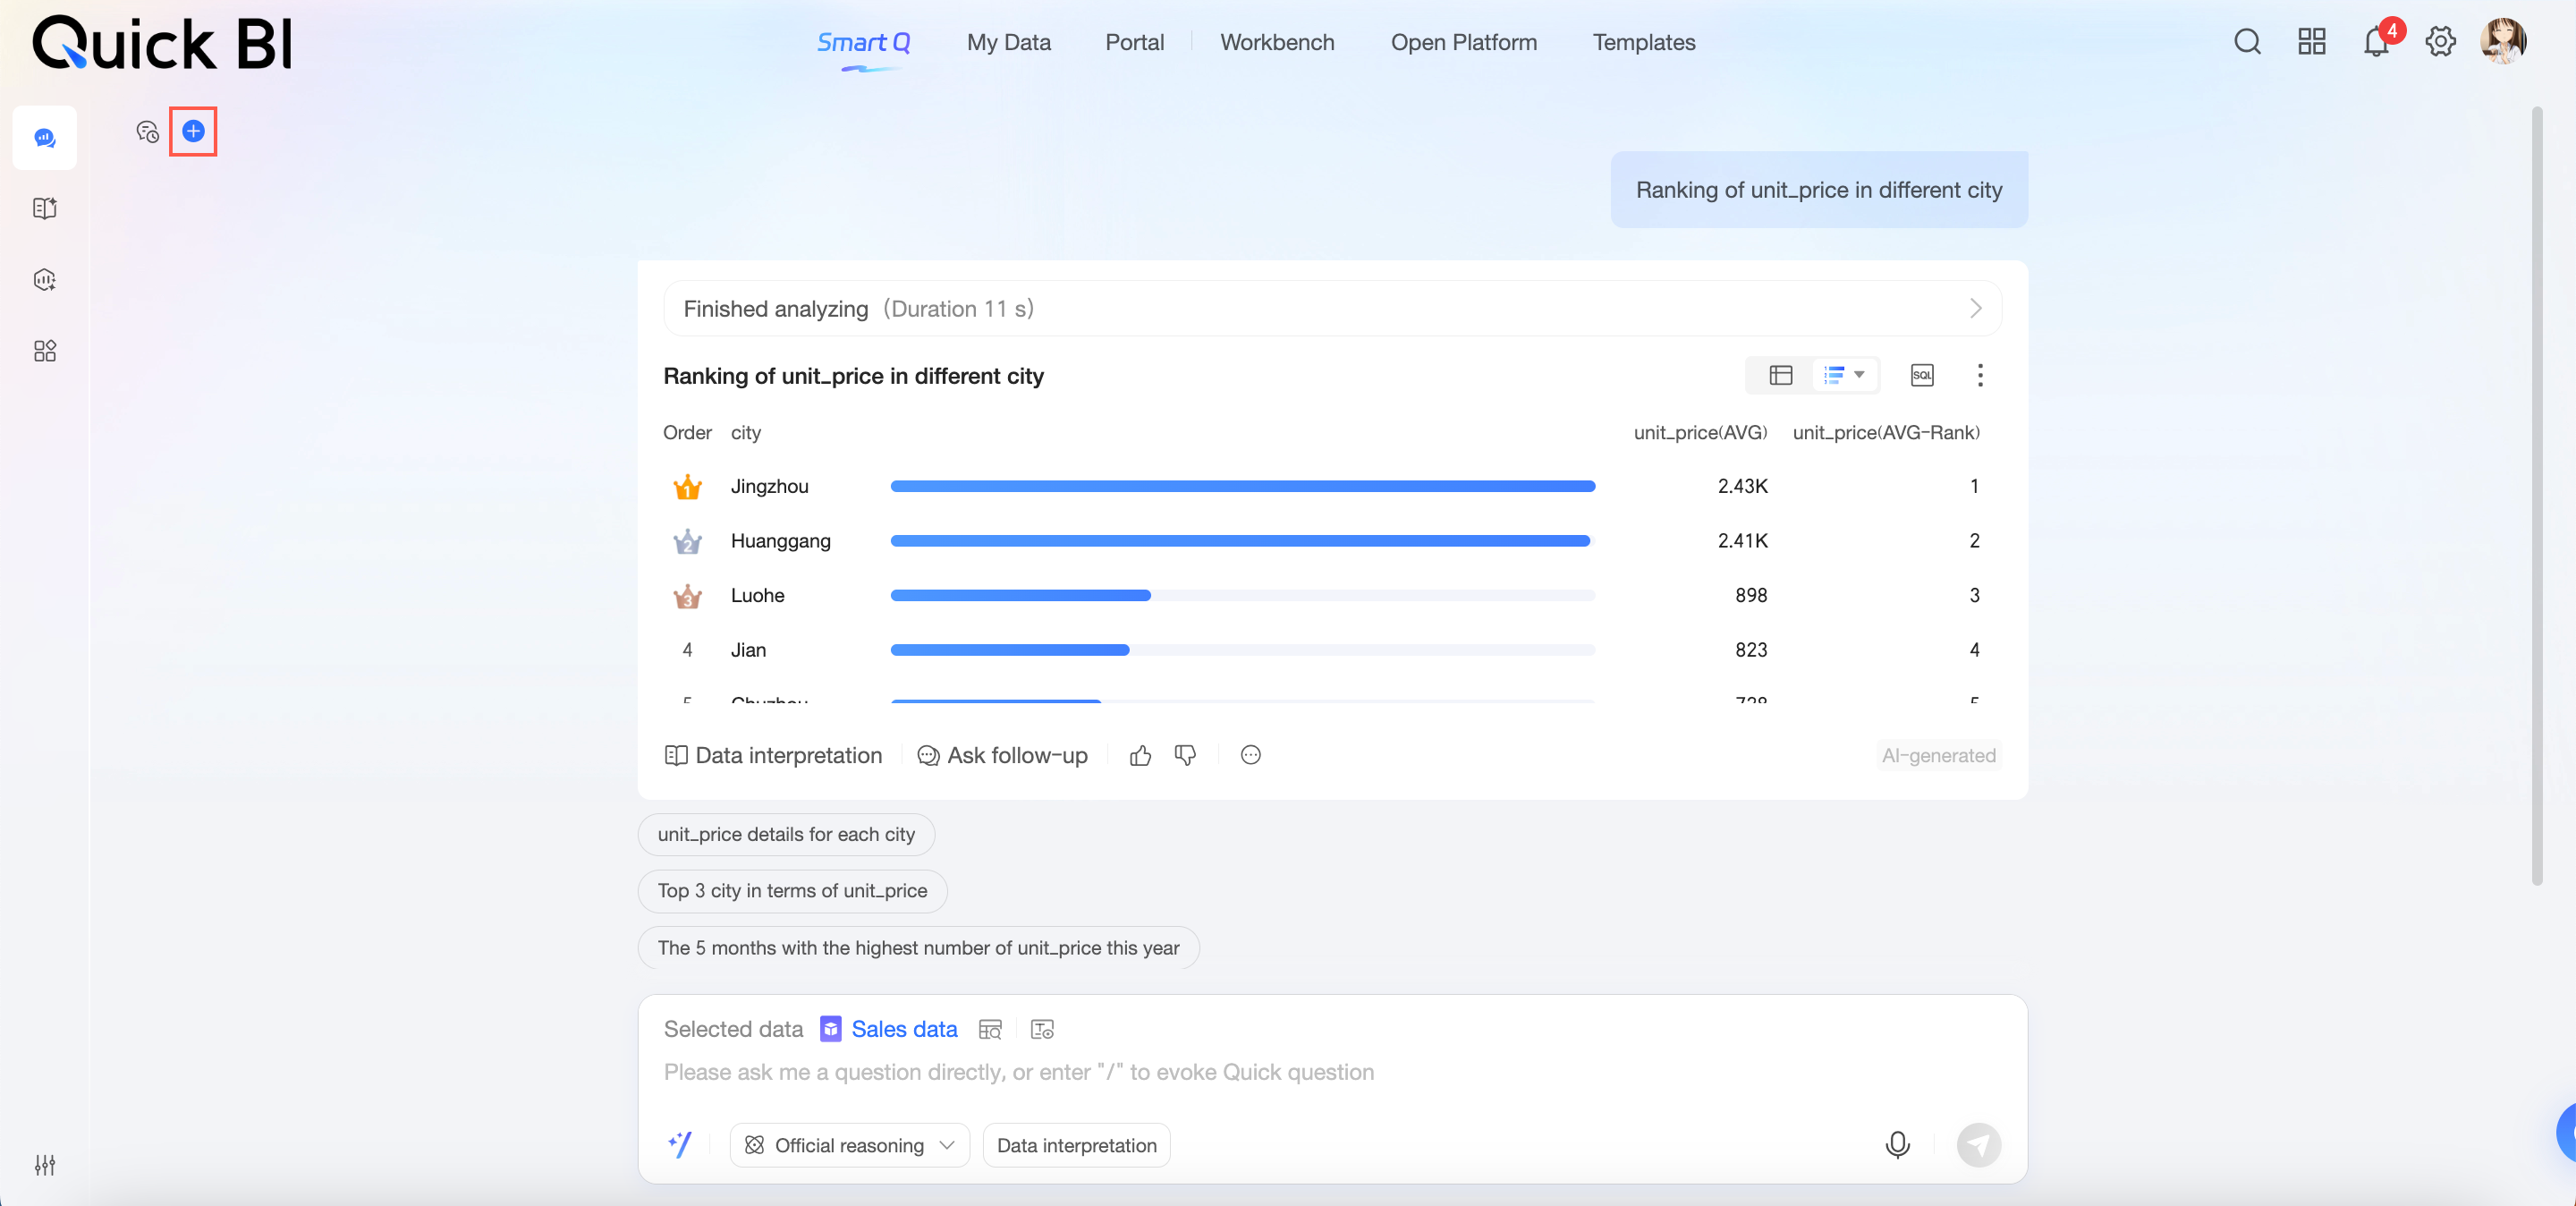
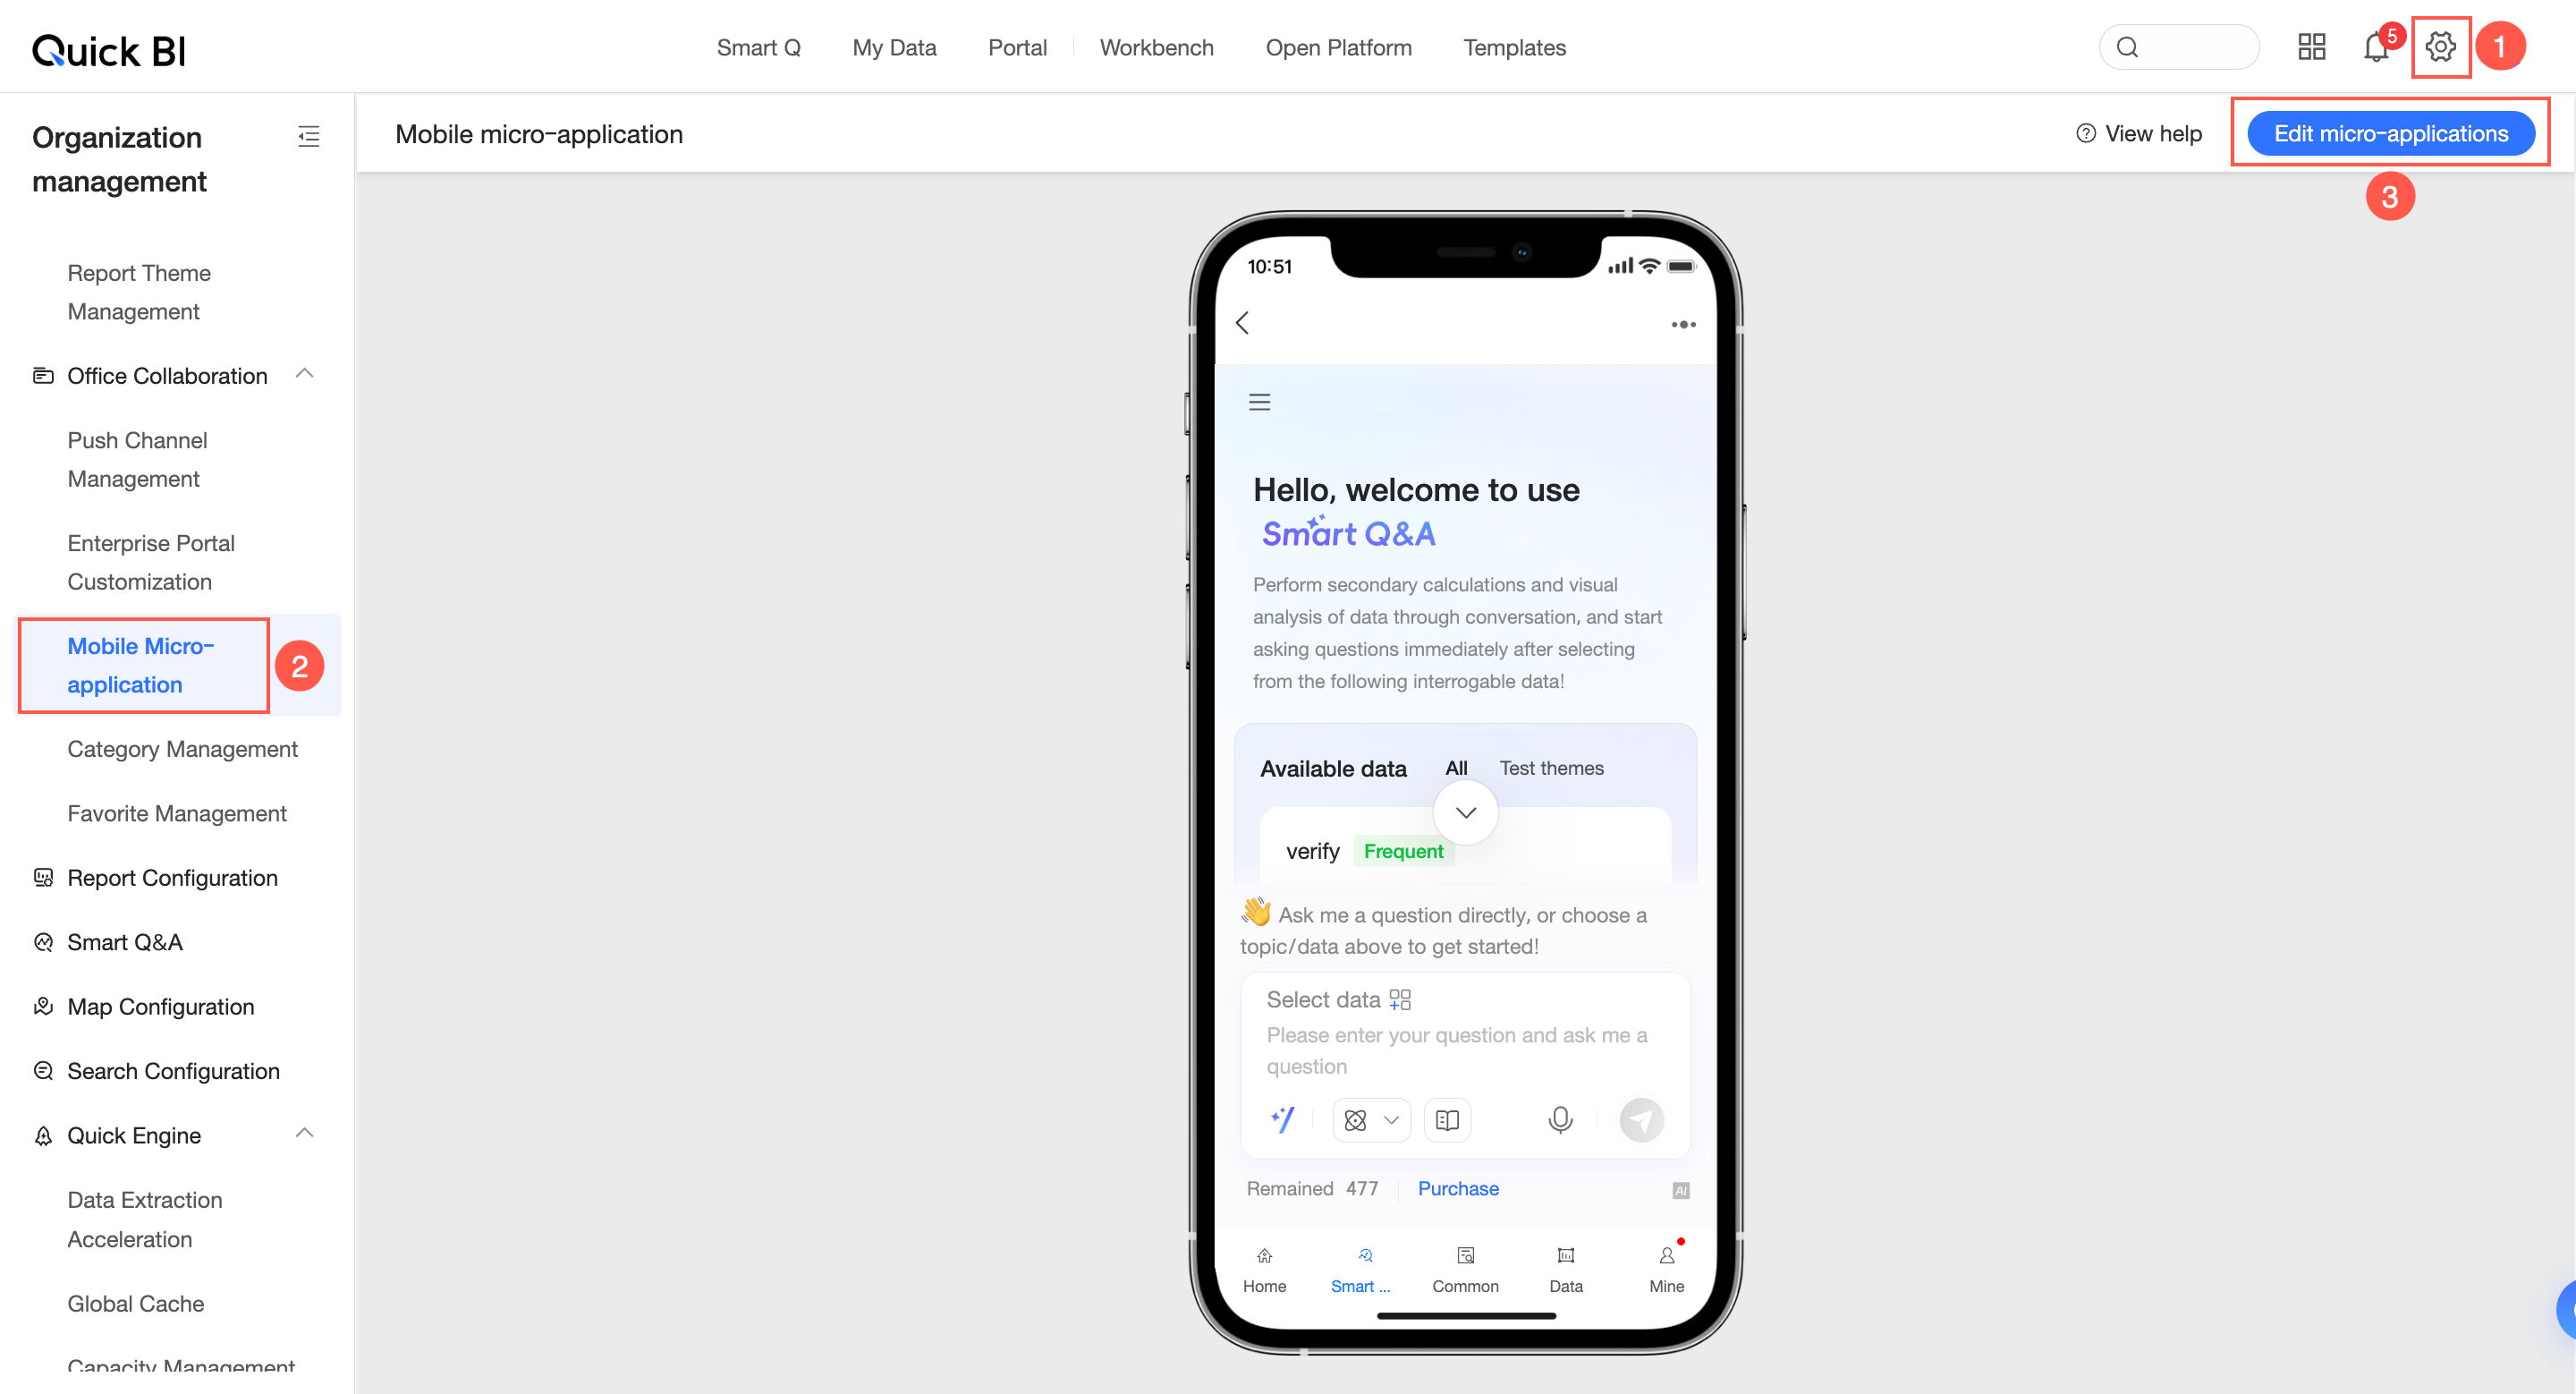
Mobile client display
Mobile micro-application configuration
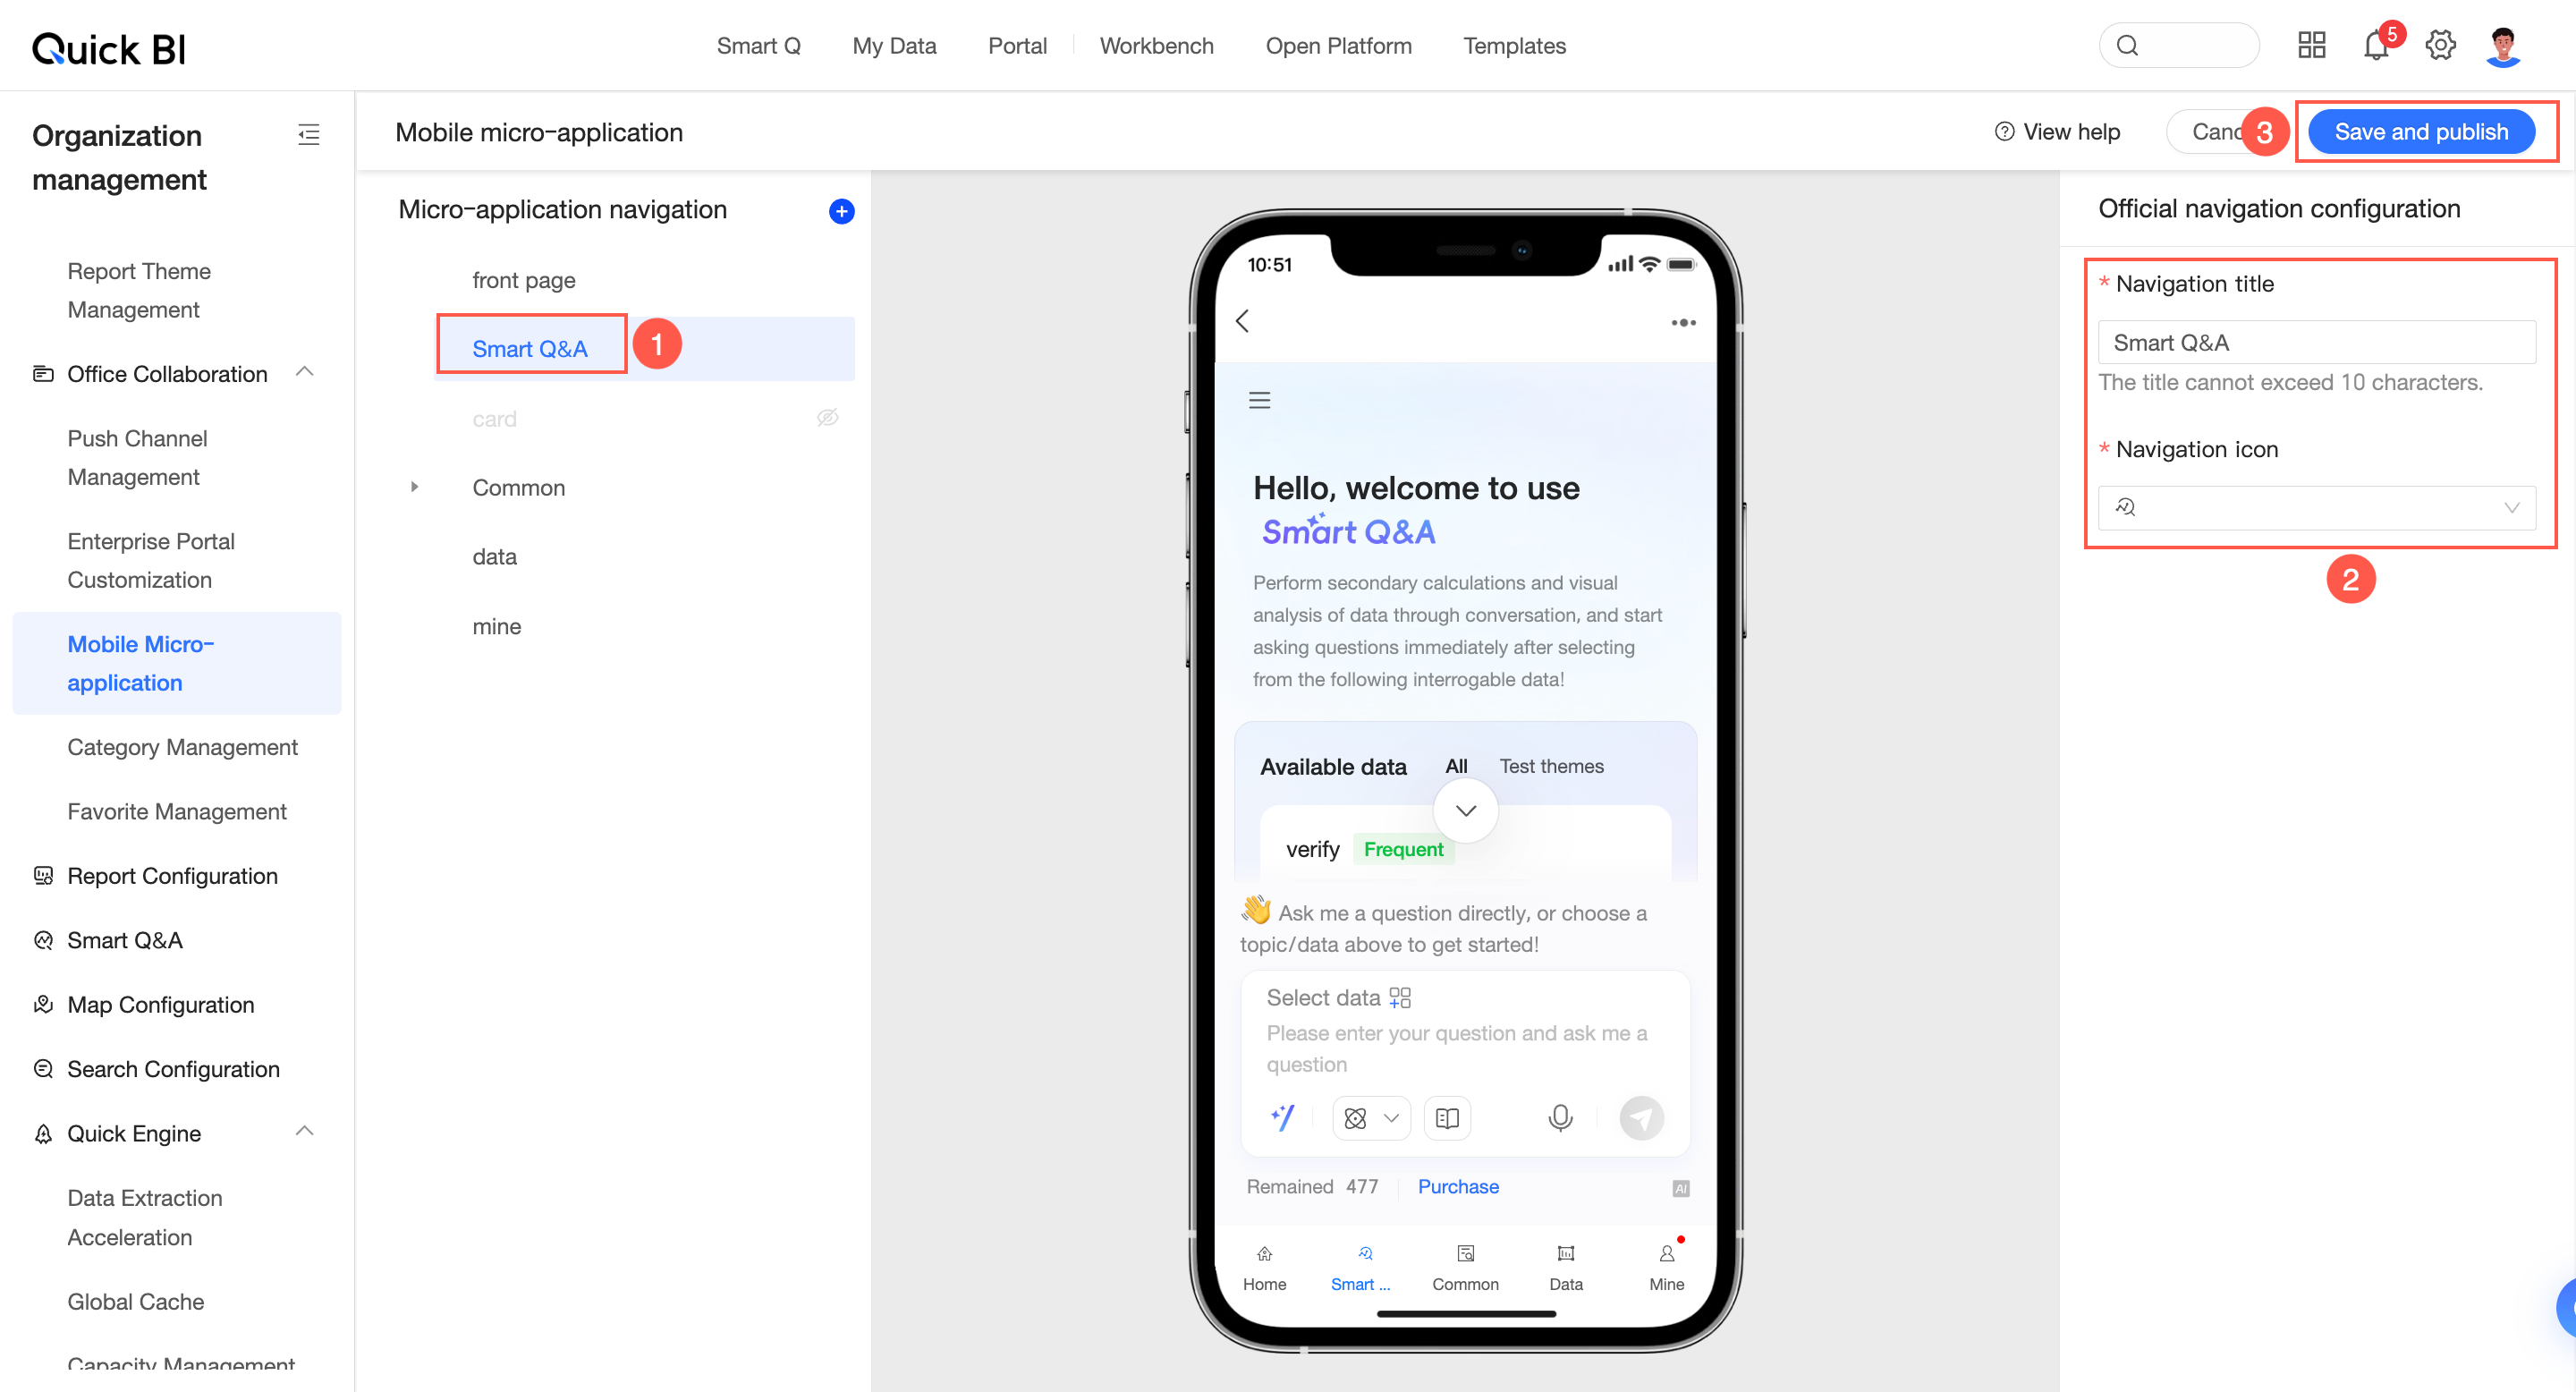
Follow the steps in the figure to enter the mobile editing interface.
In the editing interface, configure Q Chat for the mobile micro-application.
Best practices for asking questions
Add a time frame to your question for more precise results. For example:
Instead of asking "sales share of each product", ask "this year's sales share of each product".
To avoid ambiguity when querying multiple dimension values, use keywords such as "separately", "each", or "total" to distinguish between individual and aggregated results. For example:
A query like "sales in Zhejiang and Jiangsu" or "sales from 2020 to 2023" is ambiguous. Instead, specify your intent clearly: "sales in Zhejiang and Jiangsu separately", "sales for each year from 2020 to 2023", or "the total combined sales for Zhejiang and Jiangsu".
When asking for maximum or minimum values across multiple dimensions, be specific to avoid ambiguity between grouped and ungrouped results. For example:
Instead of asking "Which product sold best in Zhejiang and Jiangsu?", ask a more specific question like "What is the top-selling product in Zhejiang?" or "What is the top-selling product in each province?"
Instead of asking "What were the best 3 sales months last year in Zhejiang and Jiangsu?", ask "What were the best 3 sales months in Zhejiang last year?" or "What were the top 3 order months by sales for each province?"
If a dimension value is ambiguous, specify the dimension explicitly in your question. For example:
A question like "Rank products purchased by corporate customers by sales" can be ambiguous. The term "corporate" might be interpreted in other ways. Be more specific: "For customer type 'corporate', rank purchased products by sales."