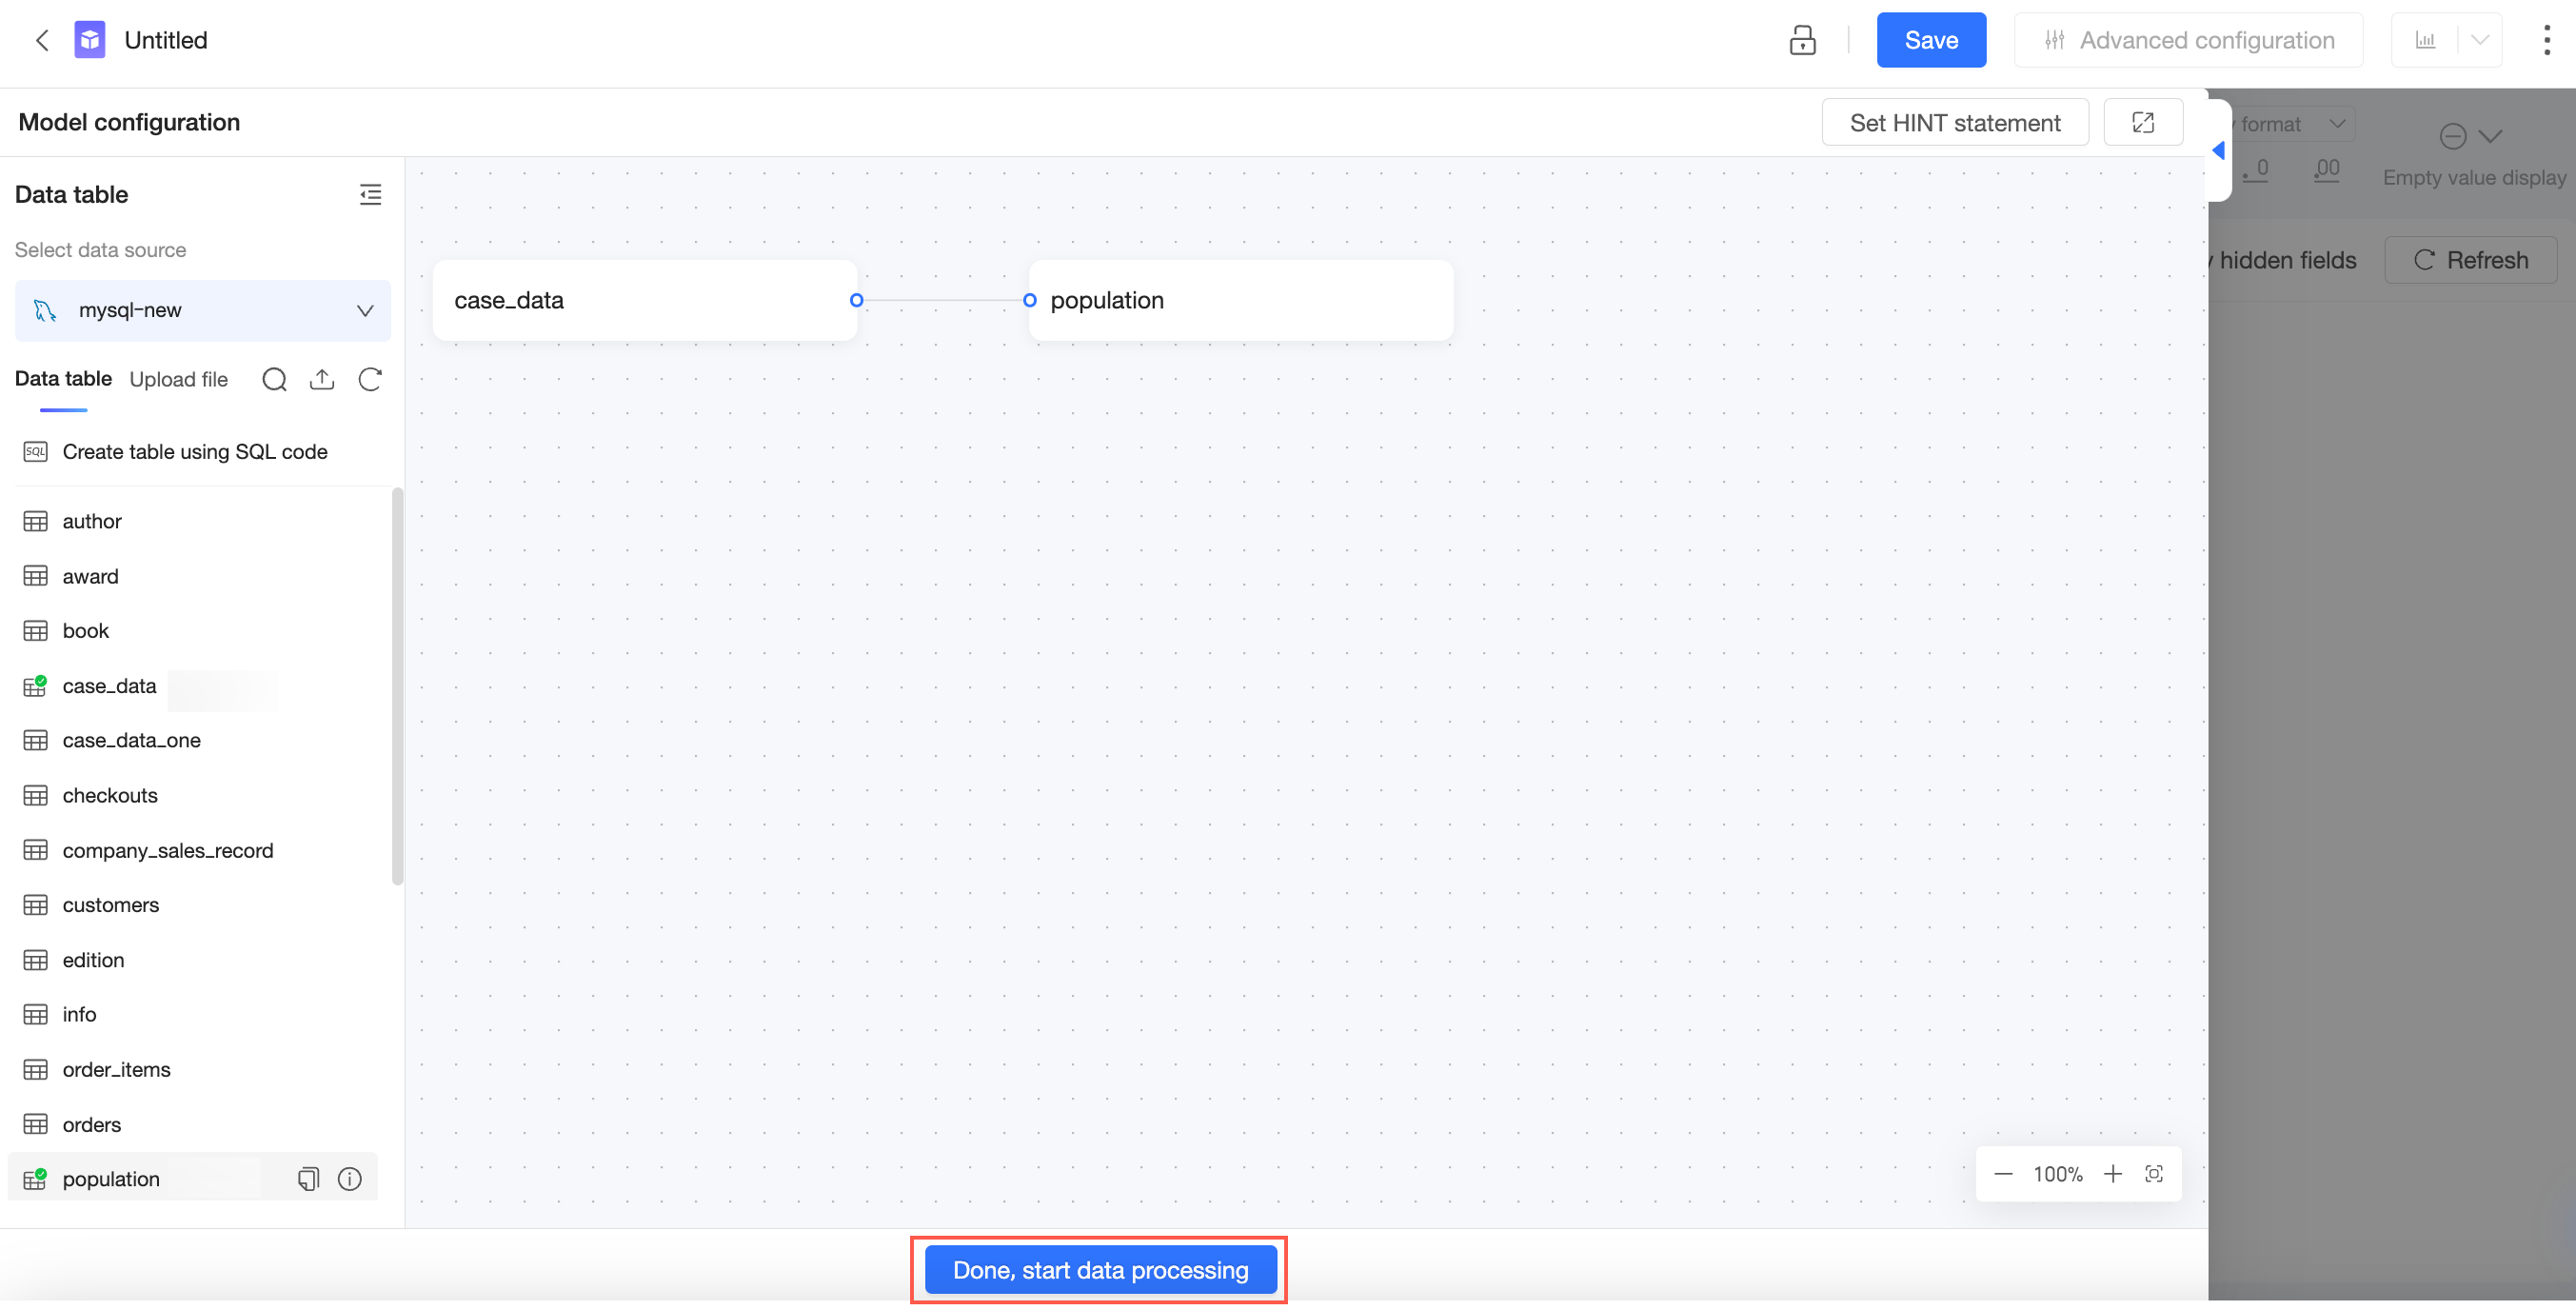
When you need to analyze data across multiple tables, use data modeling to join them into a unified model for reporting and analysis.
Prerequisites
You have created a dataset. For more information, see Create a dataset.
Create a relational model
Quick BI supports two modeling approaches. Choose based on your analysis needs:
|
Relational model |
Physical model |
|
|
What it does |
Defines how tables relate using a logical layer, without merging the underlying data |
Merges tables into a single physical table using SQL joins or unions |
|
Use when |
Analyzing data at different levels of detail, or when tables have many-to-many relationships |
Applying specific join logic (LEFT, RIGHT, INNER, FULL JOIN) or combining rows with UNION |
|
Data duplication risk |
Low — tables stay independent |
Higher — merging can introduce duplicate rows or NULL values |
|
Query behavior |
Quick BI builds the appropriate query dynamically at analysis time |
Join logic is fixed at model-creation time |
In most multidimensional analysis scenarios, start with the relational model. Use the physical model when reporting requires a specific join type or a unioned result set.
The relational model is a logical layer on top of your tables. Instead of merging the data upfront, it defines how the tables relate to each other and builds the appropriate query at analysis time — avoiding the data duplication and NULL-row issues that direct joins can introduce.
Follow these steps:
-
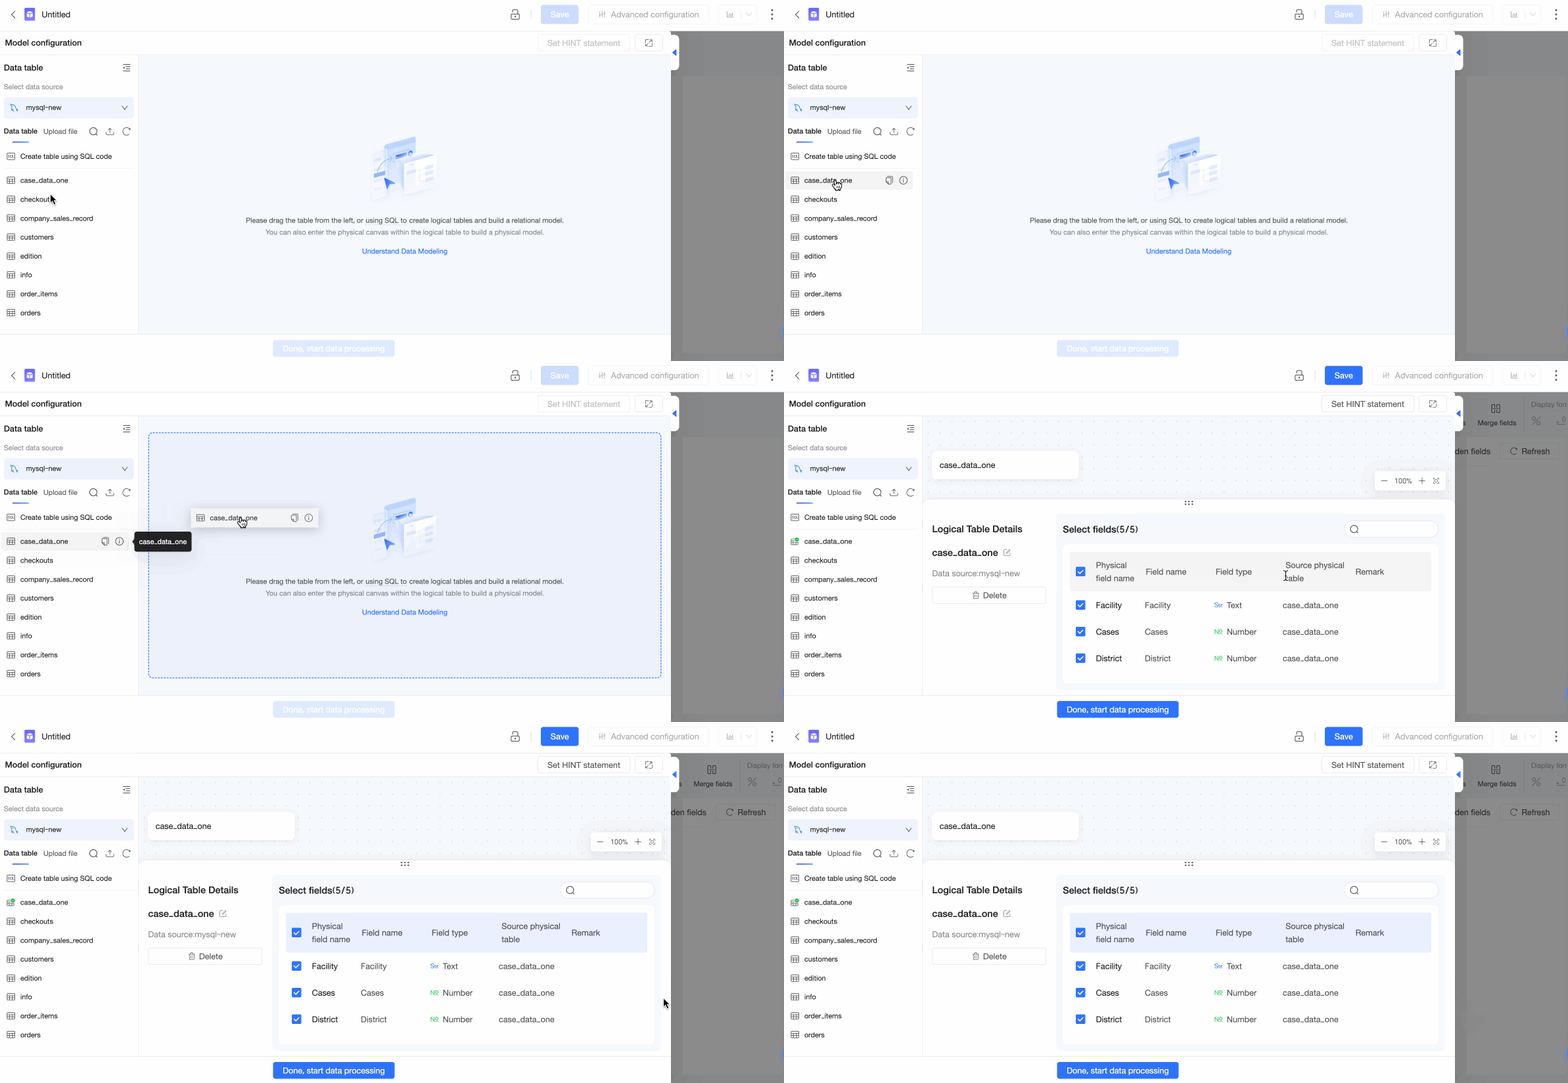
On the dataset creation page, double-click or drag a table onto the canvas. Alternatively, use custom SQL to create a table.
-
Drag another table onto the canvas and configure the logical relationship. For detailed instructions, see Relational model operations.
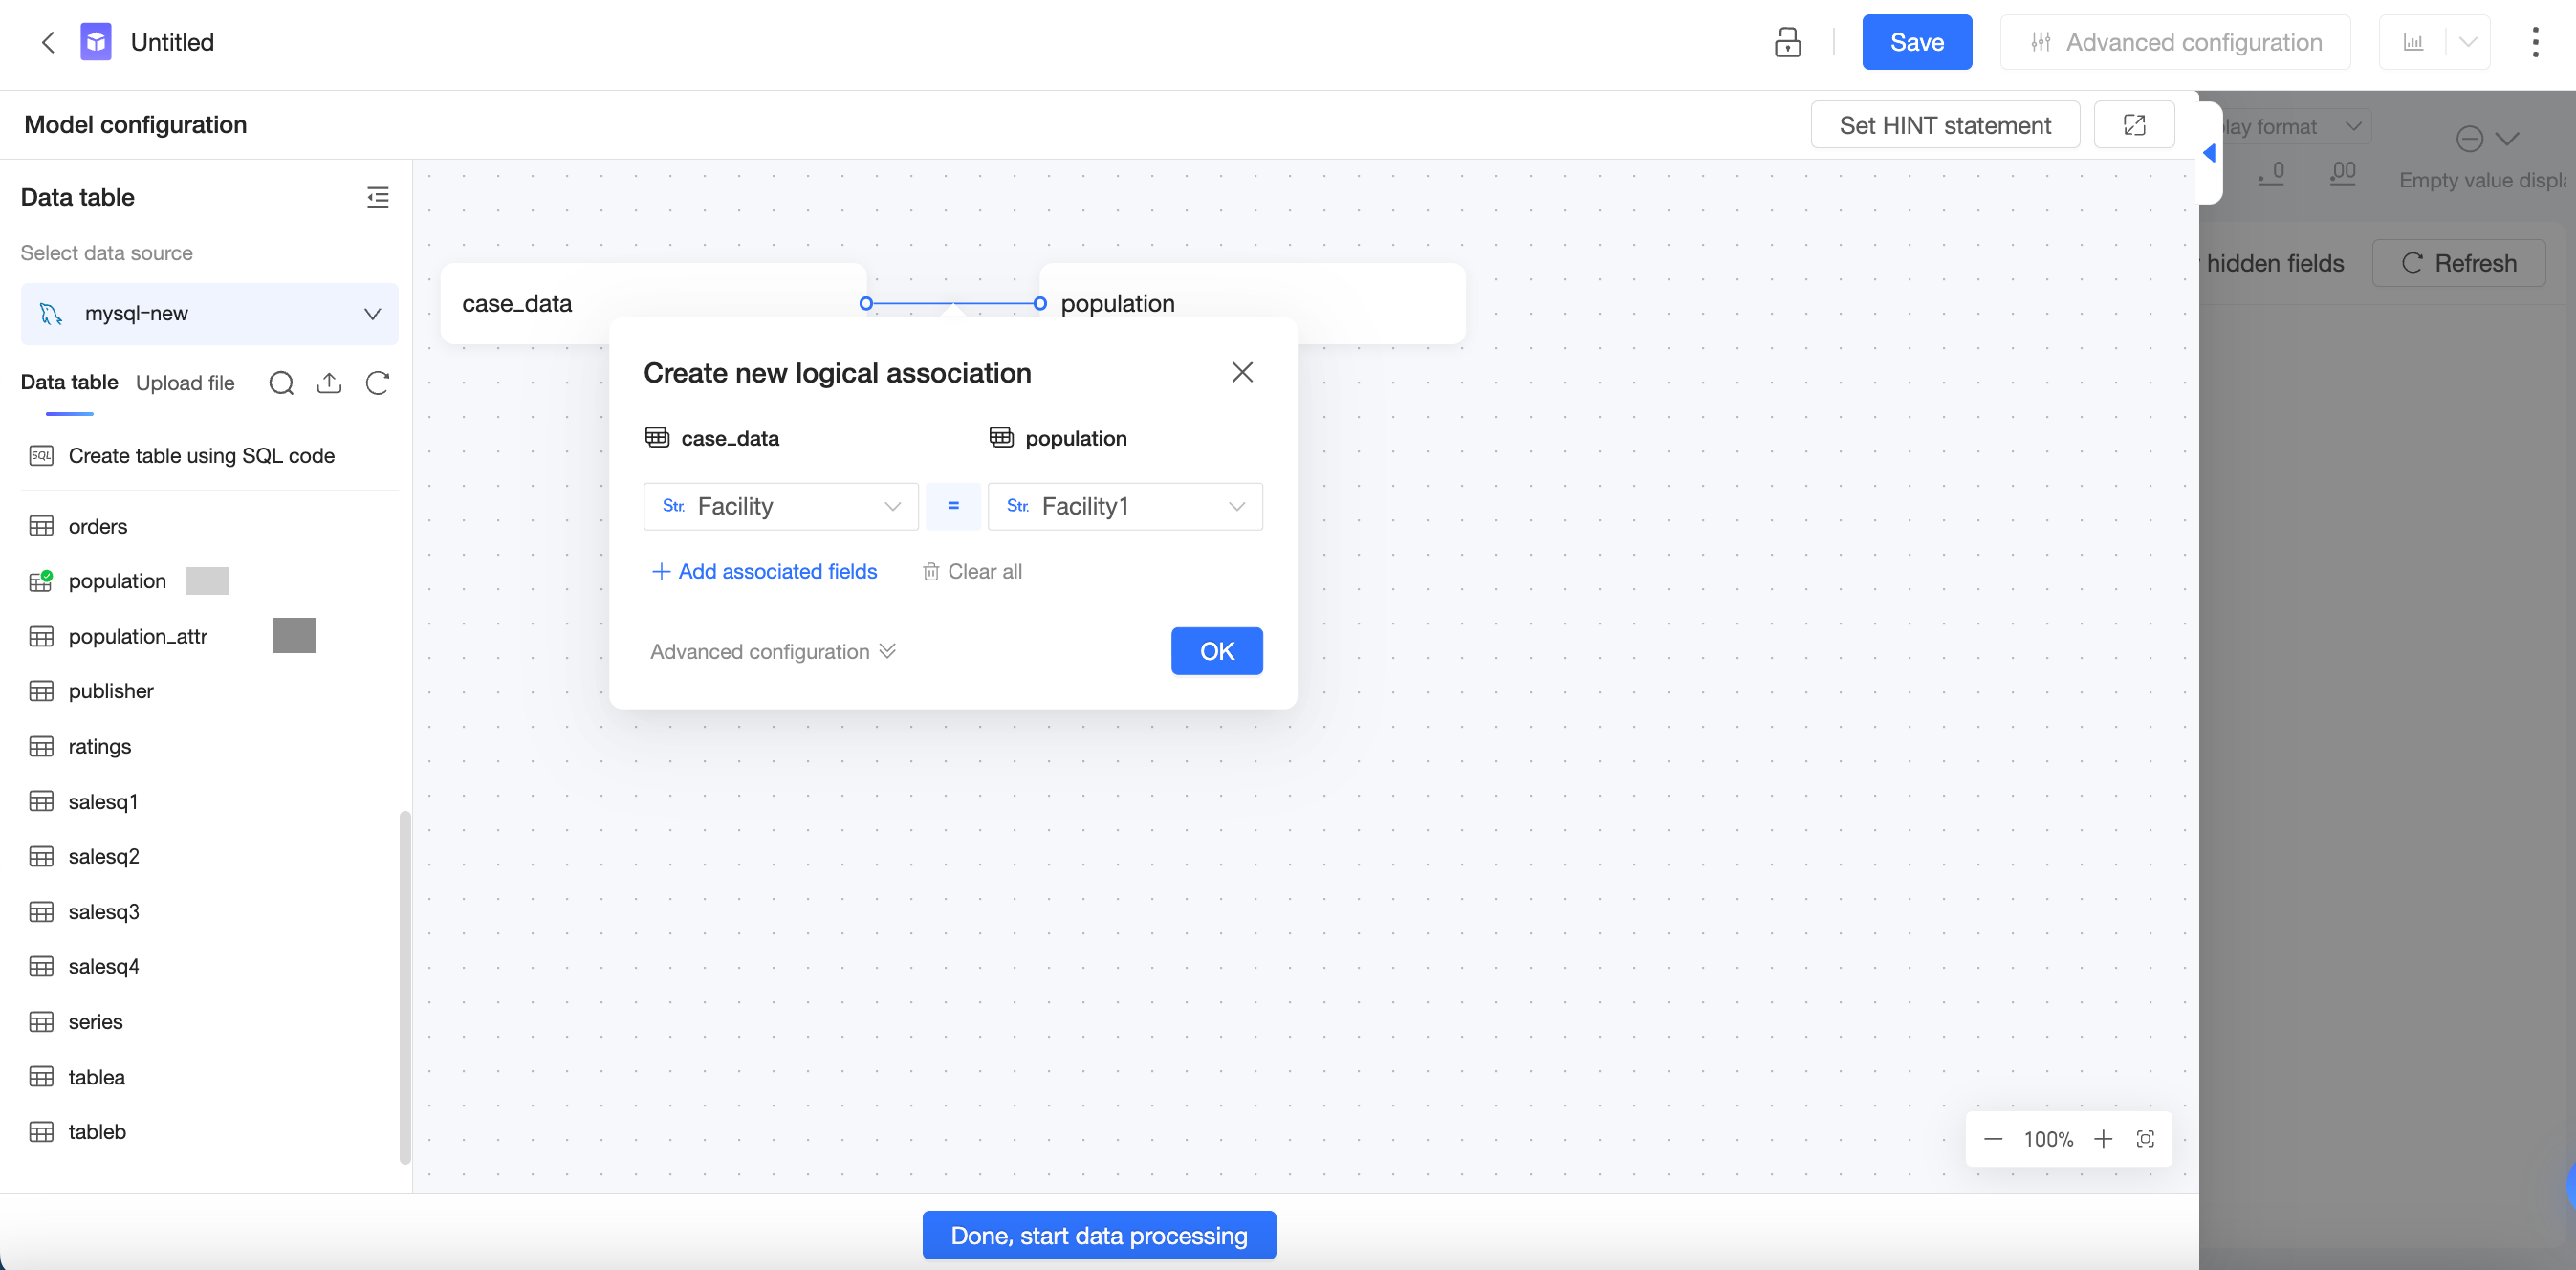
Click OK to create the relationship.
Repeat these steps to join additional logical tables.
Create a physical model
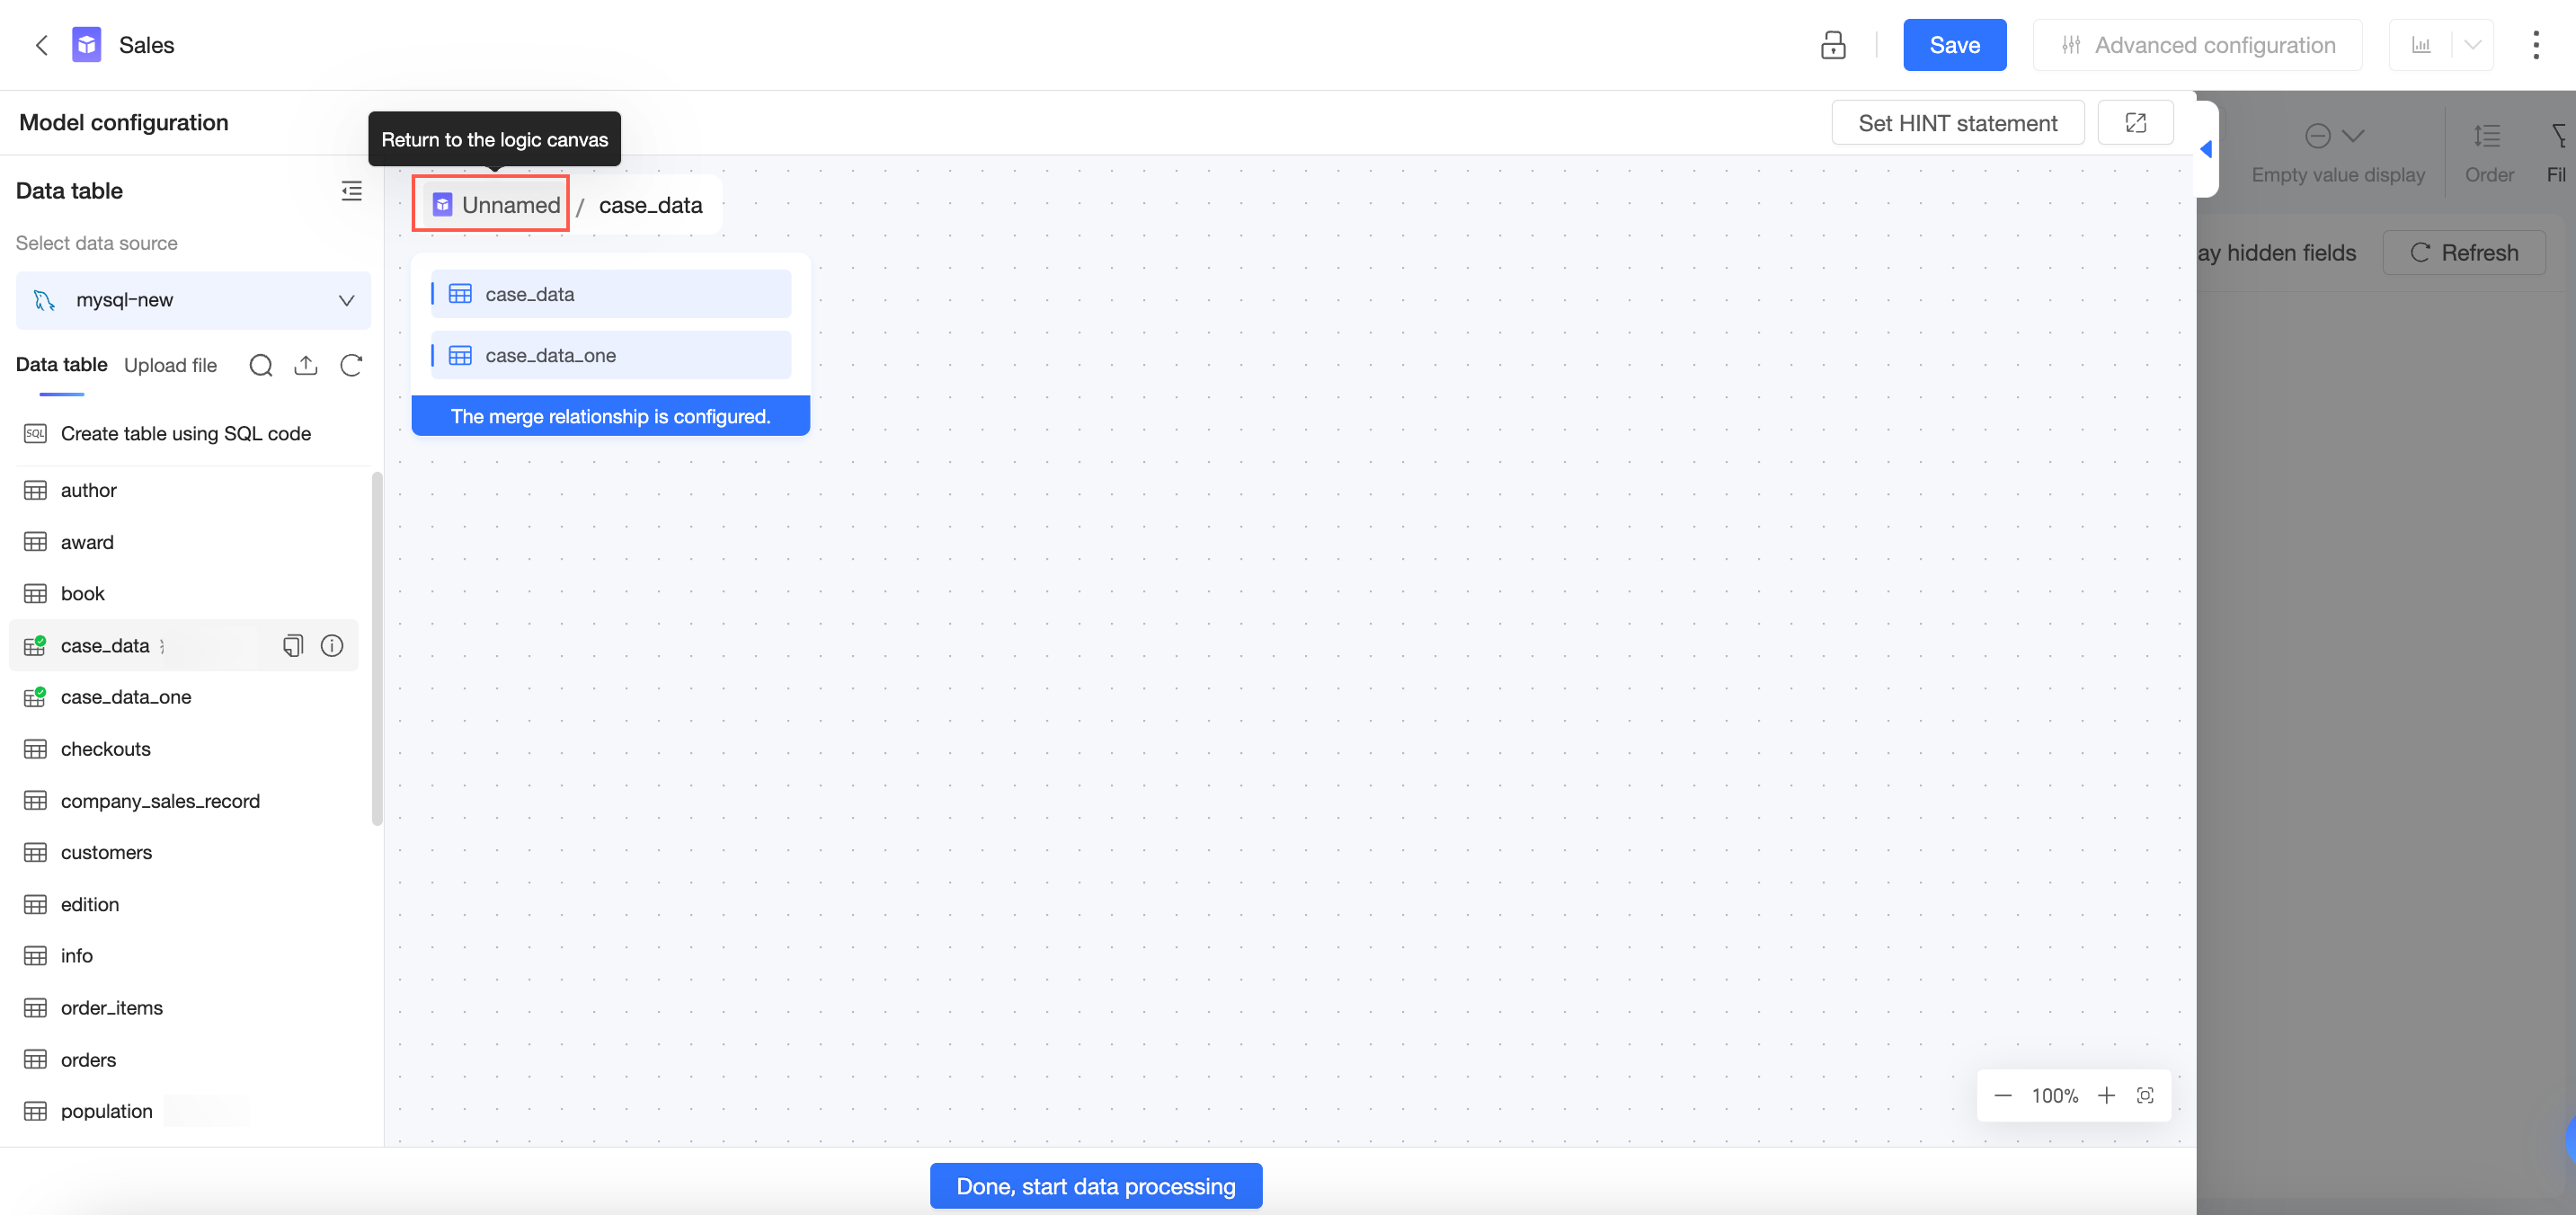
The physical model sits inside the relational model. Each logical table on the relational canvas has its own physical canvas, where you configure the actual join or union logic. To open the physical canvas, click the  icon on the right side of the logical table and select Go to Physical Canvas, or double-click the logical table. Do not drag a second table directly onto the relational canvas.
Follow these steps:
-
Click the
icon on the right side of the logical table and select Go to Physical Canvas, or double-click the logical table to open the physical canvas.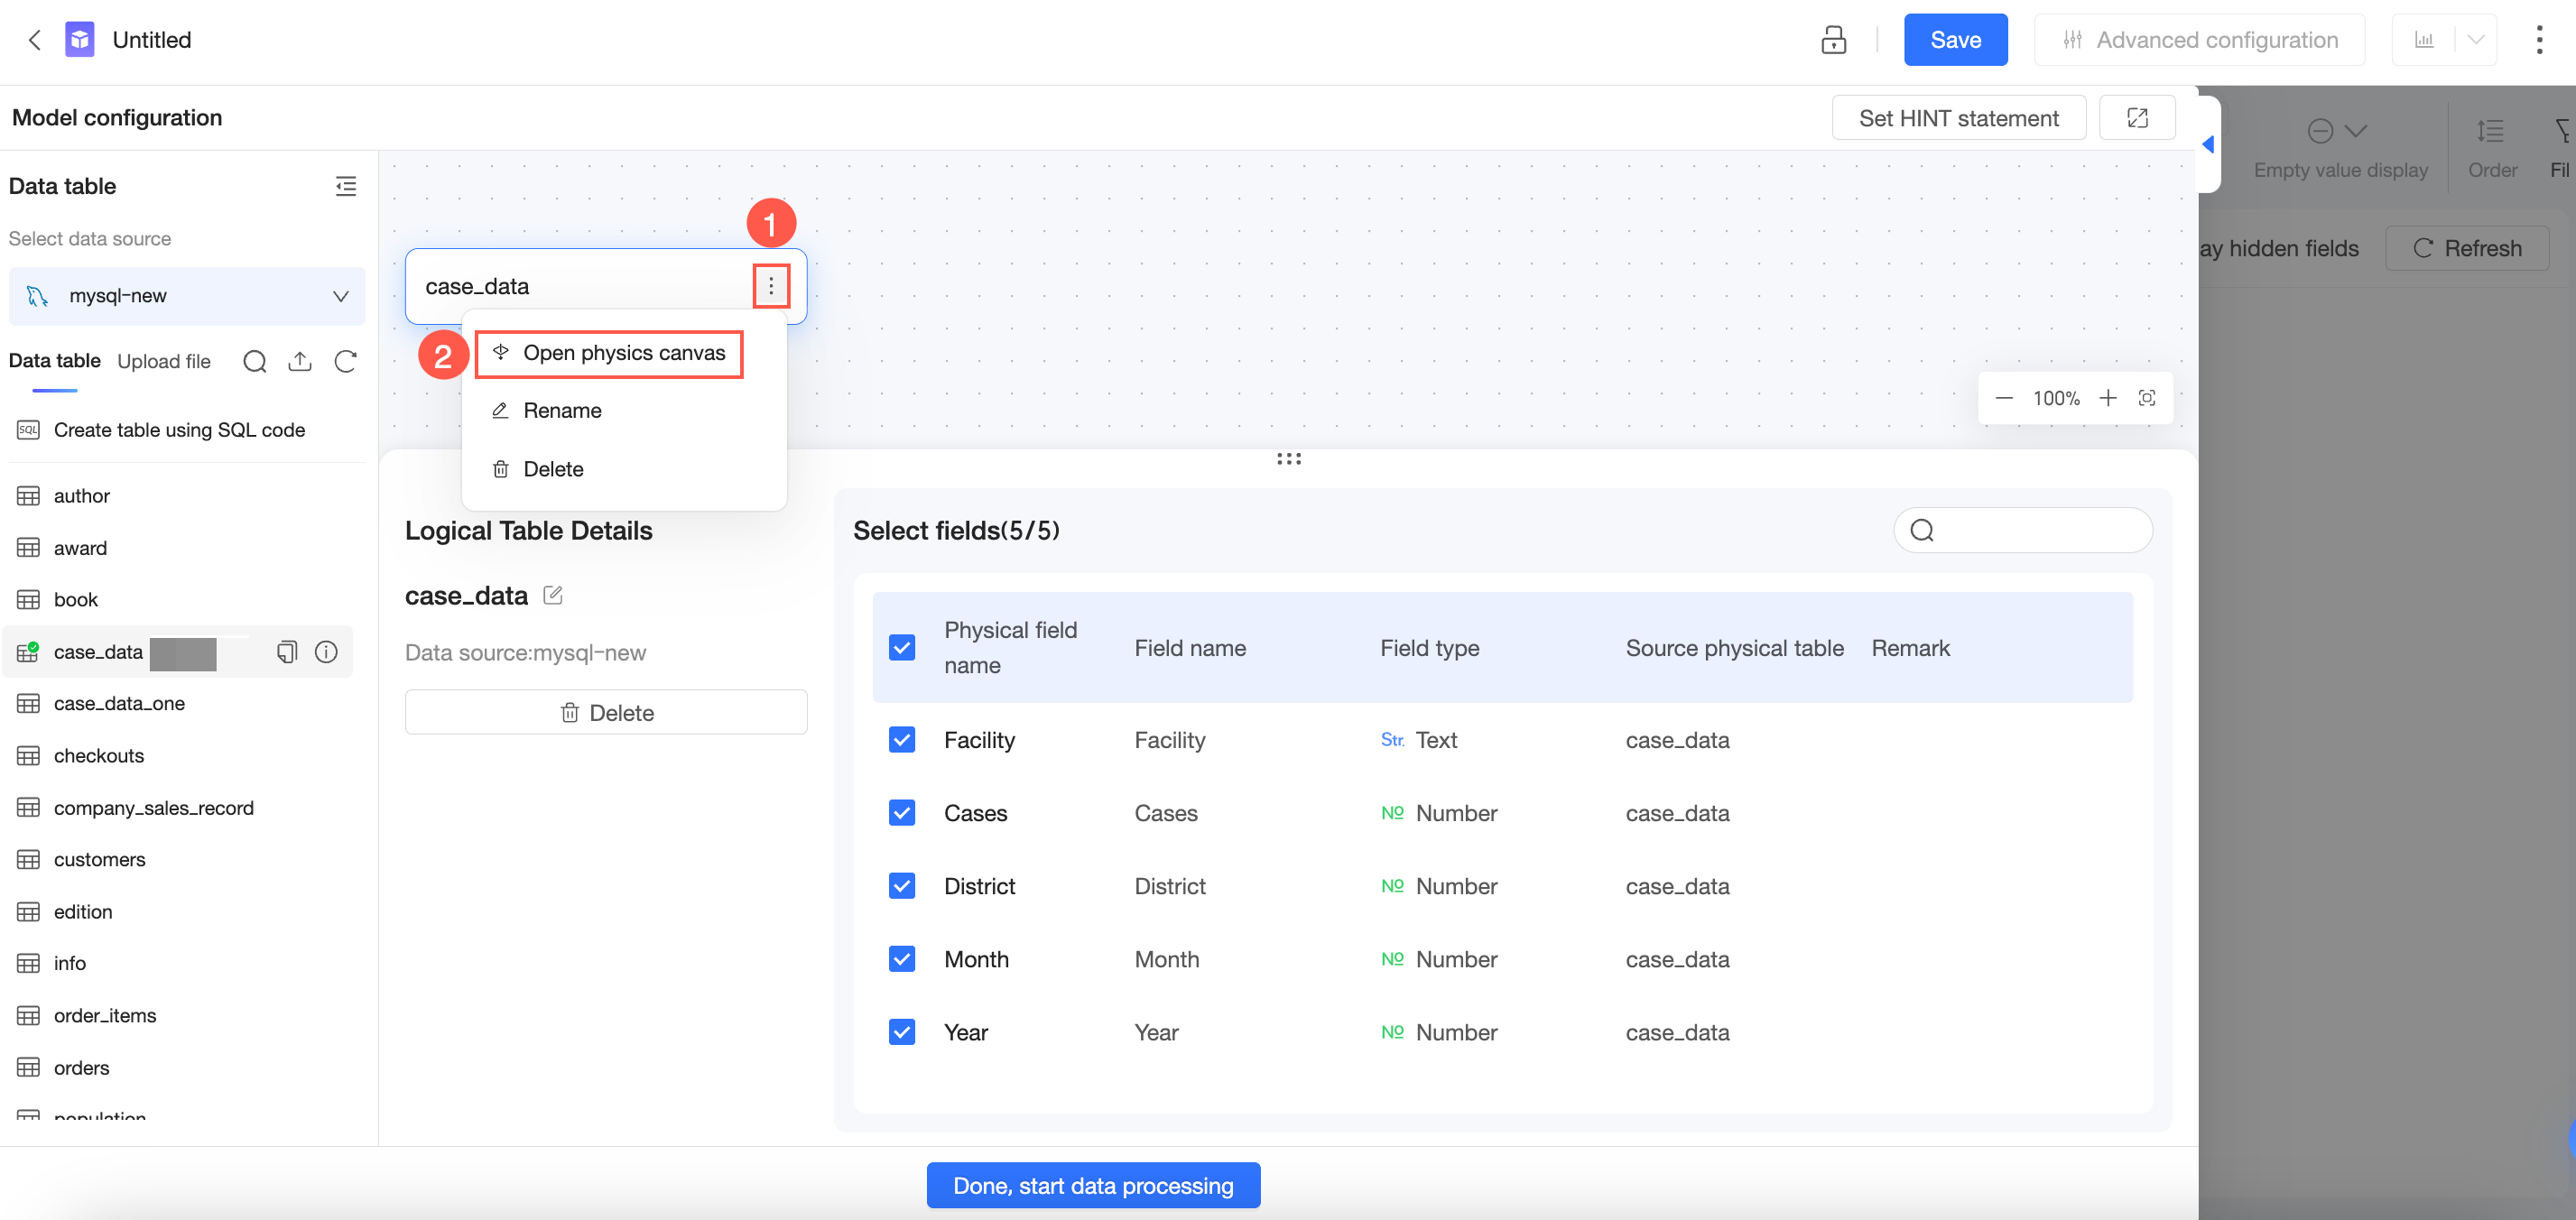
-
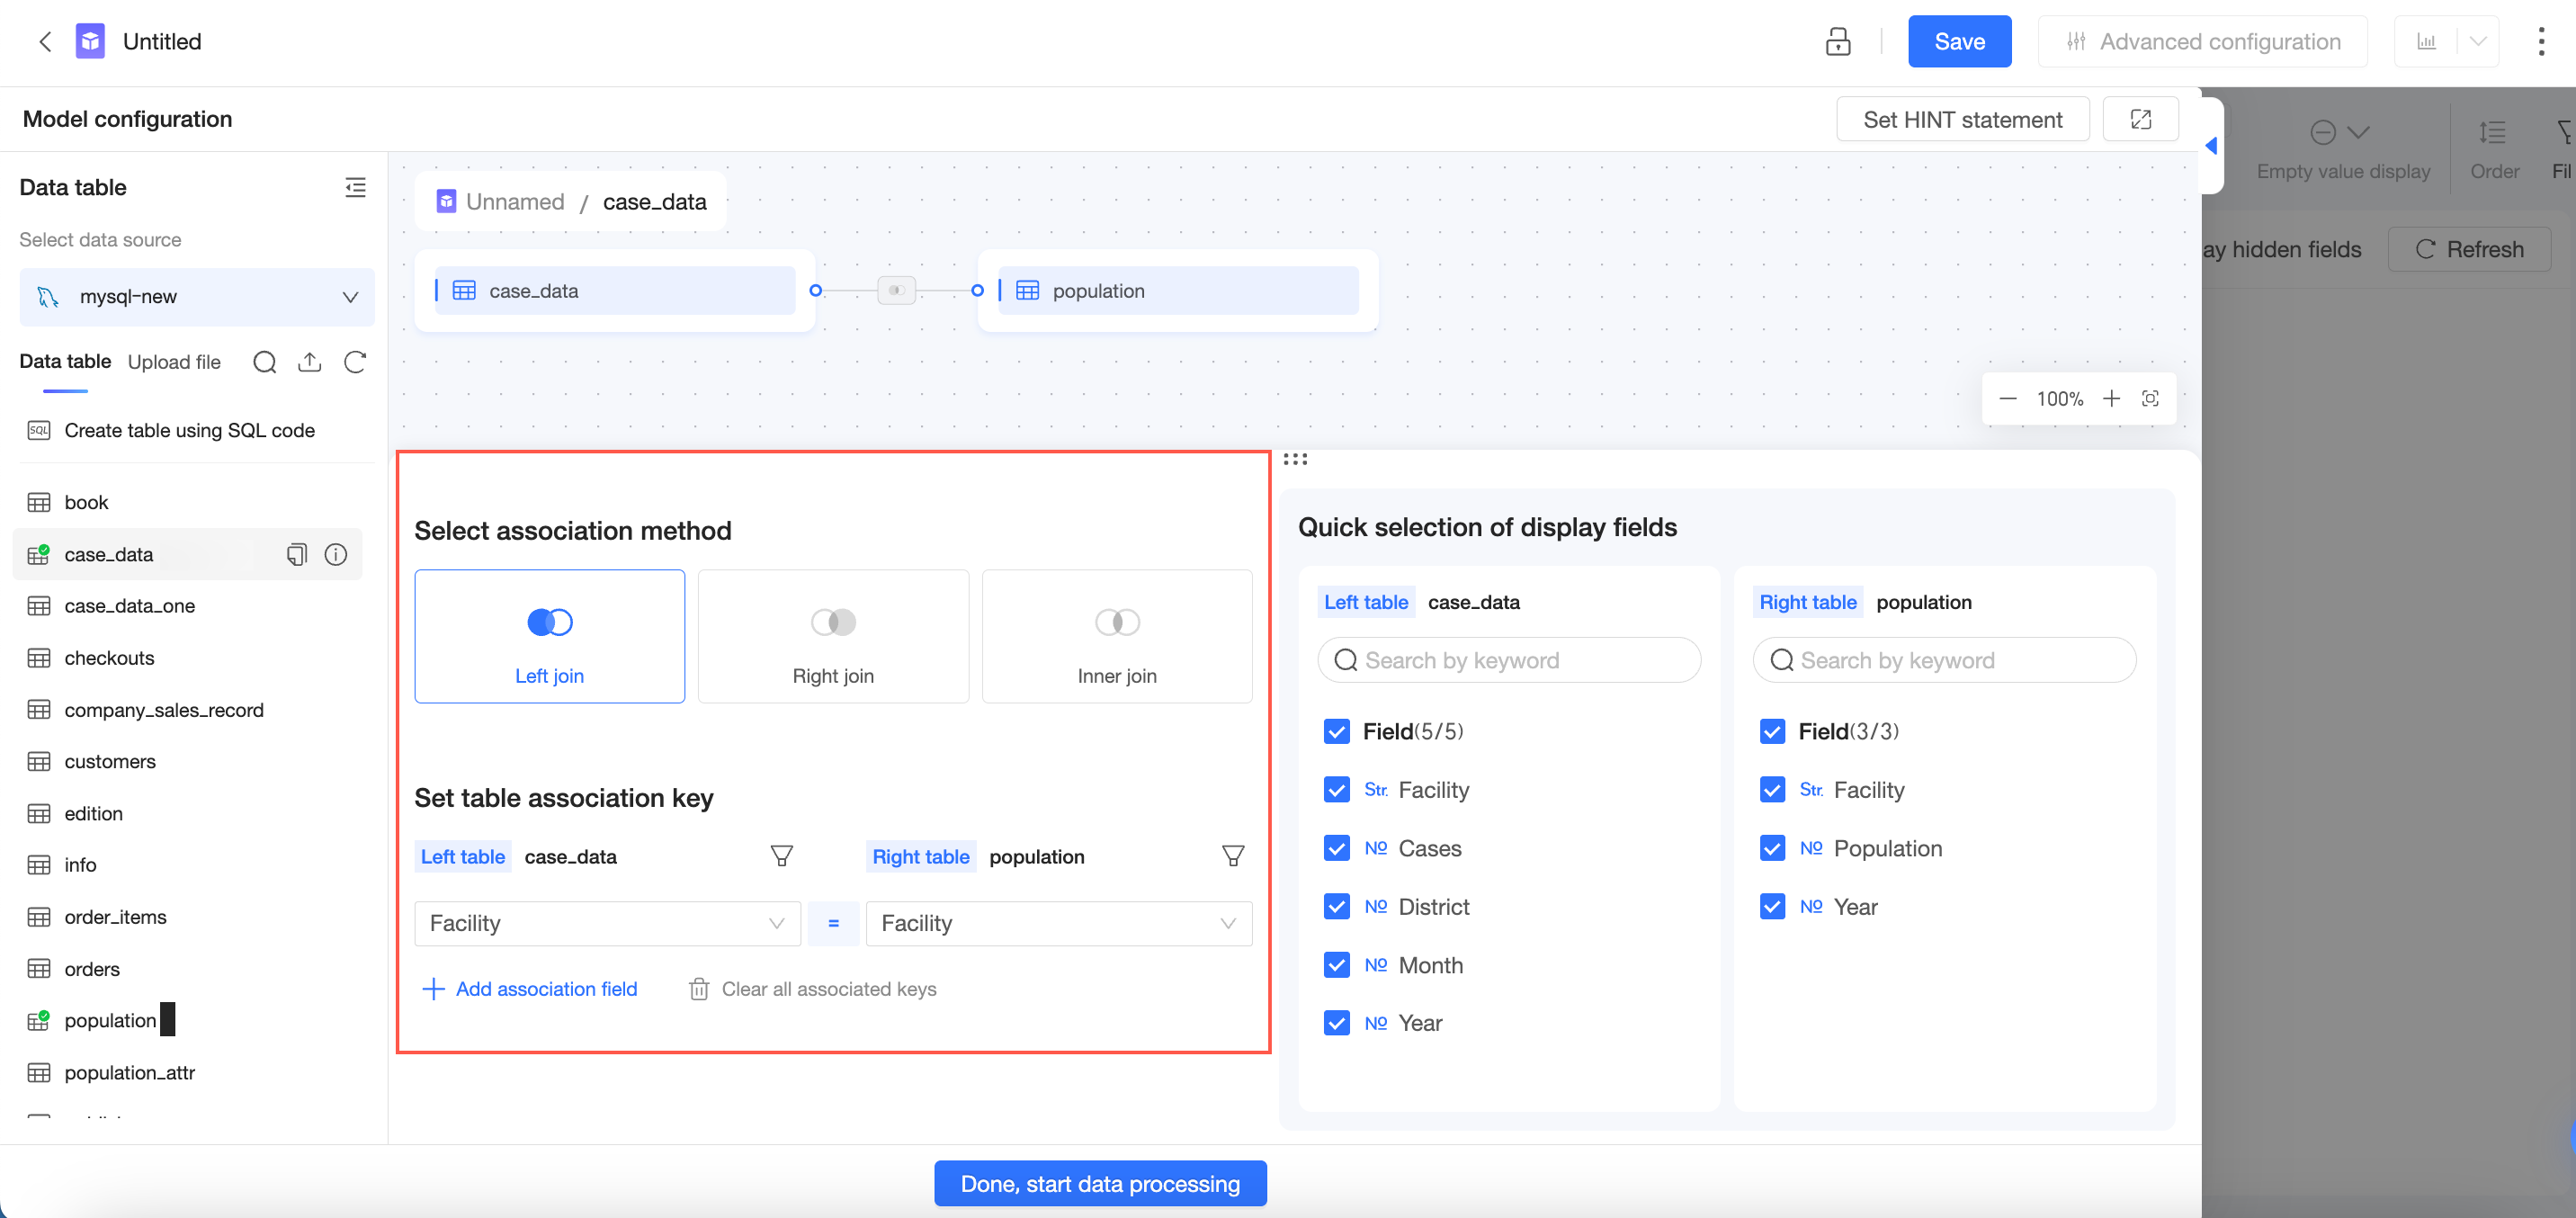
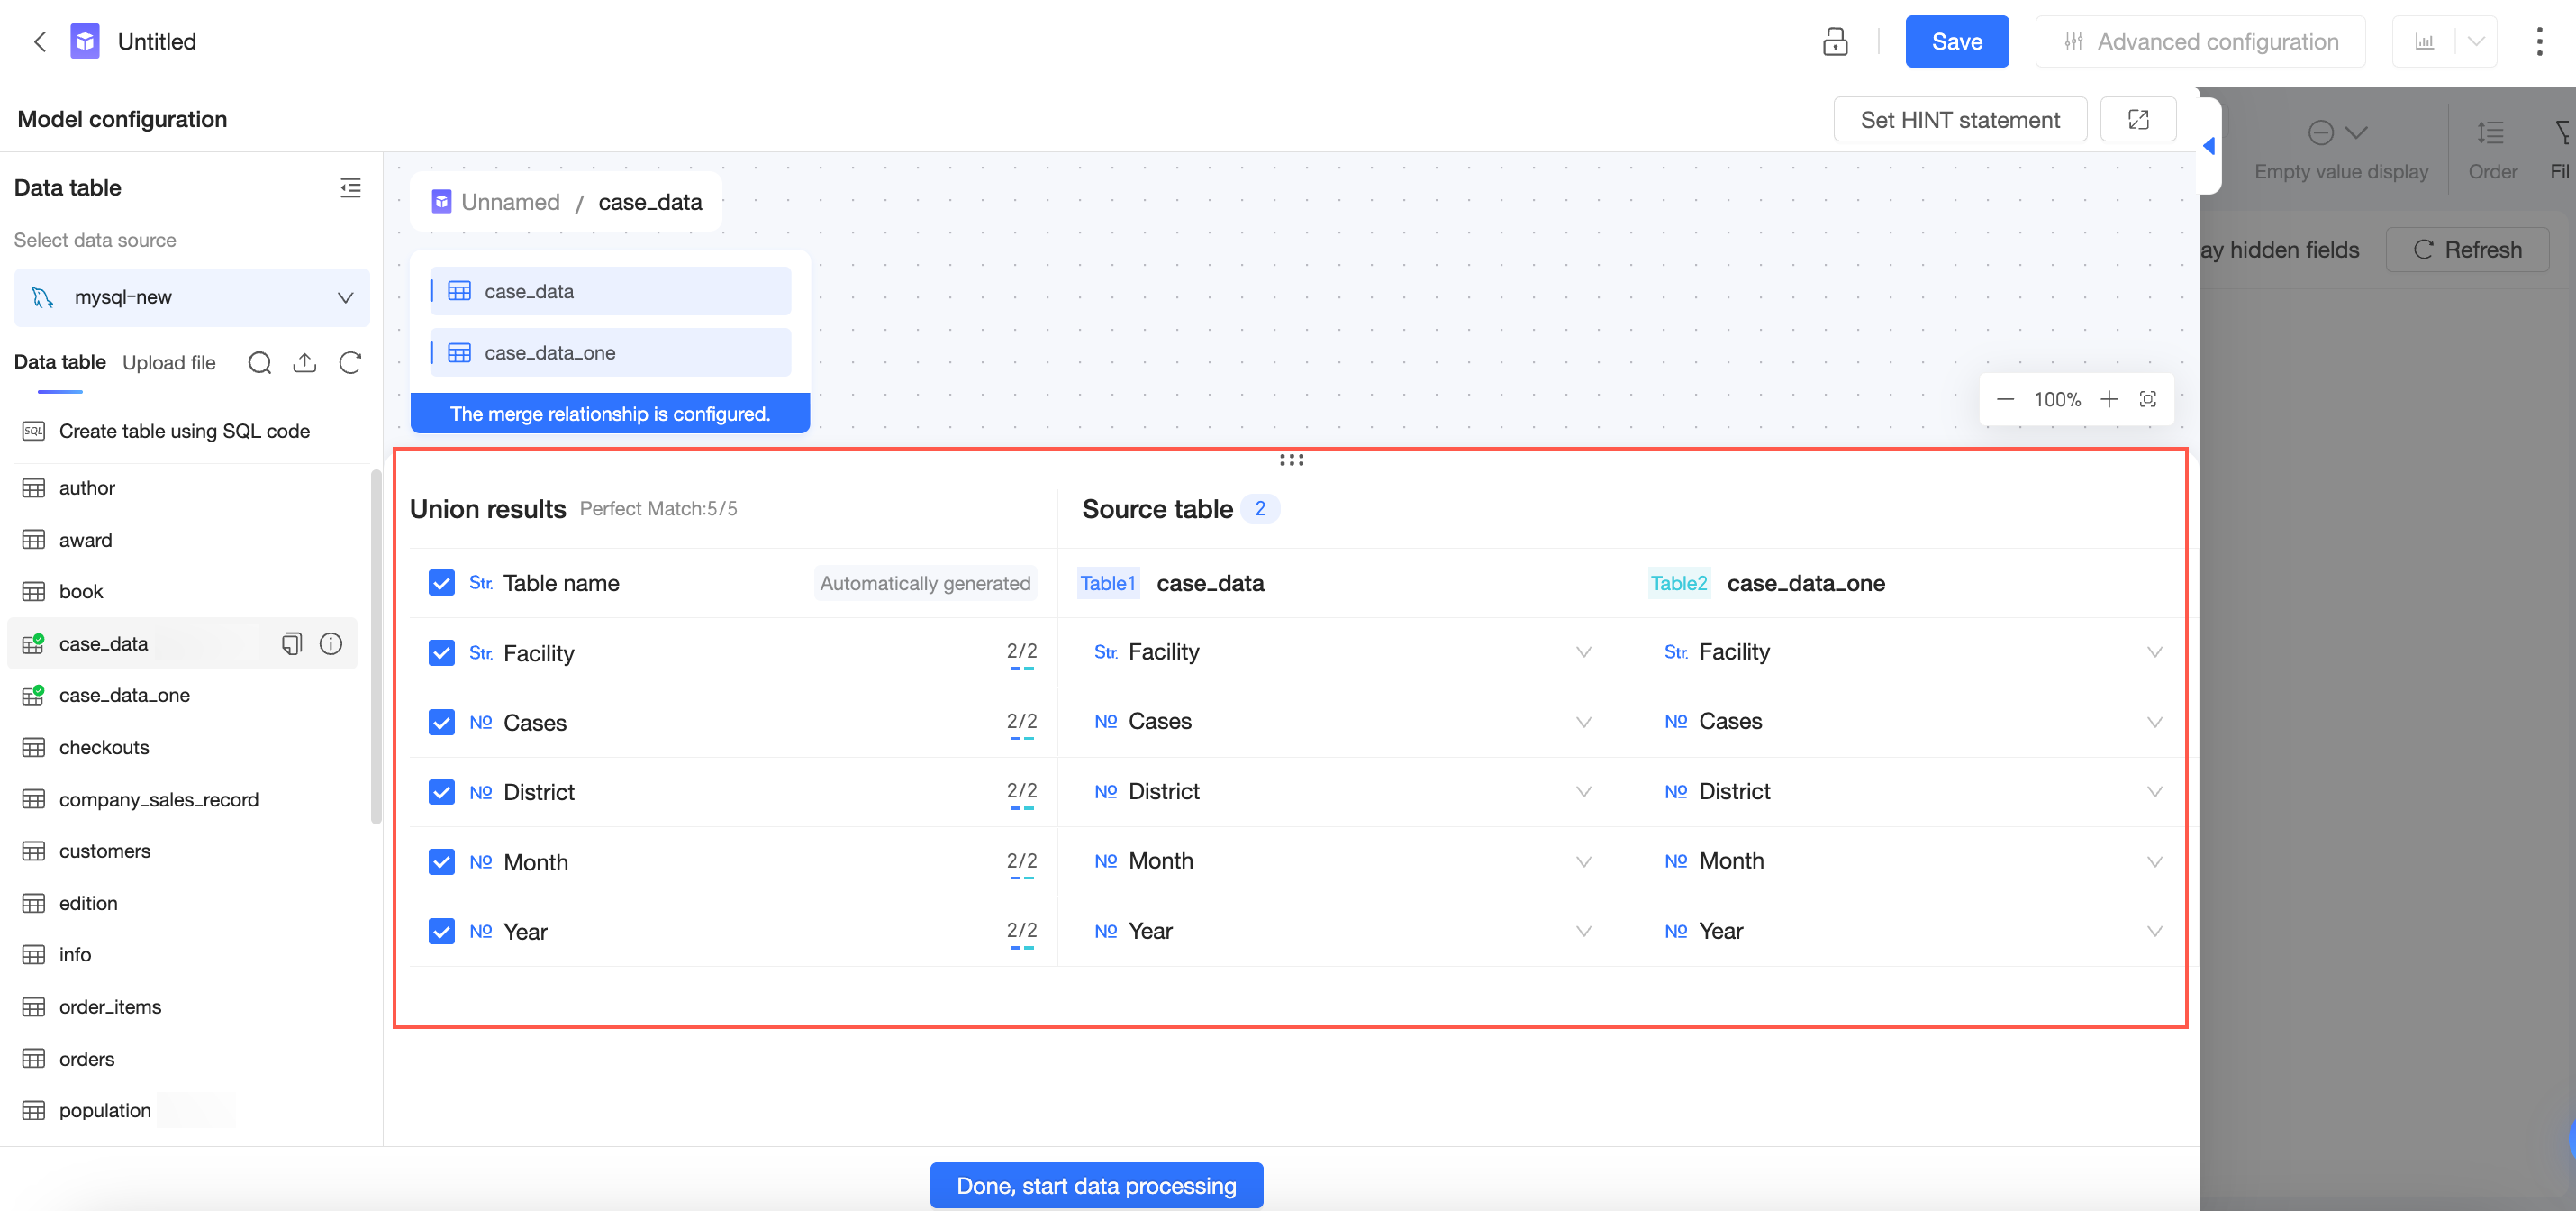
Drag a second table onto the canvas, then join or union the tables.
-
To return to the relational model canvas, click the dataset name.
Additional modeling capabilities
Placeholder
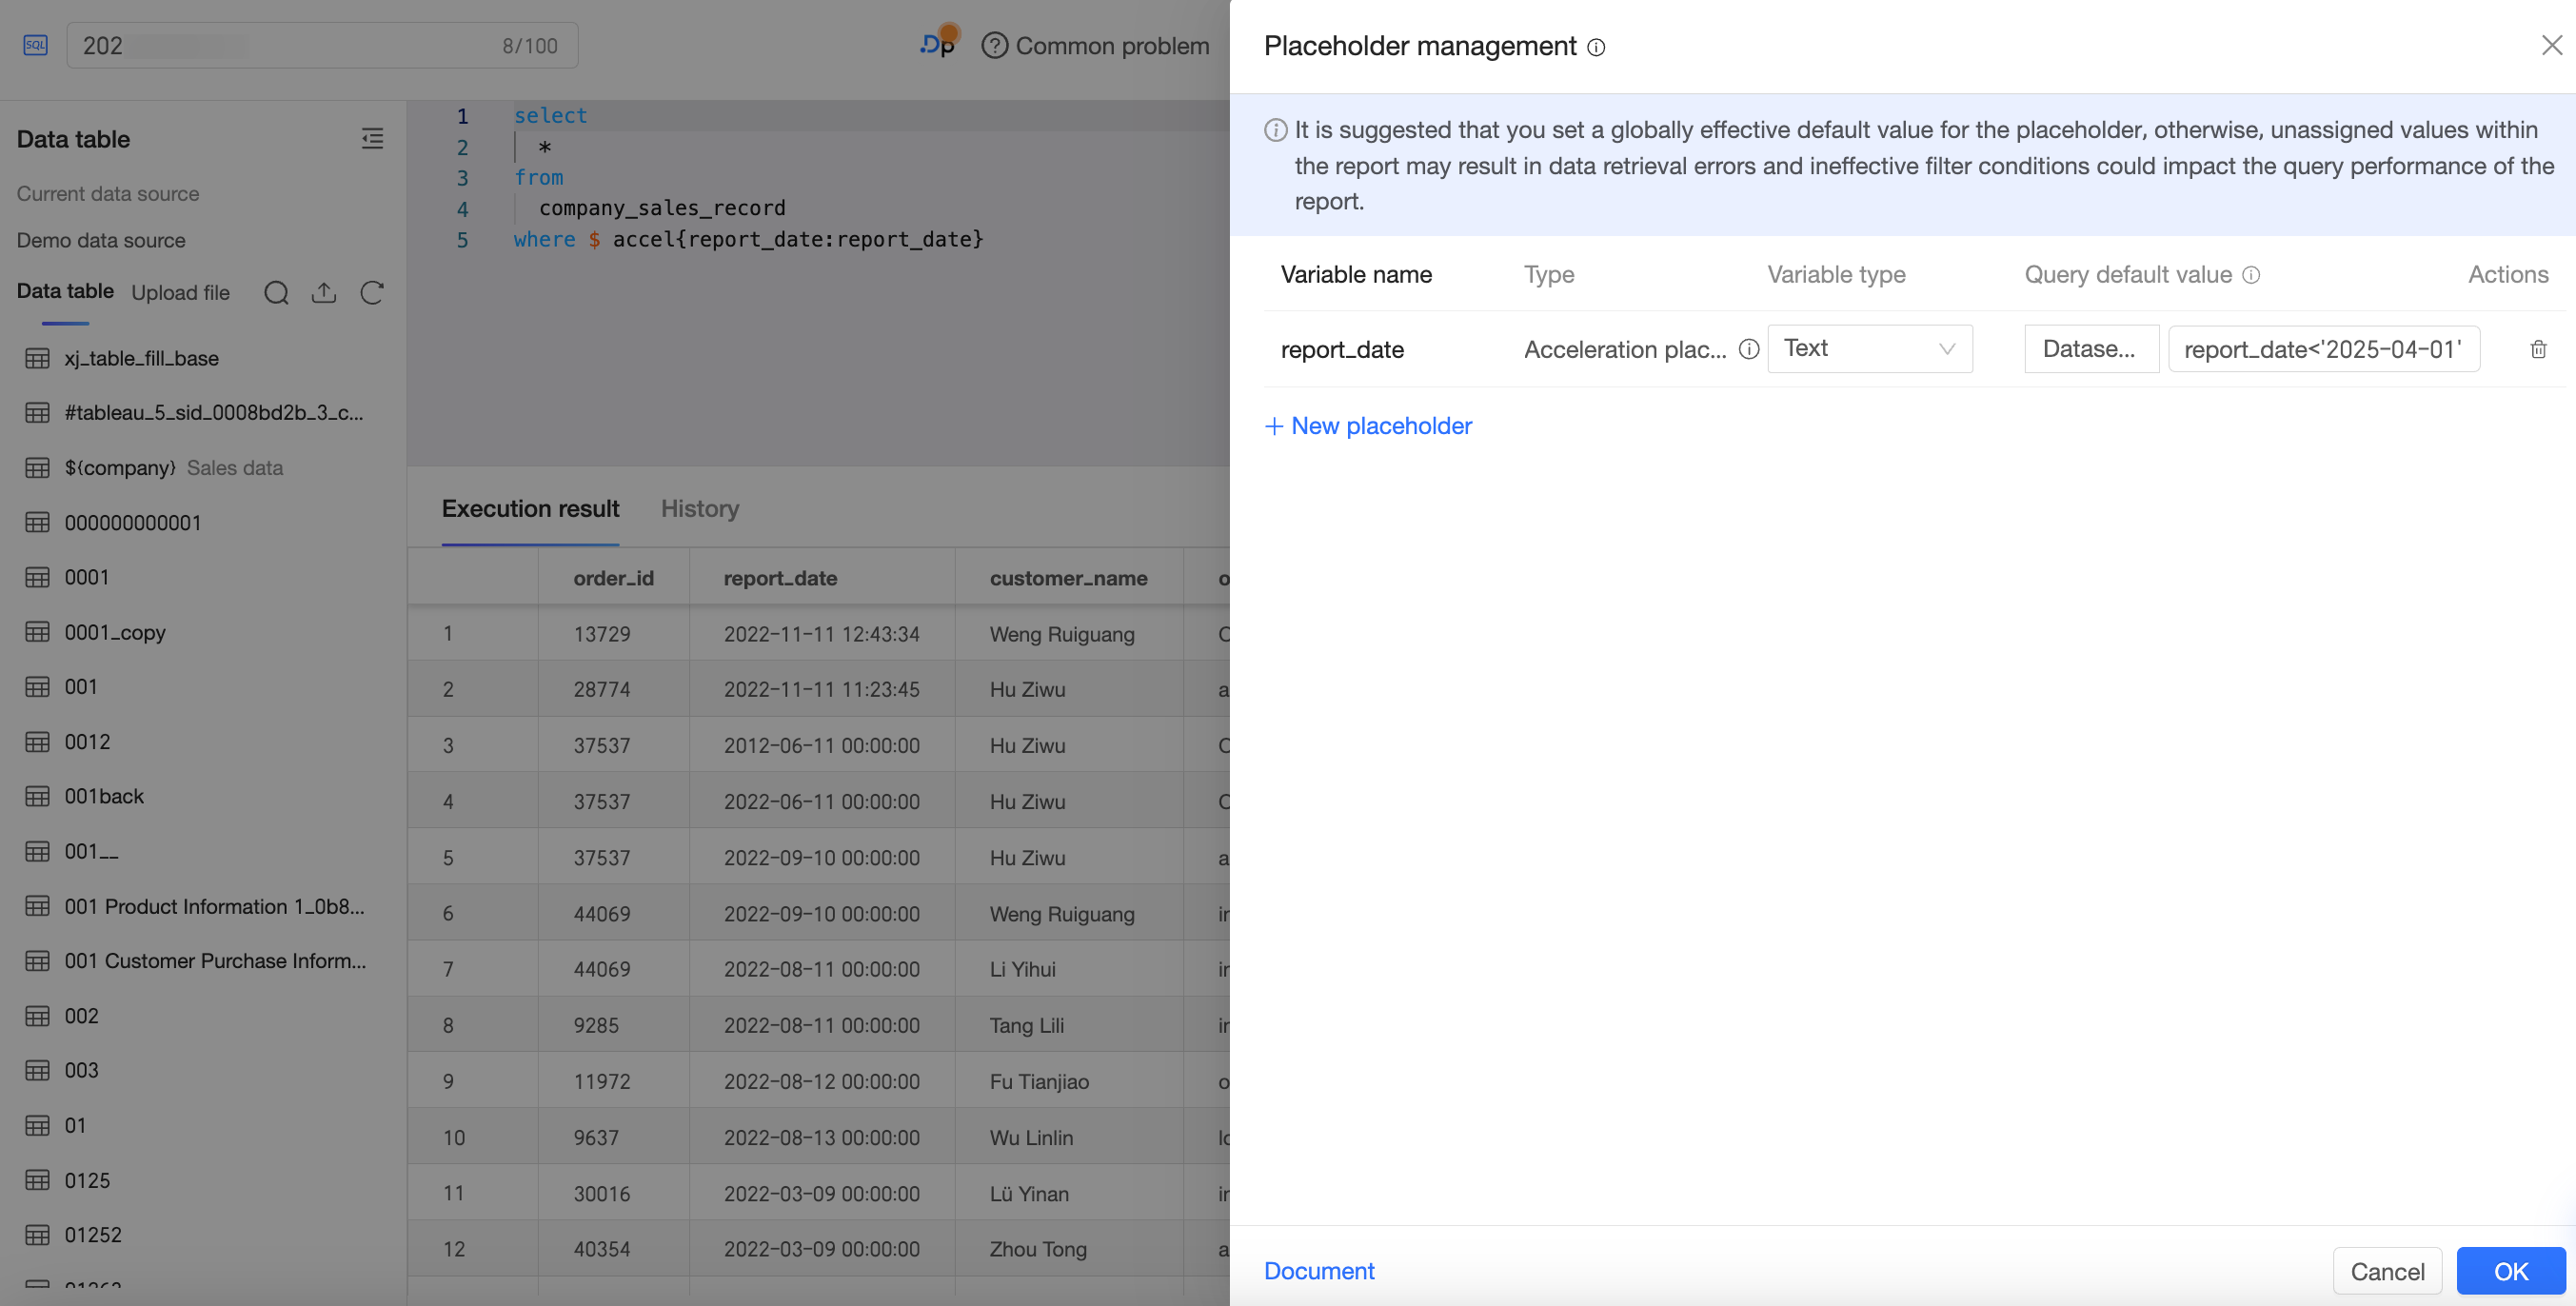
Placeholders let you pass parameters dynamically to SQL queries, calculated fields, and charts. Supported types include value, expression, tag, system, condition, and acceleration. Combined with query controls, they enable interactive analysis — data filtering, metric switching, and reference line adjustments. Acceleration placeholders also improve extraction performance for large datasets and increase report flexibility and responsiveness. For more information, see Placeholders.
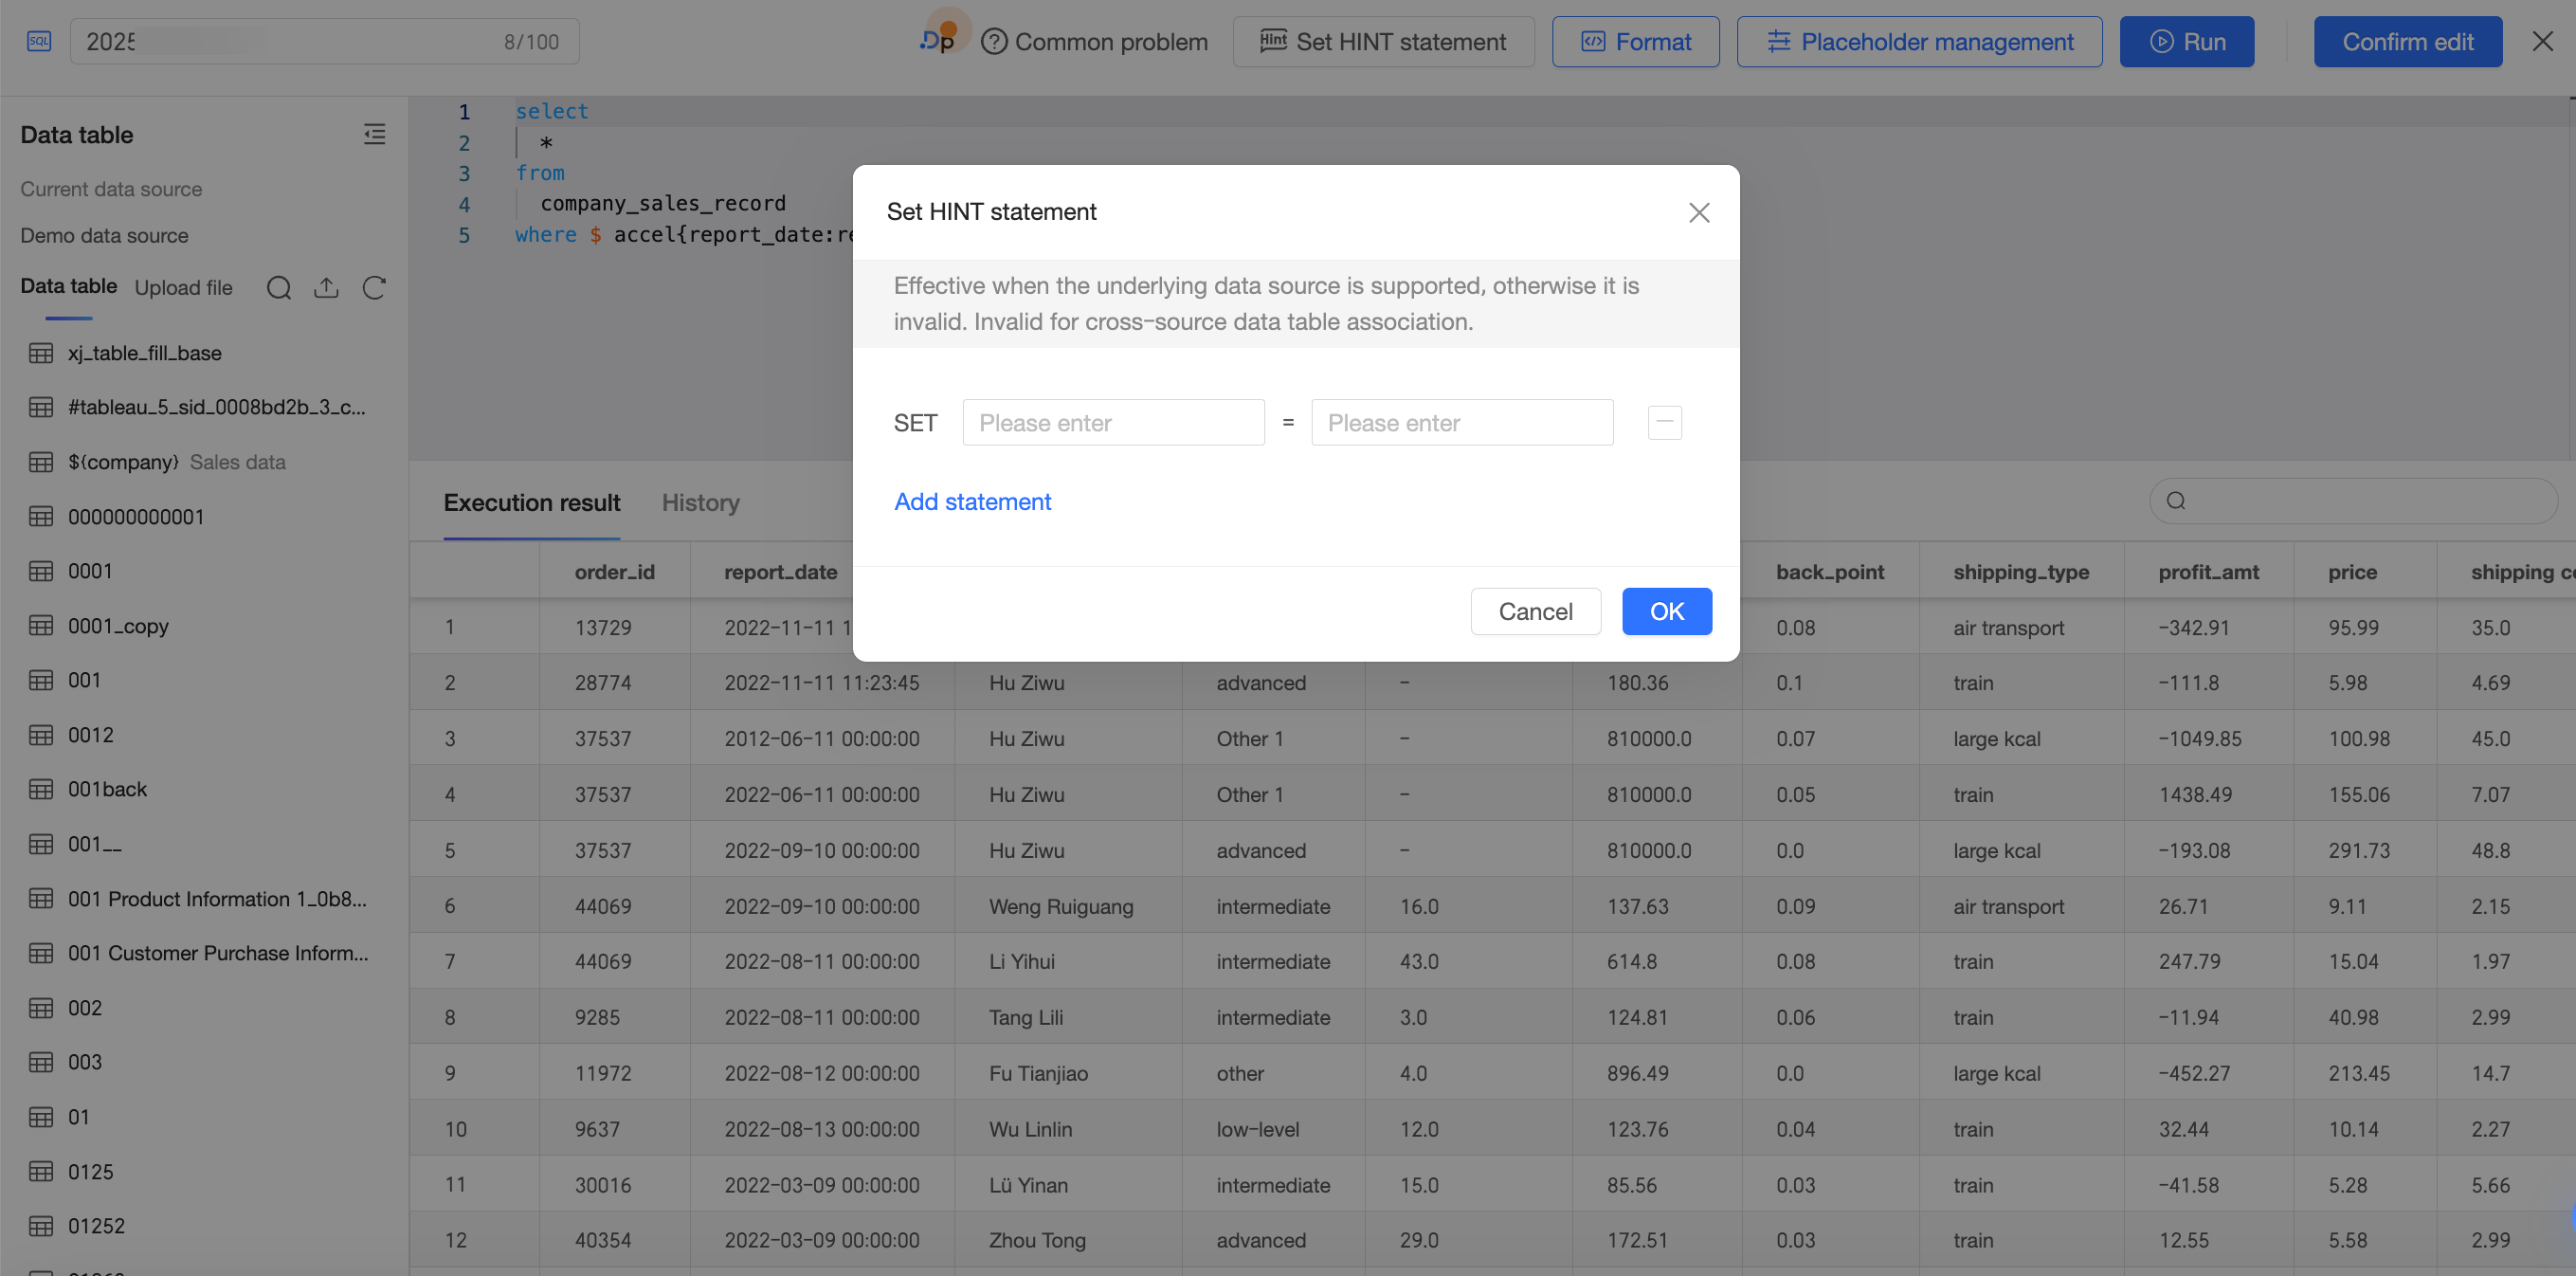
HINT statement
For large datasets or complex queries, add a HINT statement to your dataset to guide the query engine toward more efficient execution — reducing response times and optimizing resource use. For more information, see HINT statement.
What's next
After building the model, click Done, Start Data Processing to open the data processing interface. For more information, see Data processing.