Quick BI reports support AI capabilities such as Q-Question and insight analysis. You can use the AI assistant to generate an analysis outline and then use Q-Question to populate it with relevant data. After inserting a chart, you can use insight analysis to summarize an entire section. Additionally, you can generate charts from text to better visualize your analysis results. This topic explains how to use AI capabilities in a Quick BI report to create a monthly fault monitoring report from scratch.
Create a Blank Report
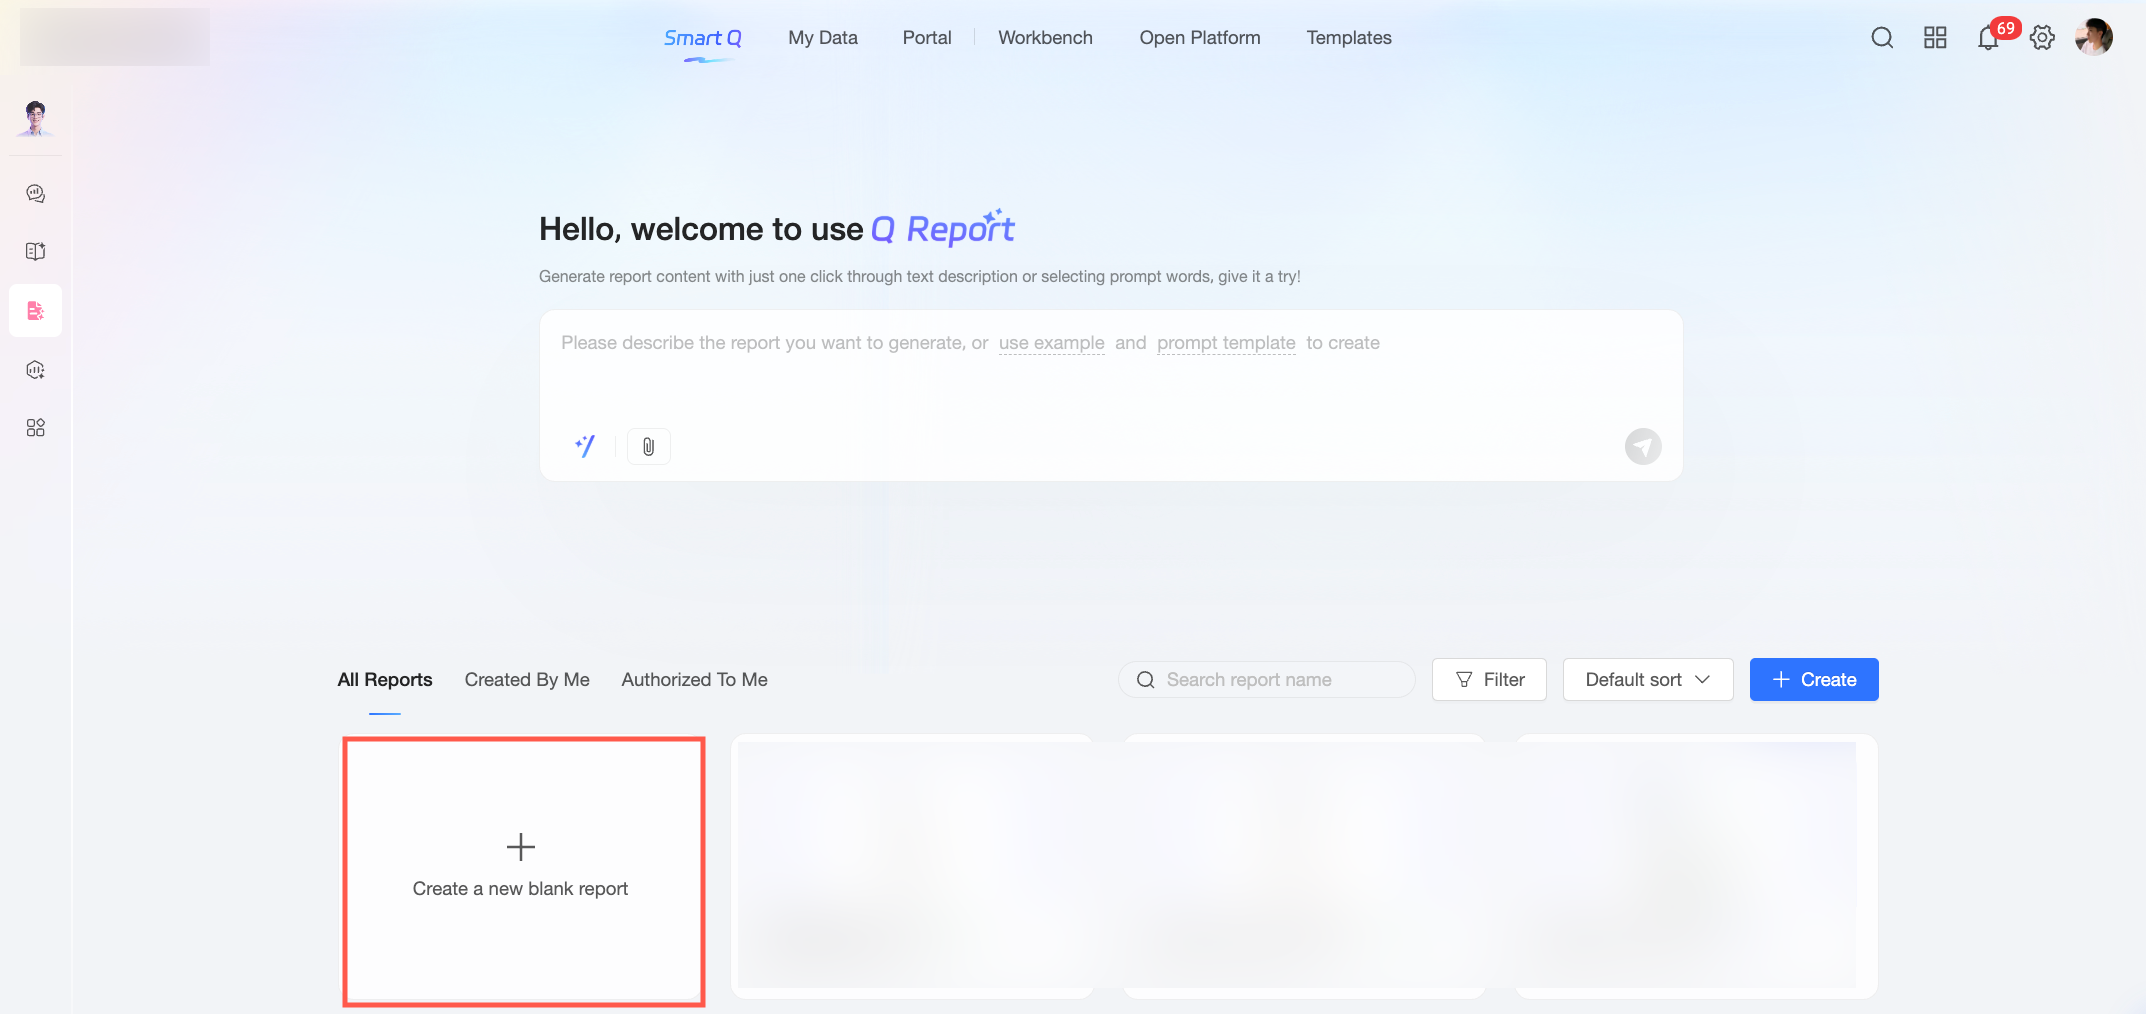
On the Quick BI report homepage, click New Blank Report.
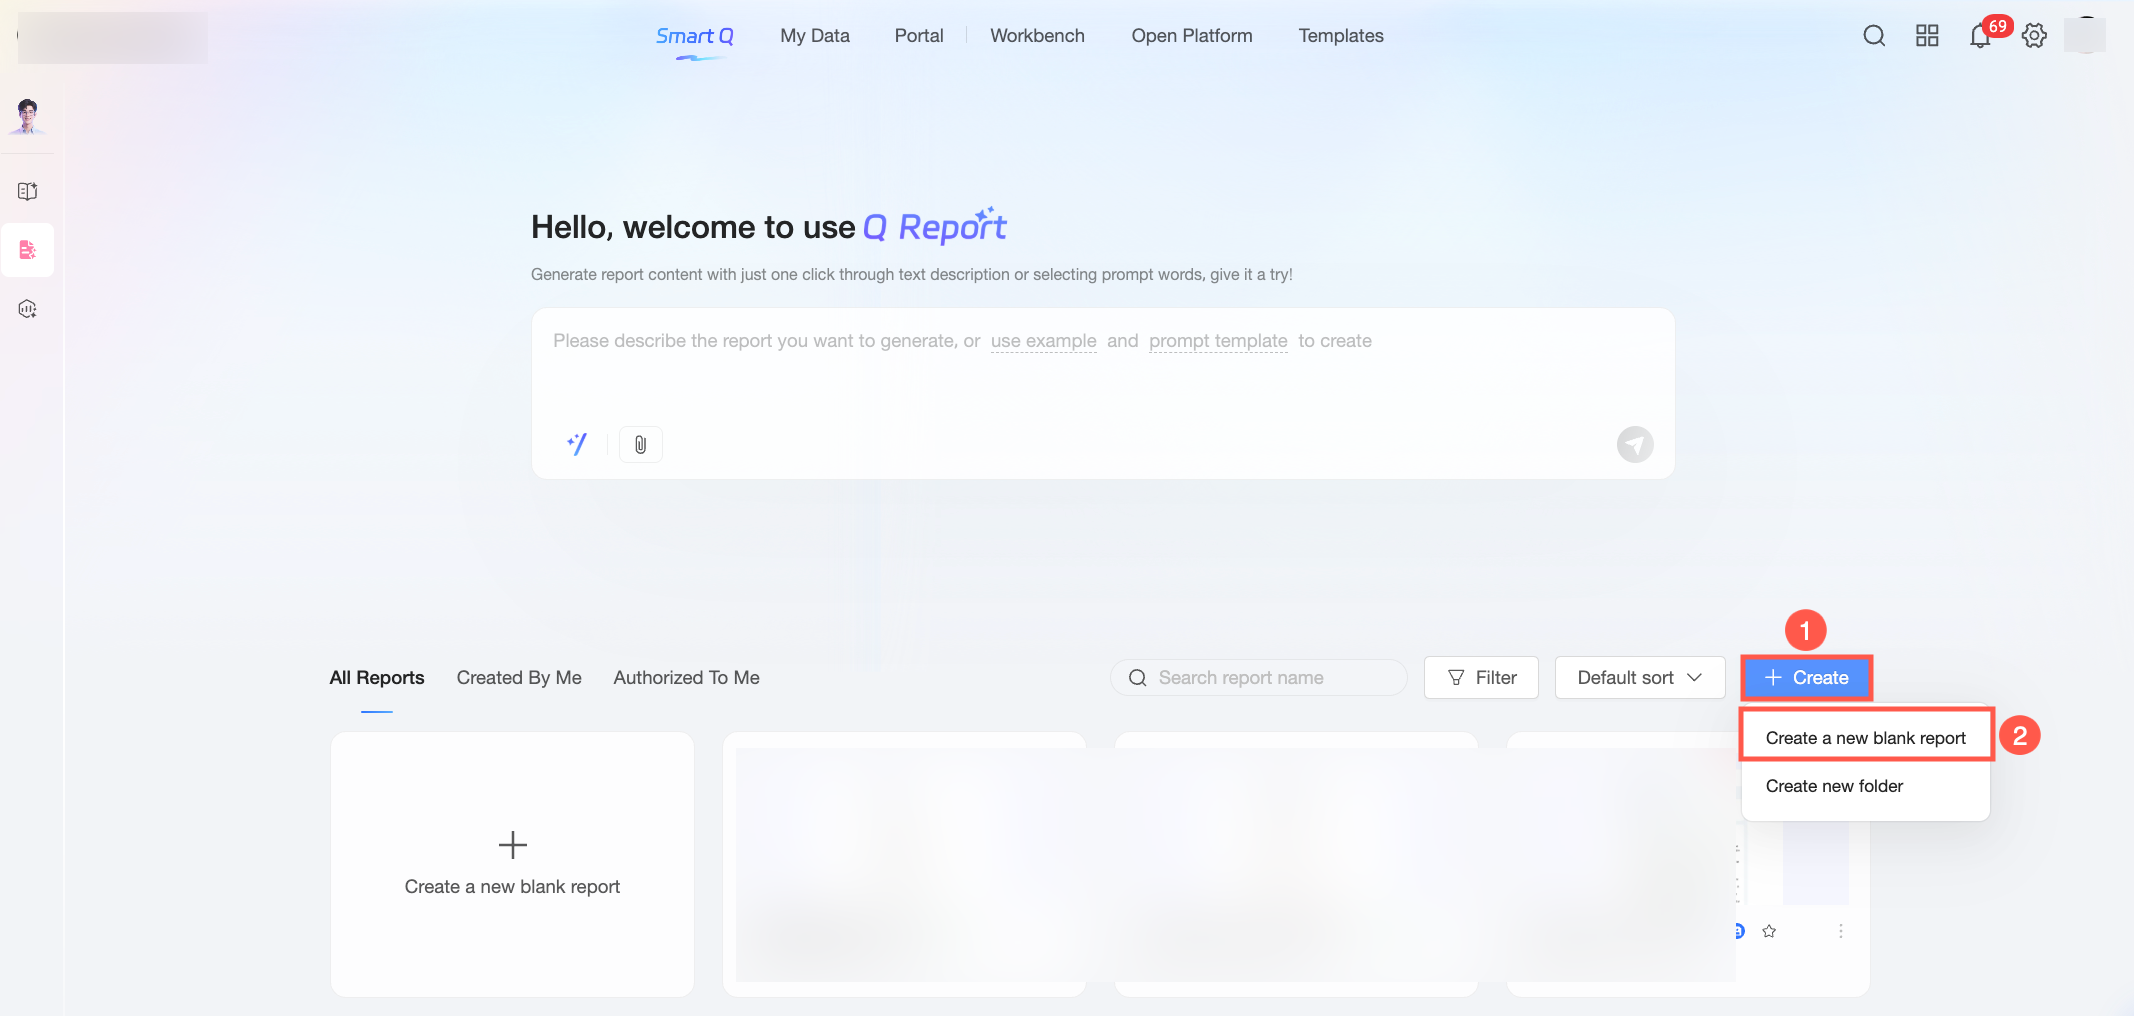
Alternatively, you can click New and then select New Blank Report.
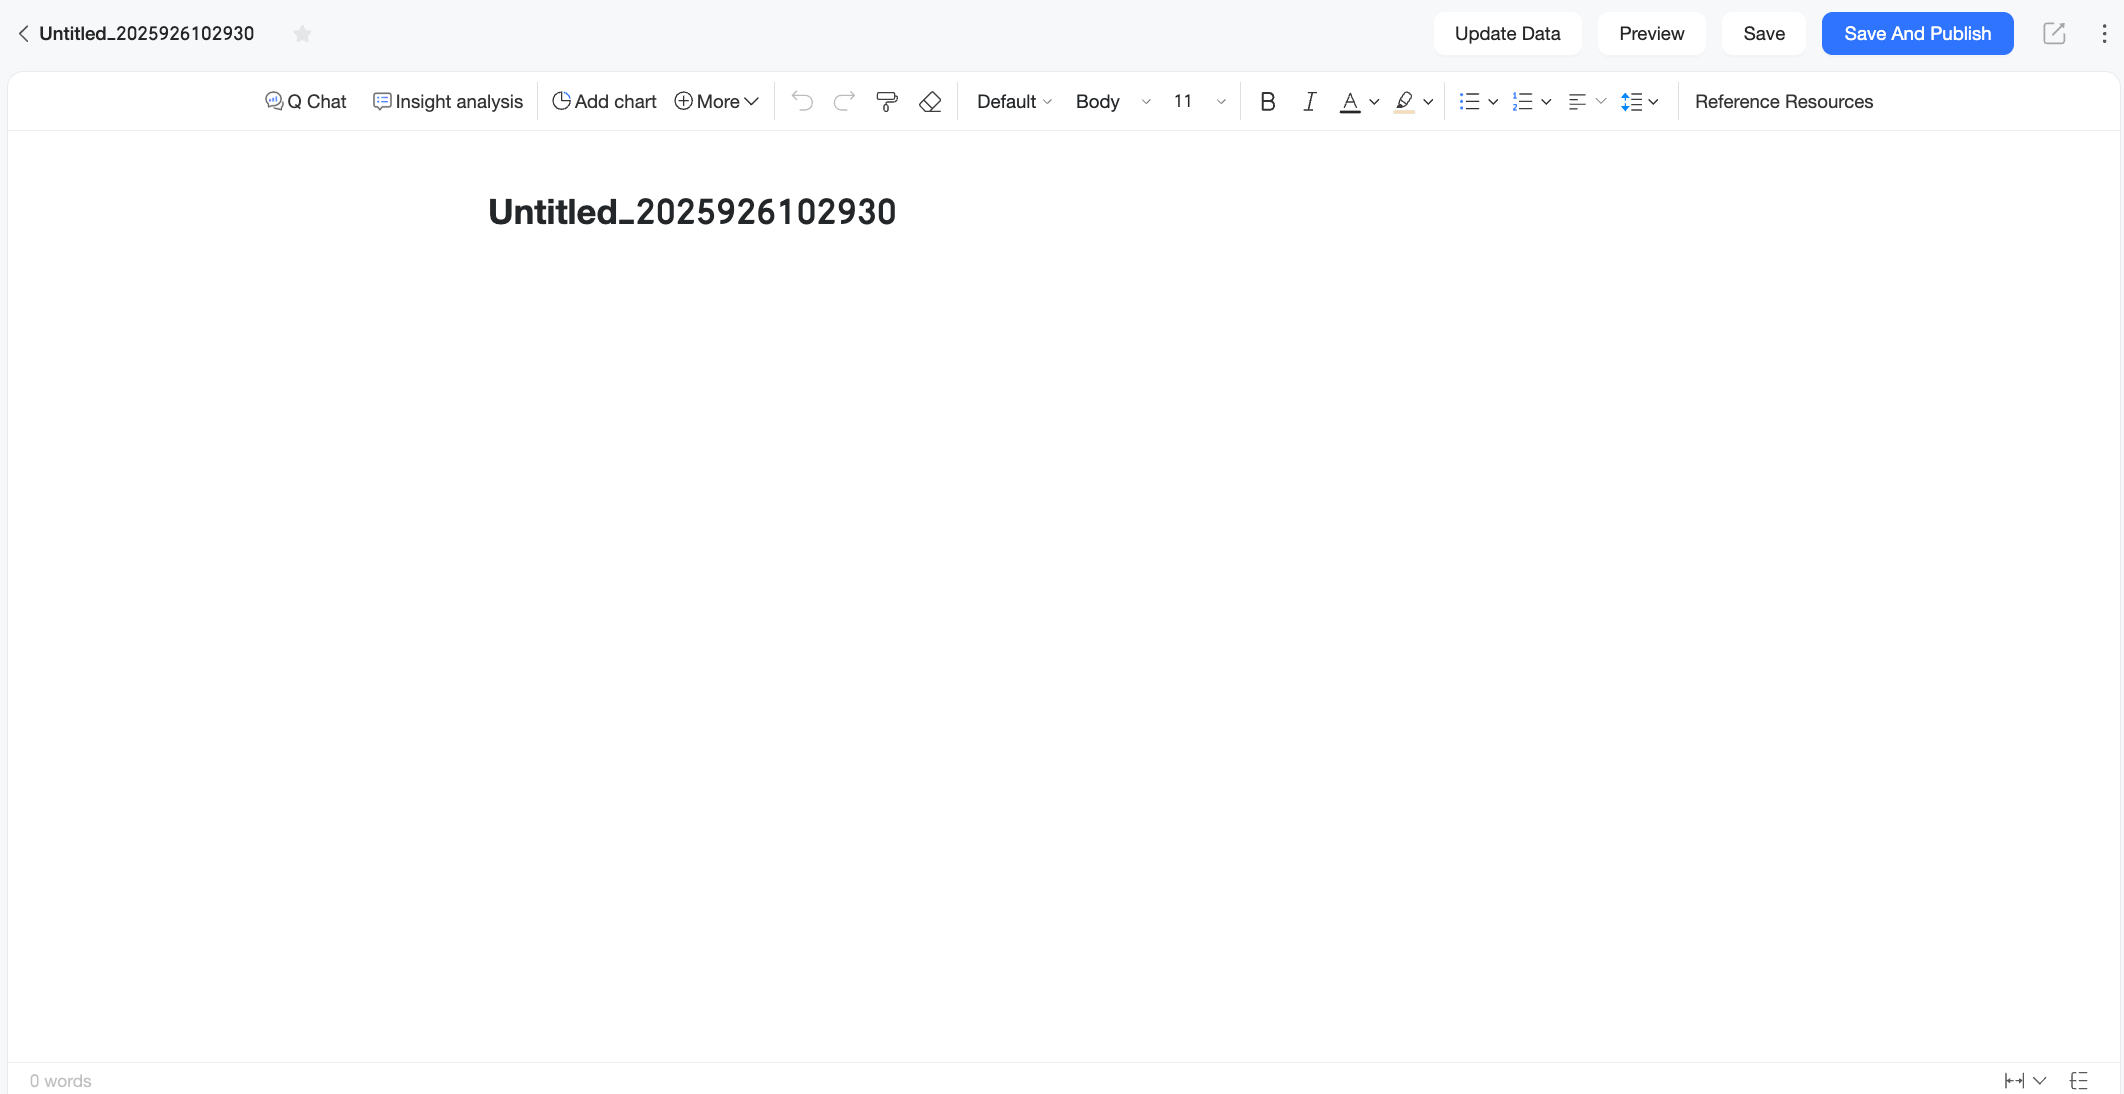
The Quick BI report editing page appears.
Open the AI assistant
After you create a blank report, you can open the AI assistant on the report editing page in any of the following ways:
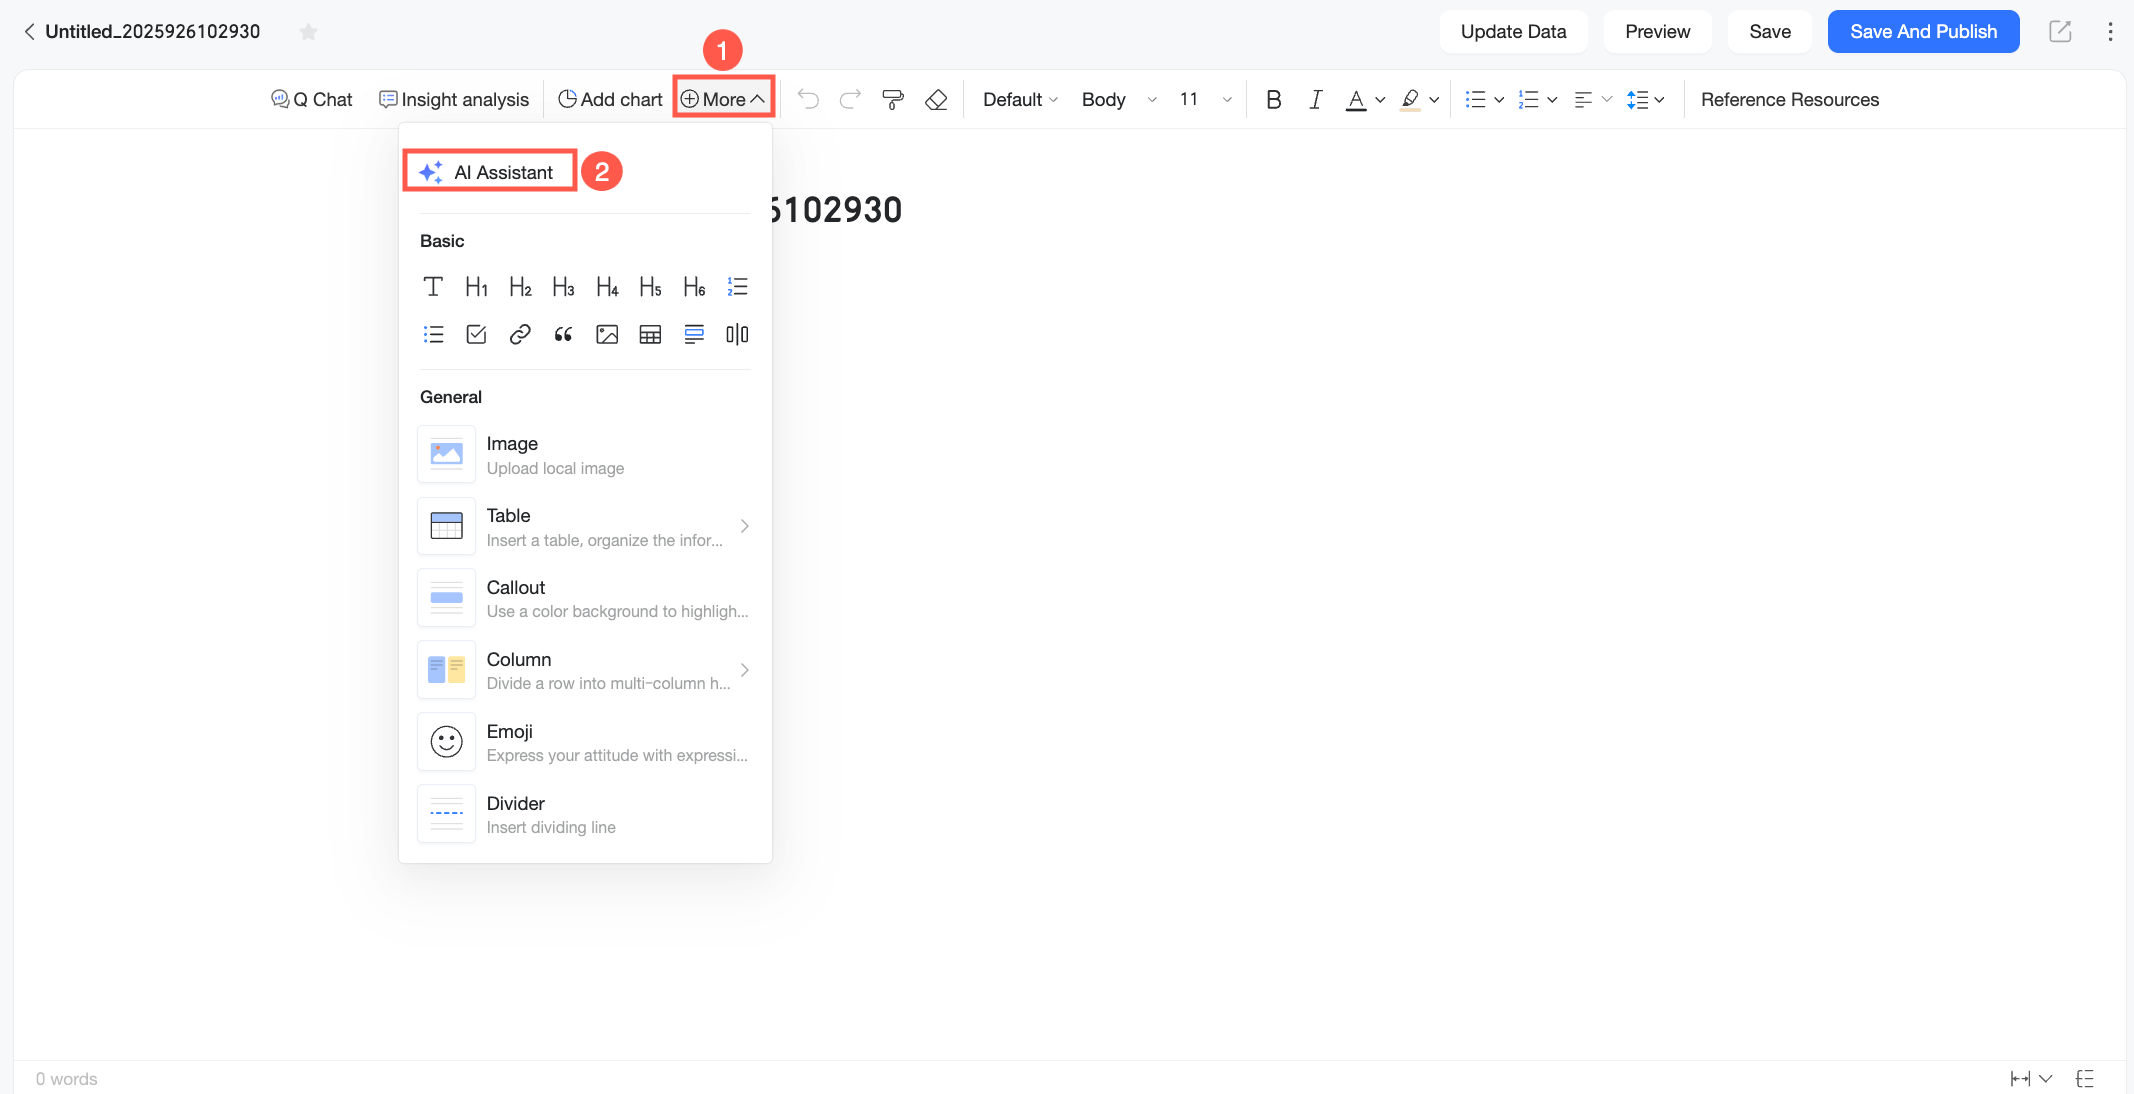
Method 1: On the report editing page, click More and select AI Assistant.
Method 2: Press
cmd+/to open the AI Assistant.Method 3: Type
/to open the menu and select AI Assistant.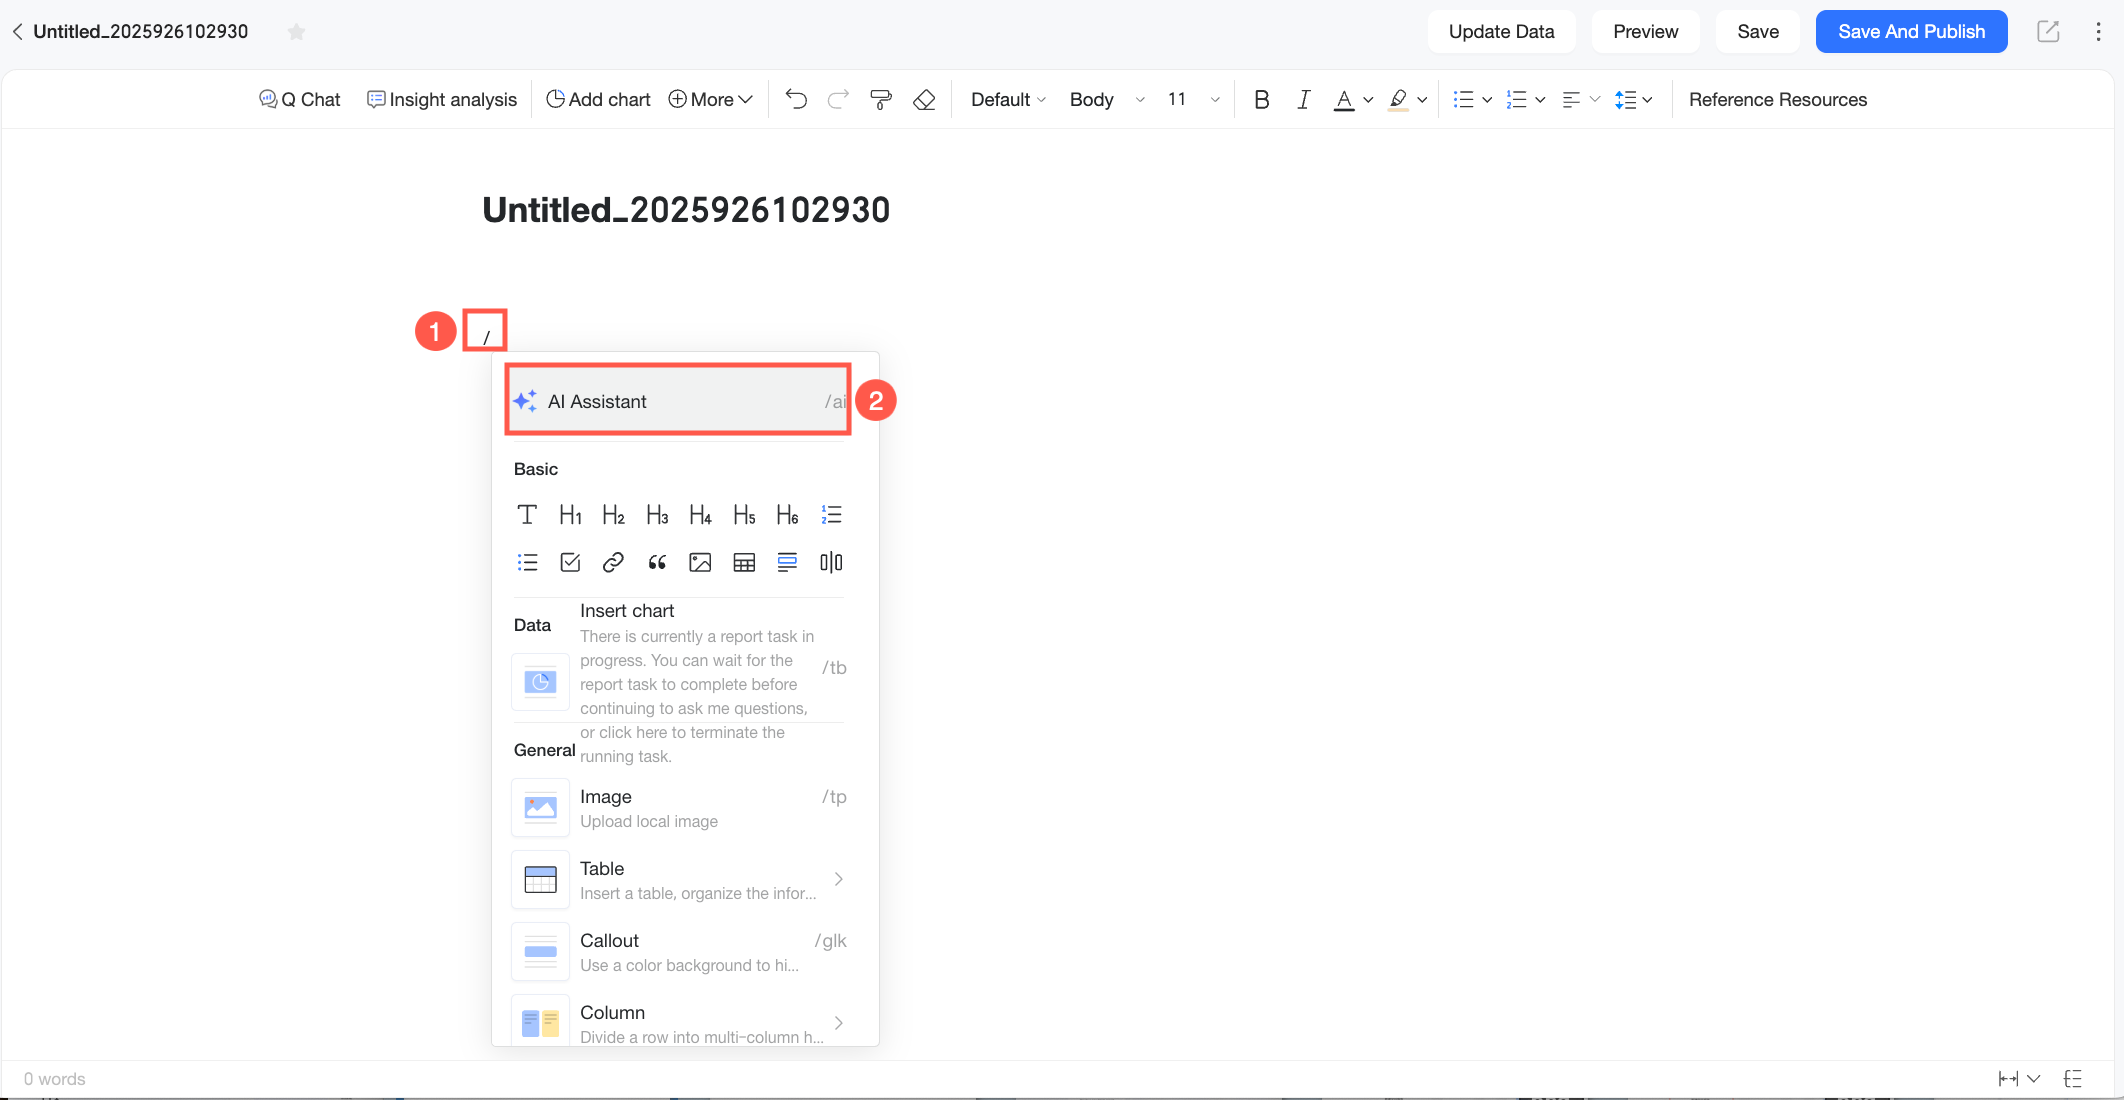
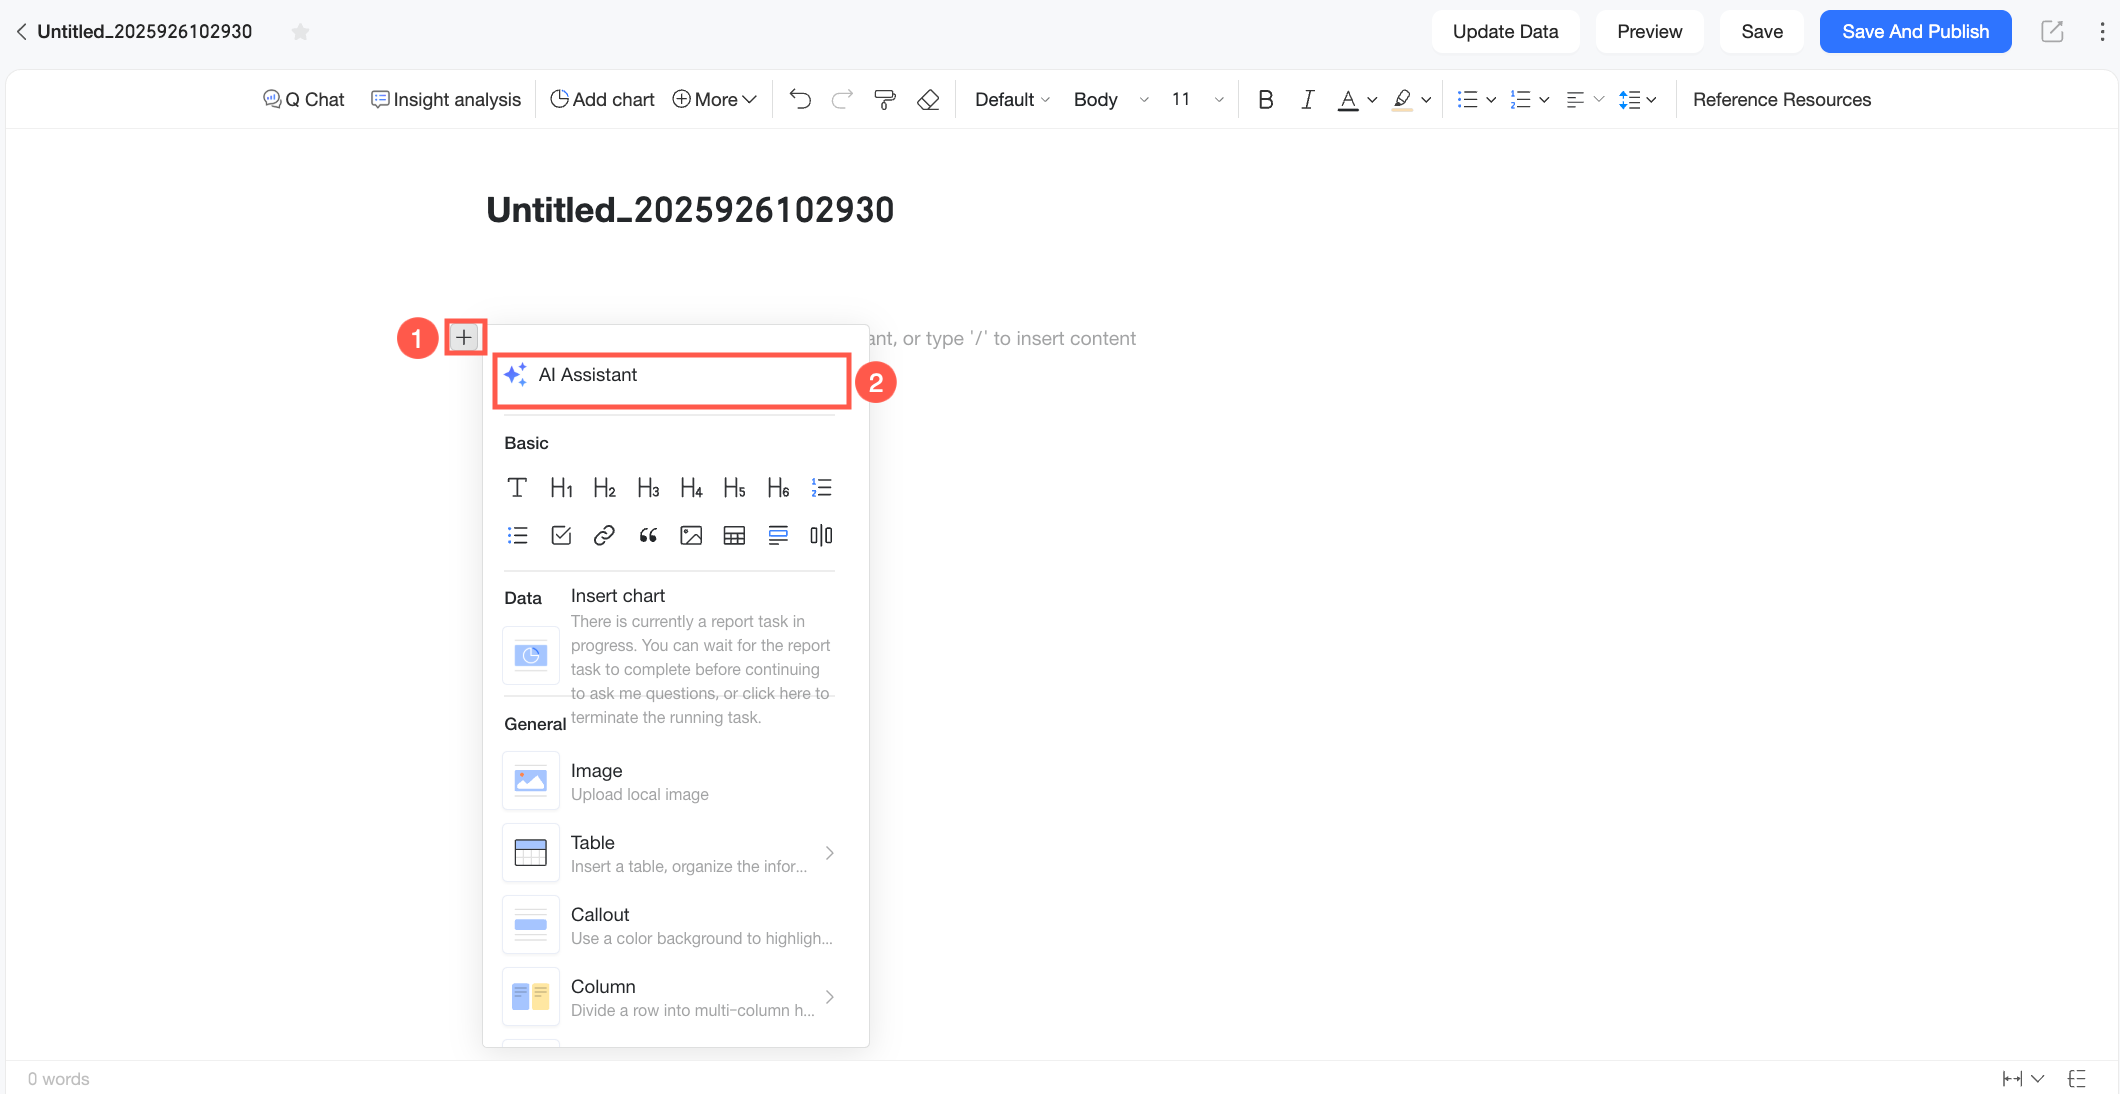
Method 4: Hover your cursor over a blank area, click the plus (+) icon to open the menu, and select AI Assistant.
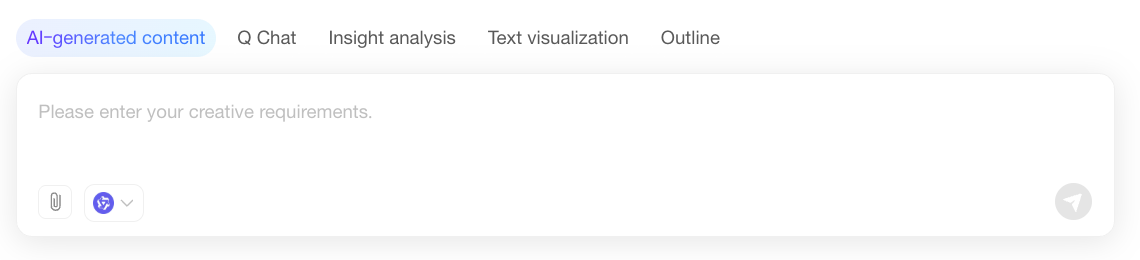
Once the AI assistant is open, enter text in the dialog box to generate report content.
You can configure the following items based on your business needs:
Parameter
Description
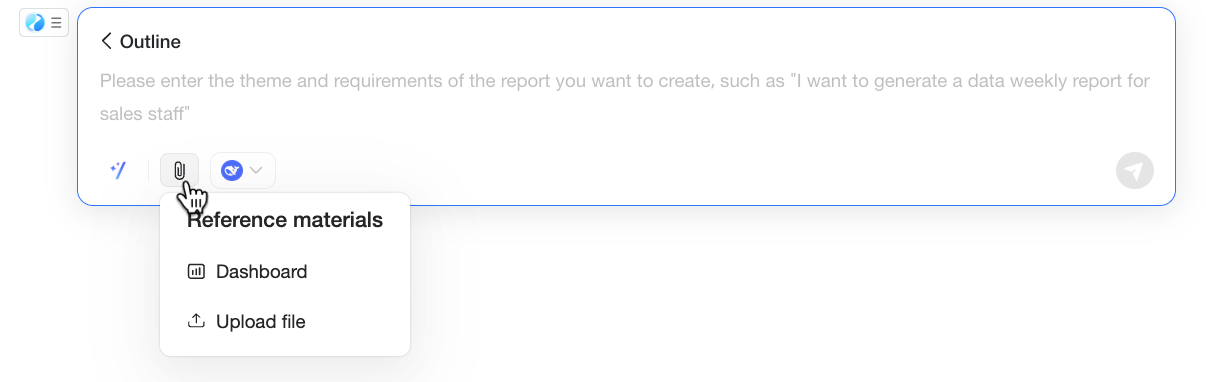
Upload reference materials
Upload dashboard charts or local files.
Select large model
You can select a system built-in large model or a custom large model for the analysis.
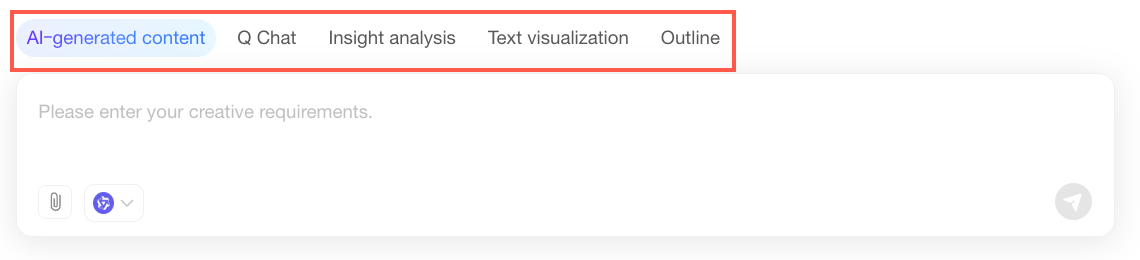
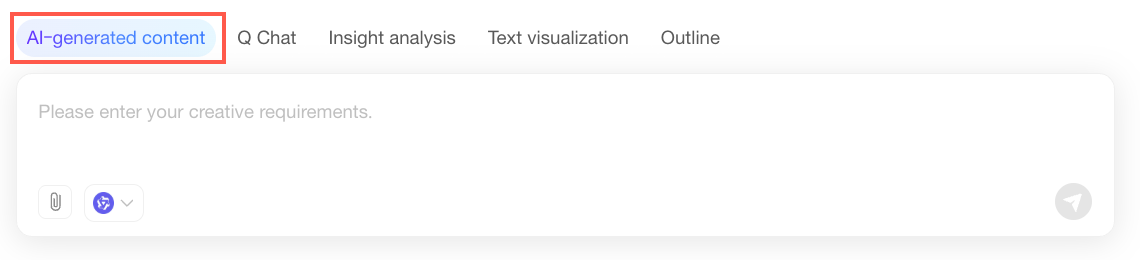
You can also select a feature at the bottom to start an AI Creation, generate an analysis outline, run a Q-Question query, perform an insight analysis, or use text visualization.
AI Creation
AI creation provides an open-ended conversational space where no specific assistant role is assigned. Instead of selecting a specific function such as Q-Question or insight analysis, you can directly enter questions, requirements, or ideas, and the AI model generates a natural response. This feature is ideal for scenarios where you need to freely converse with the AI to gather creative ideas and inspiration.
Generate an Analysis Outline
After you create a blank report, you can generate an analysis outline based on your business requirements. Follow these steps:
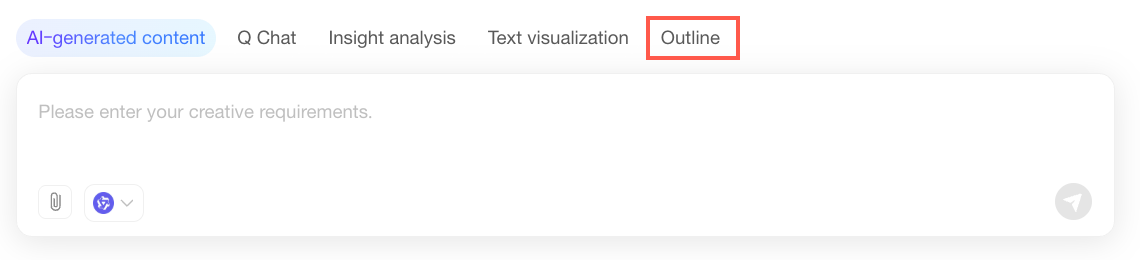
In the AI assistant, select Analysis Outline.
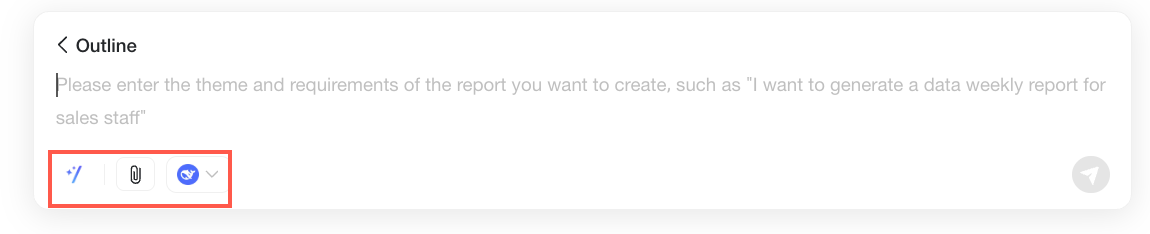
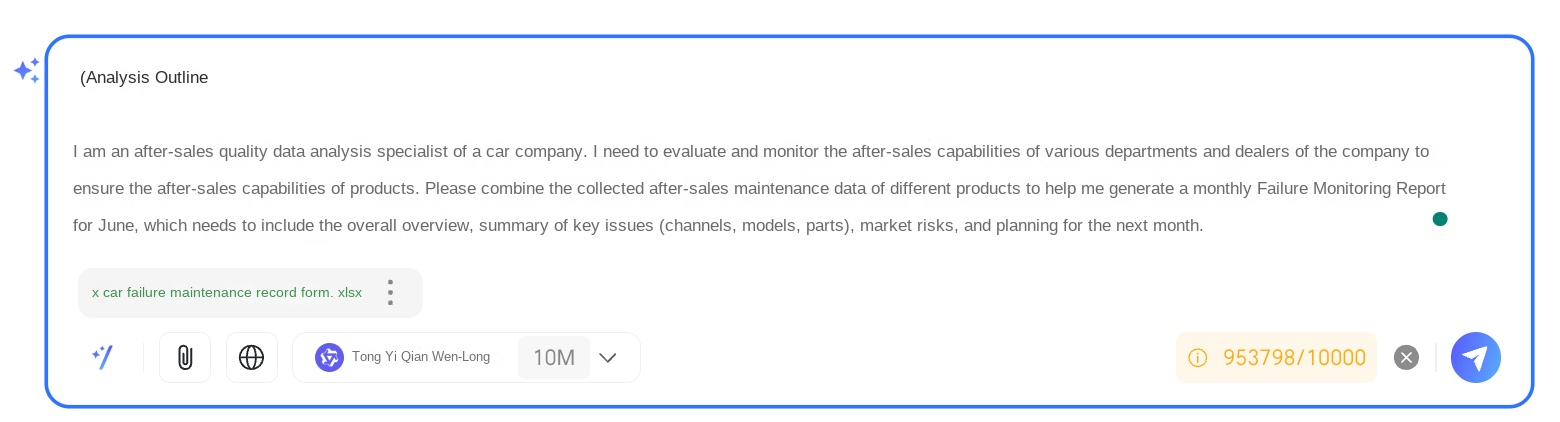
In the Analysis Outline dialog box, enter the topic and requirements for your report.
You can configure the following items based on your business needs:
Parameter
Description
Prompt
Click the
 icon to open a prompt template. Select a template and modify it based on your business needs.
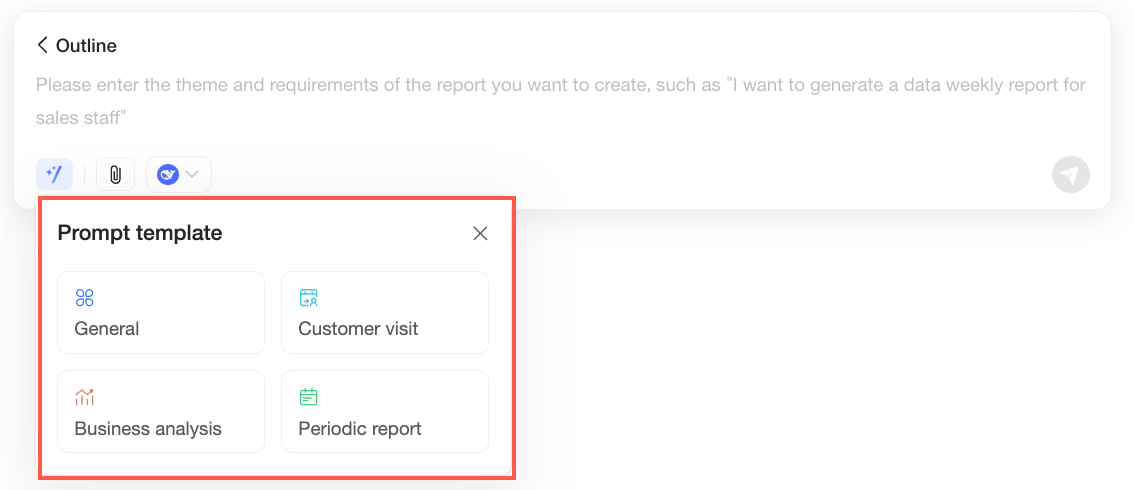
Upload reference materials
Upload dashboard charts or local files.
Select large model
You can select a system built-in large model or a custom large model for the analysis.
In this example, a custom prompt is entered and a local file is uploaded as a reference.
Click Send. The system automatically generates the analysis outline.
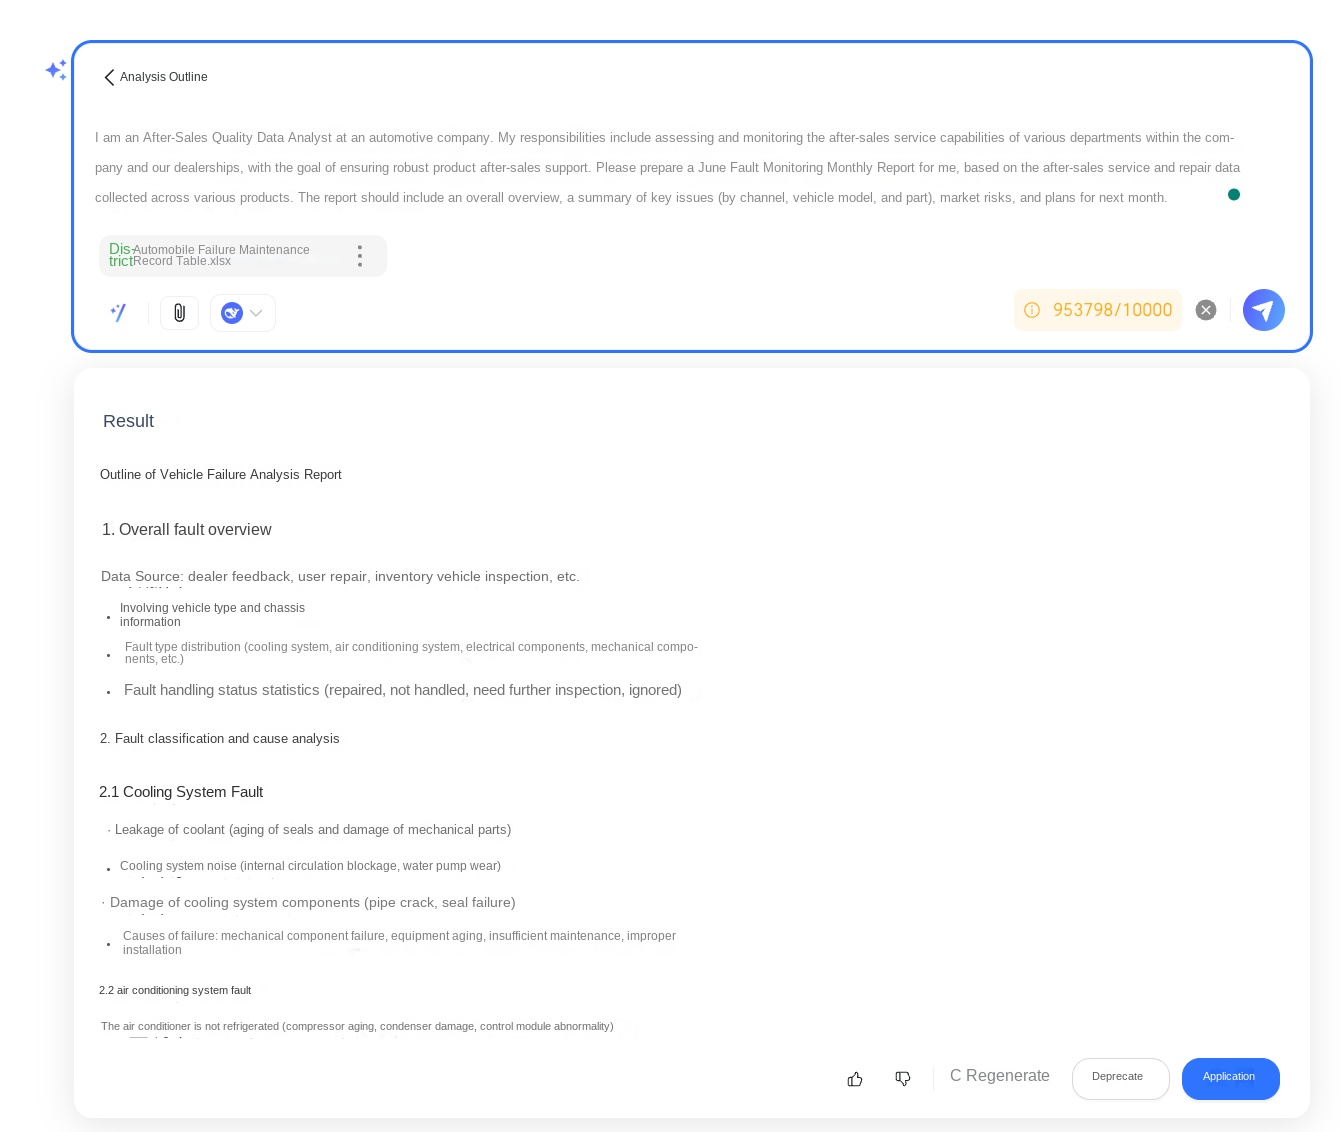
Below the generated analysis outline, you can perform the following operations: Like/Dislike, Regenerate, Discard, and Apply.
Actions
Description
Like/Dislike
Rate the analysis outline to indicate whether you are satisfied with the result.
Regenerate
The system generates a new analysis outline based on the content entered in the dialog box.
Discard
Discards the generated analysis outline and returns to the previous step.
Apply
Apply the analysis outline to the Quick BI report.
When the generated analysis outline meets your expectations, click Apply to add it to the Quick BI report.
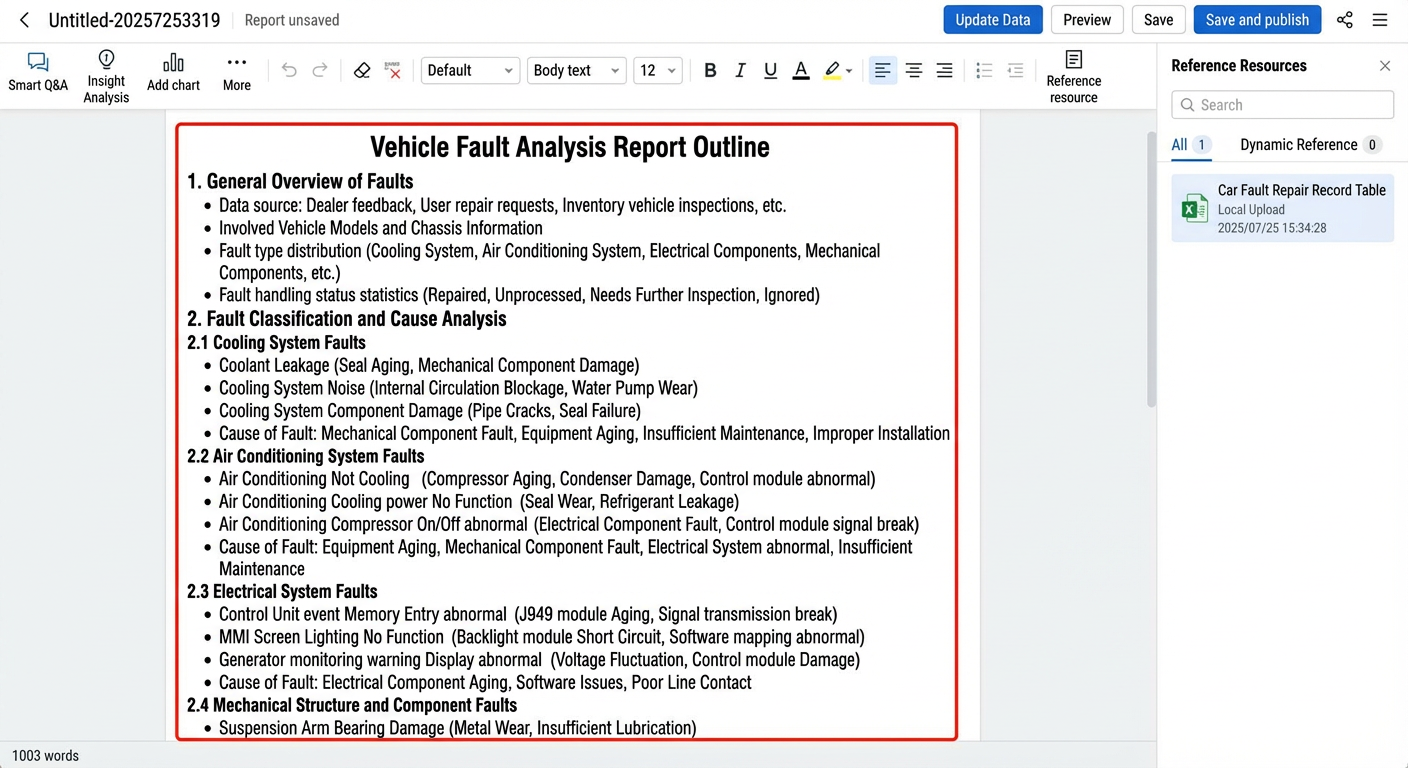
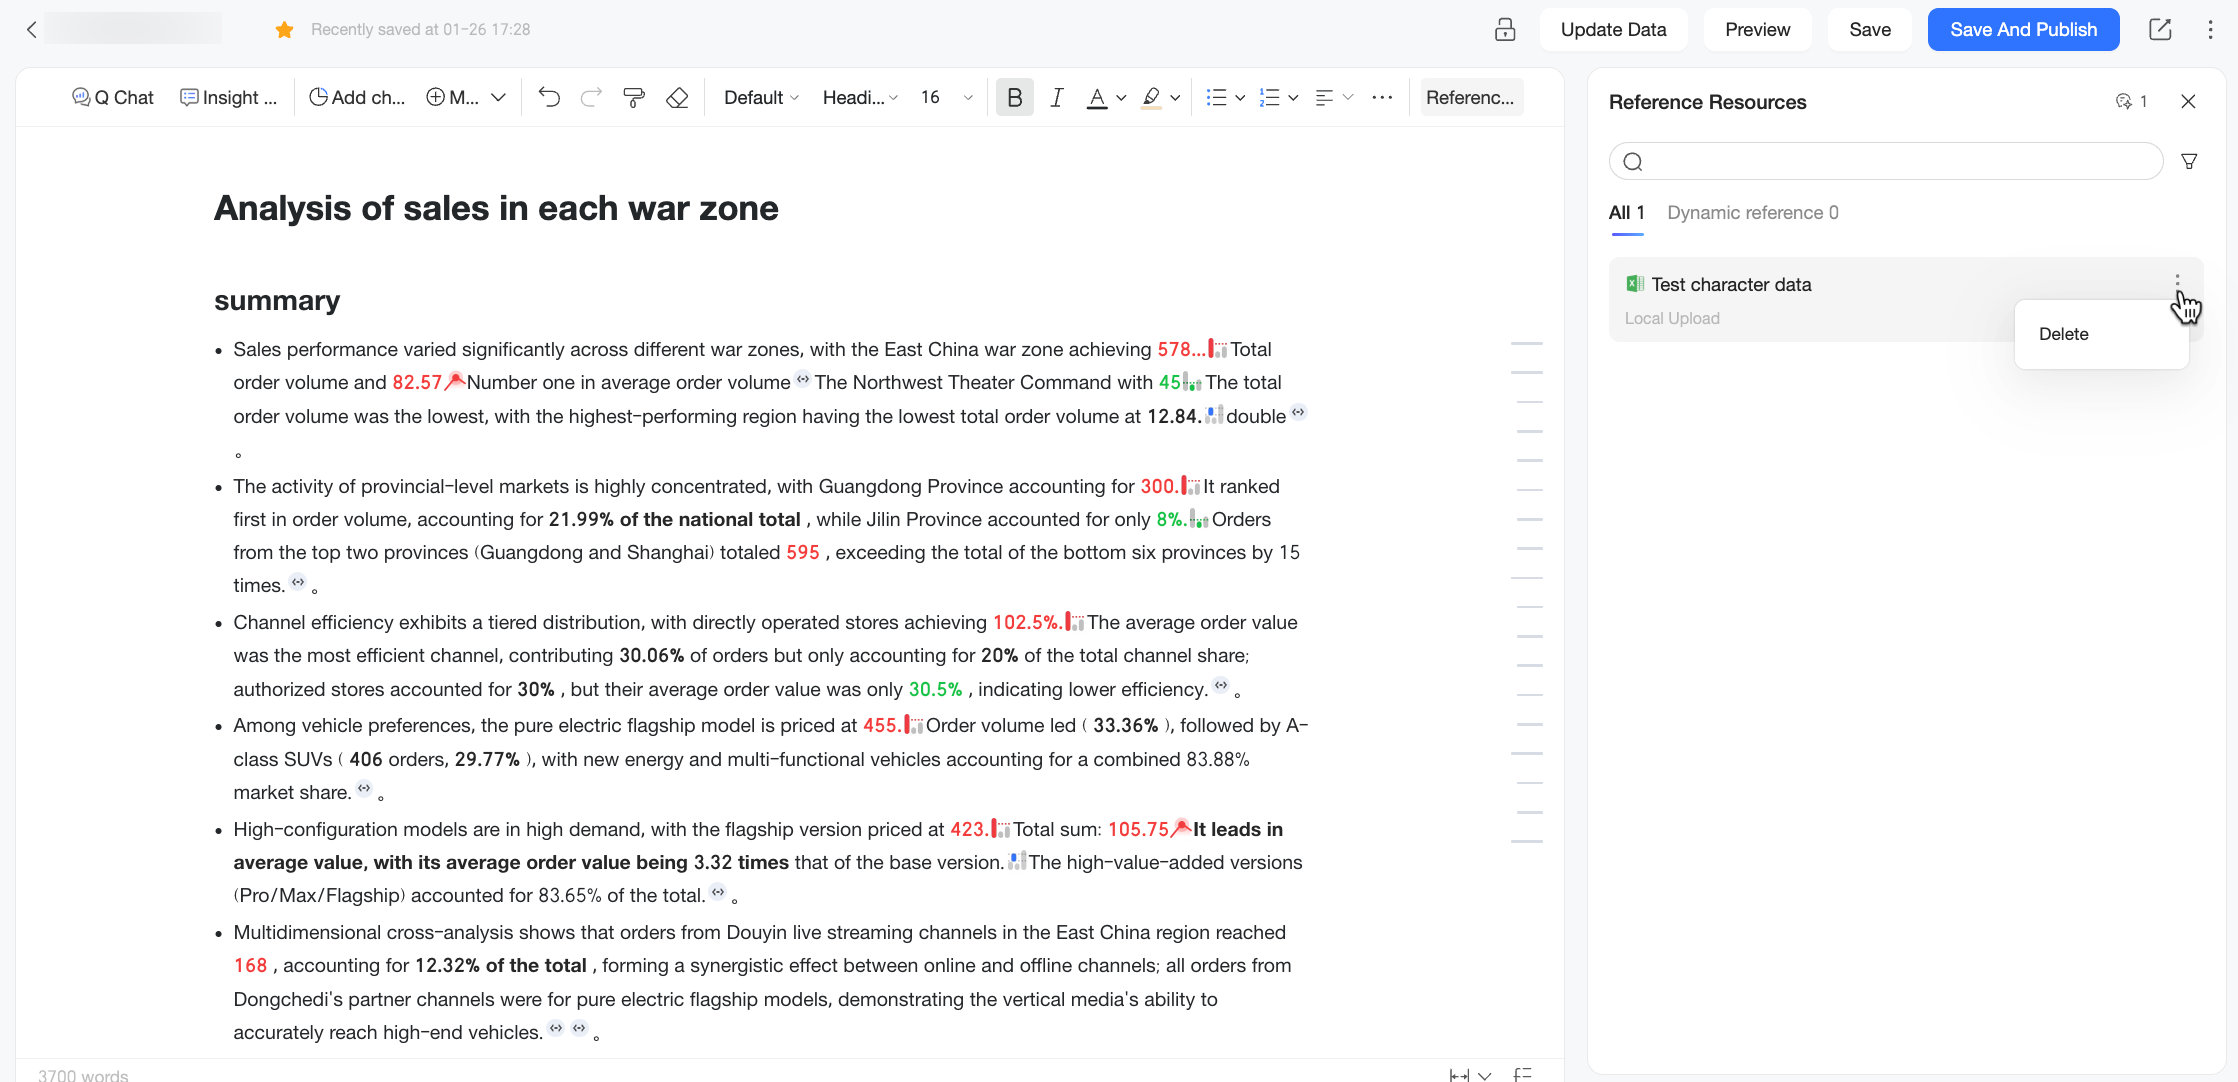
The local resource you uploaded appears in the Referenced Resources list on the right side of the report editing page. You can Preview or Delete the resource. For more information, see Manage Quick BI reports.
After you close the Referenced Resources list, you can hover over the collapsed outline on the right or click the
 icon in the lower-right corner to display the Outline.
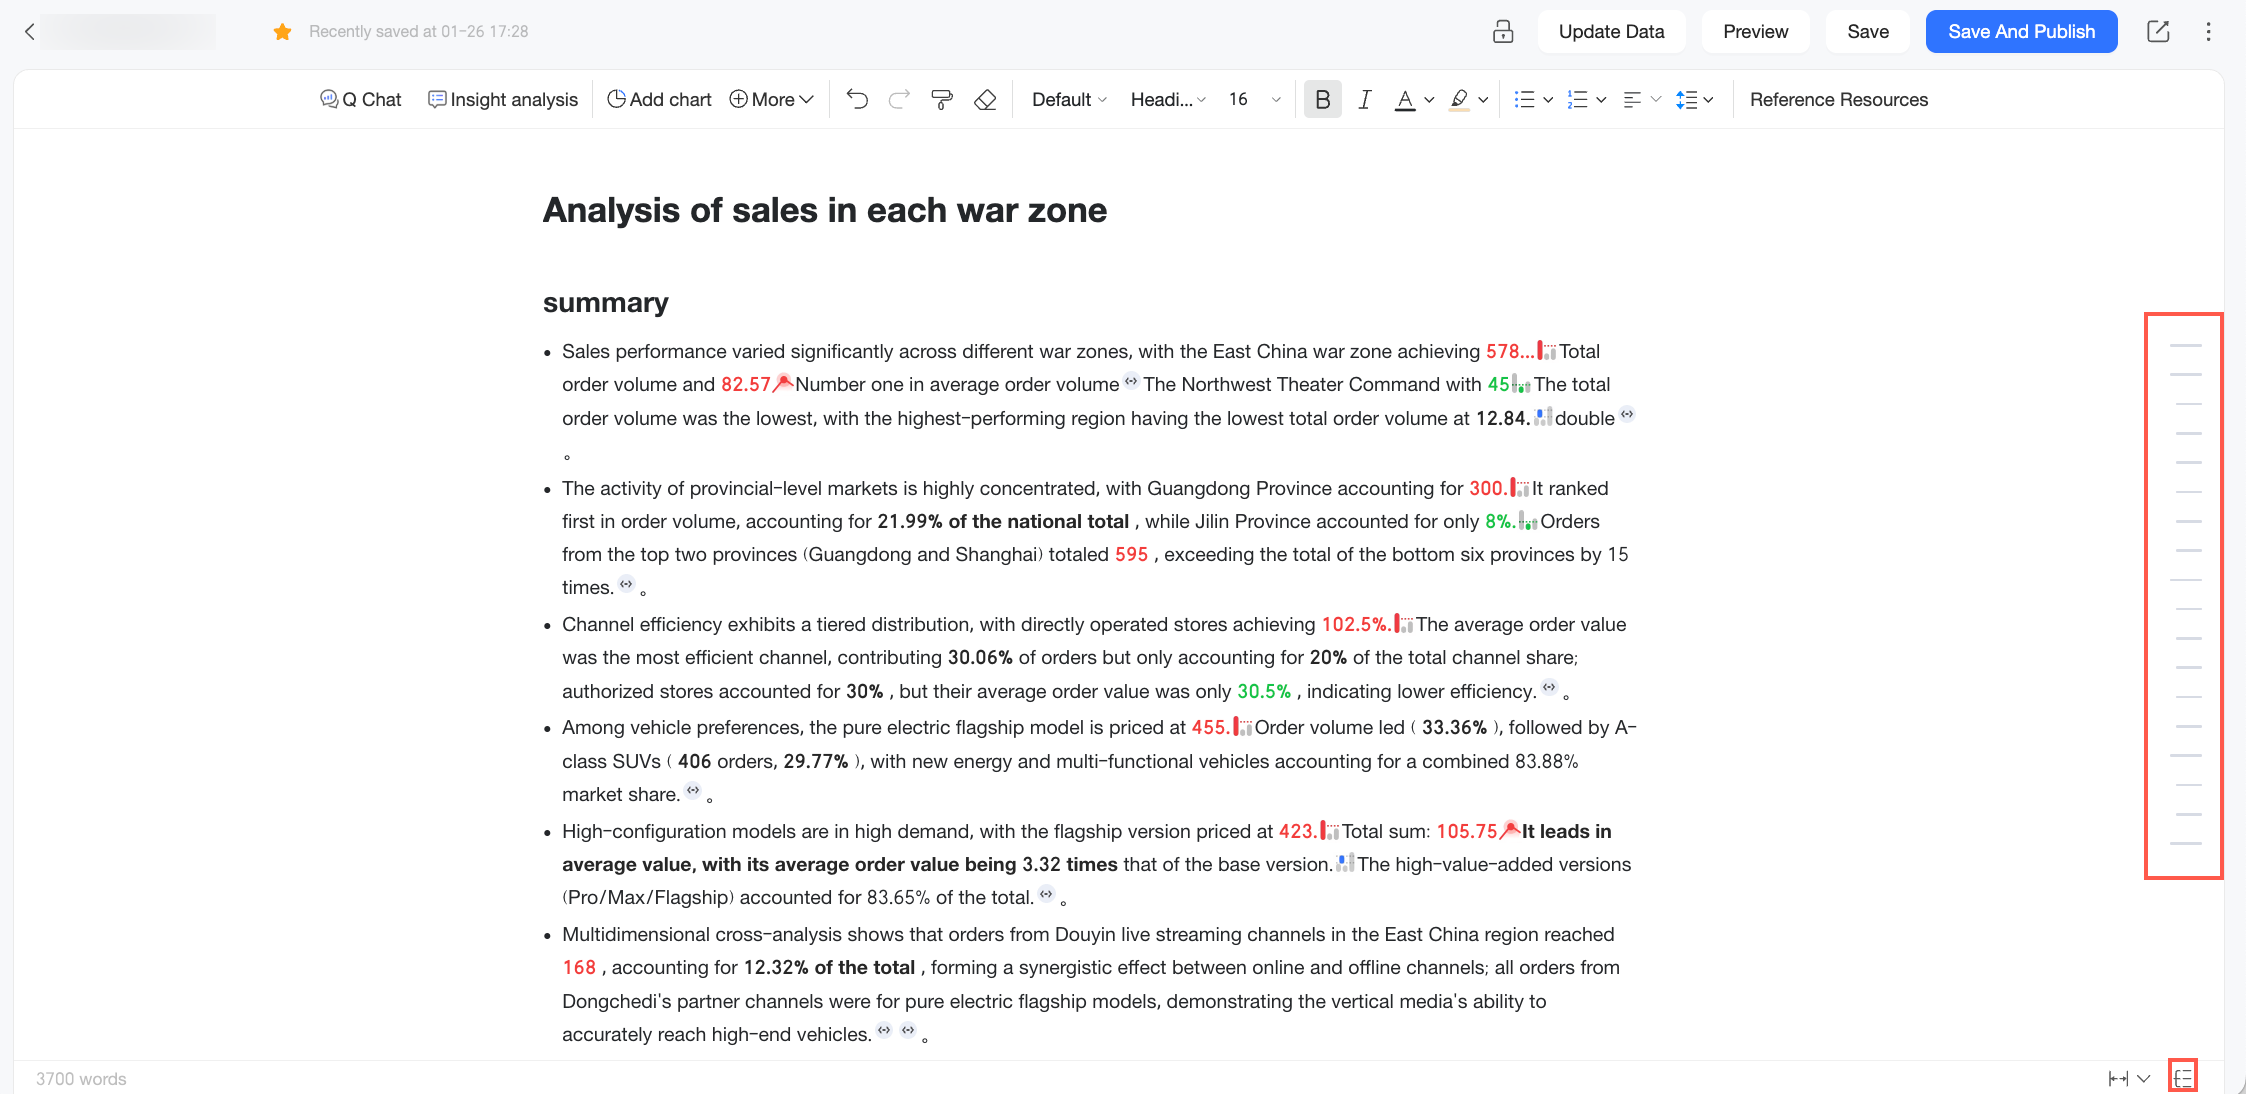
To pin the outline to the page, click the
 icon to Pin Outline.
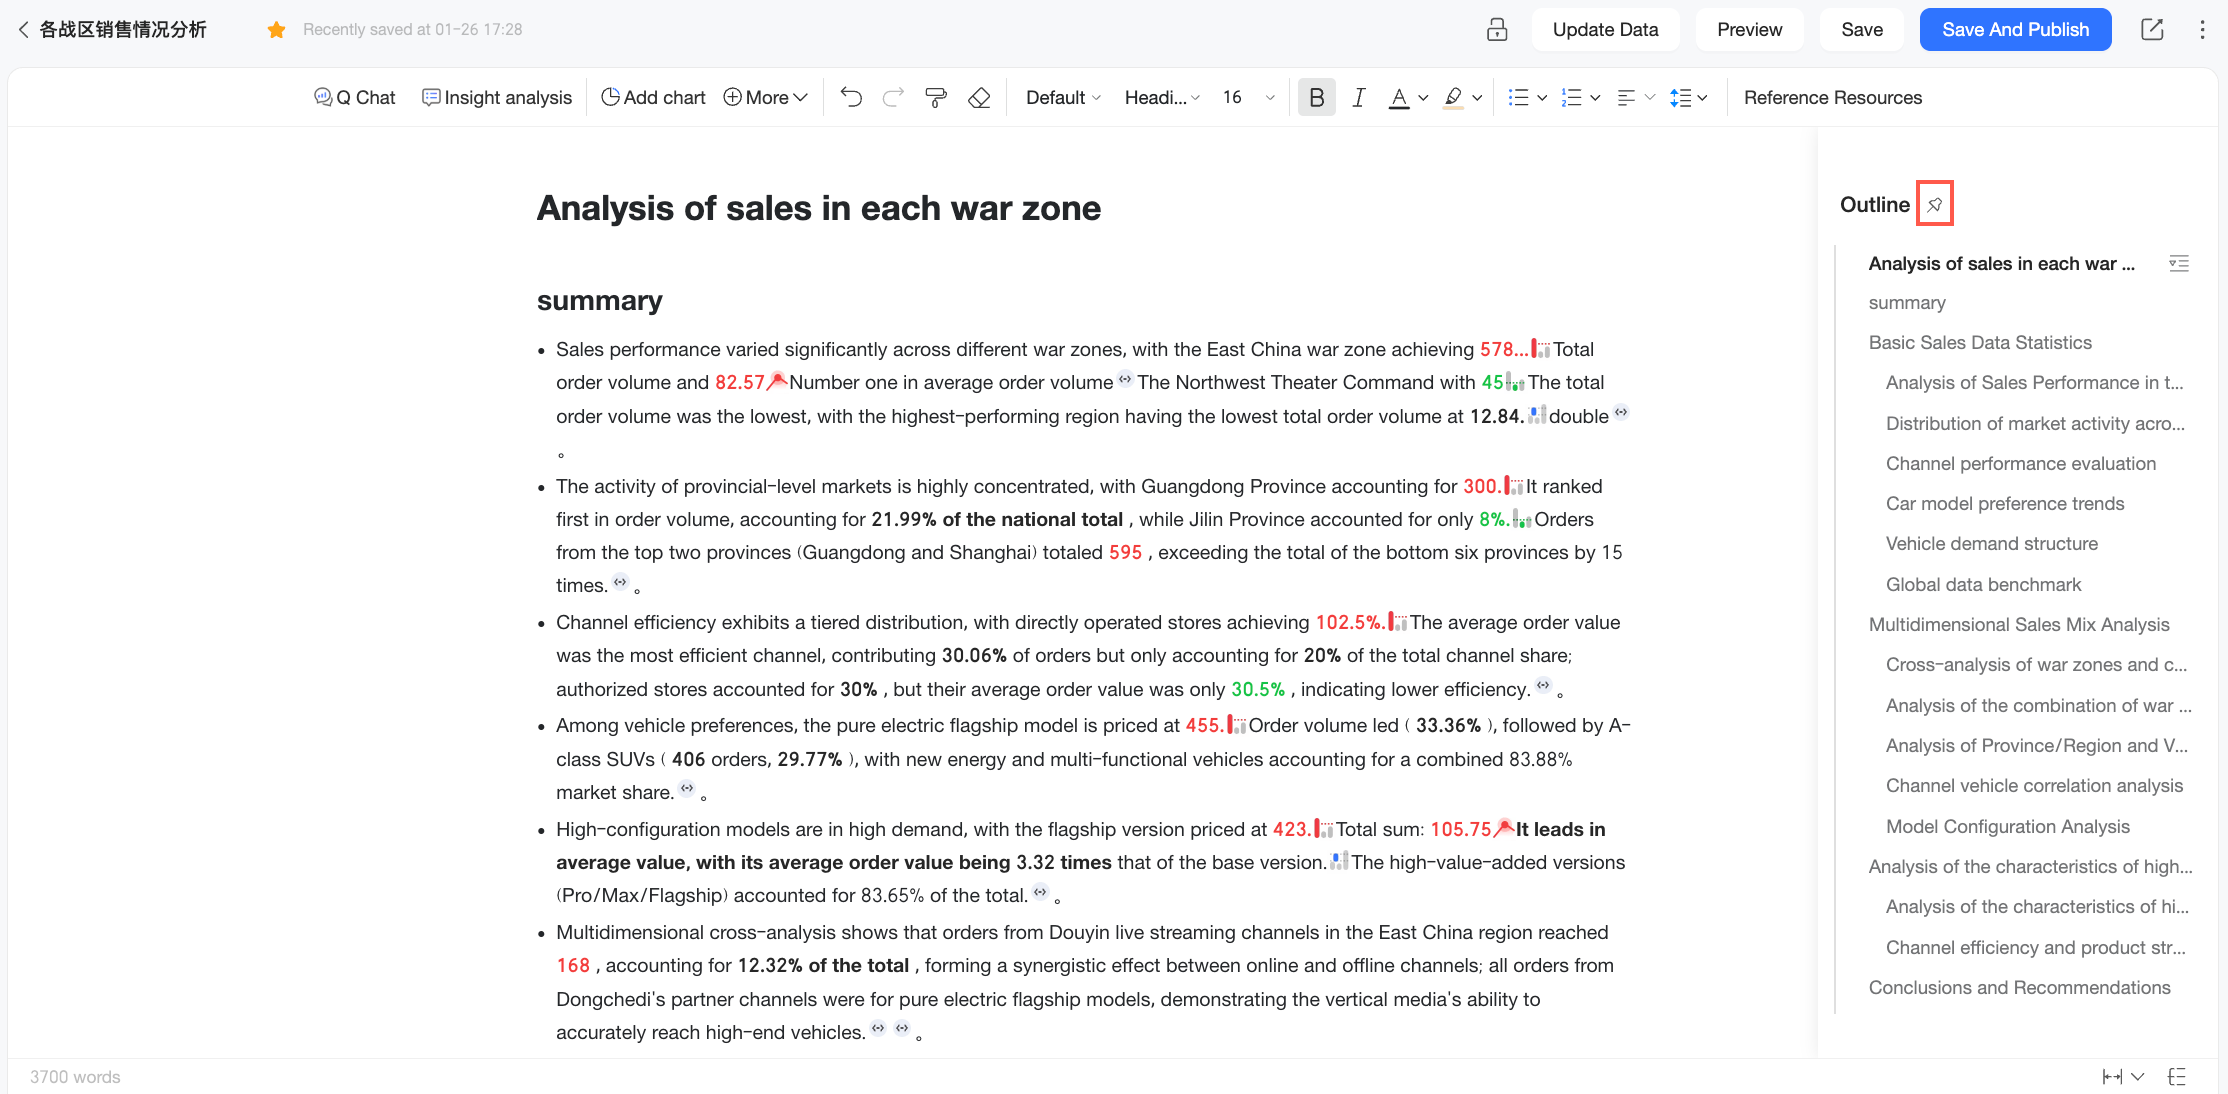
If you need to revise the analysis outline, you can edit the document directly.
Q-Question
After you generate the analysis outline, populate it with data by using the Q-Question feature to ask questions based on a dataset or a data file. Follow these steps:
Before you ask questions based on a dataset, ensure you have Q-Question permissions for the dataset and that it is properly configured. For more information, see Prepare data.
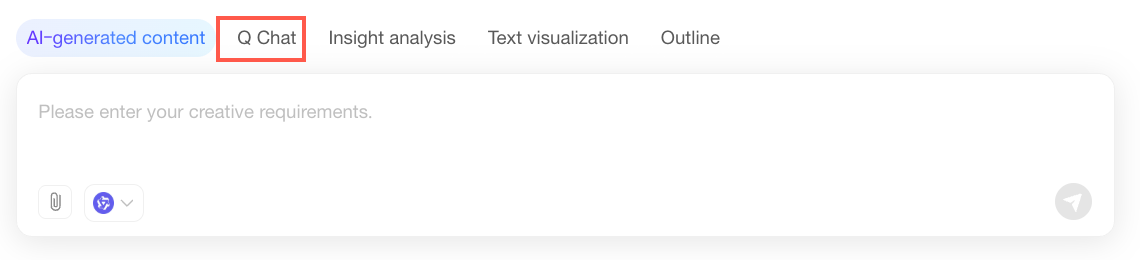
On the Quick BI report editing page, click Q-Question.
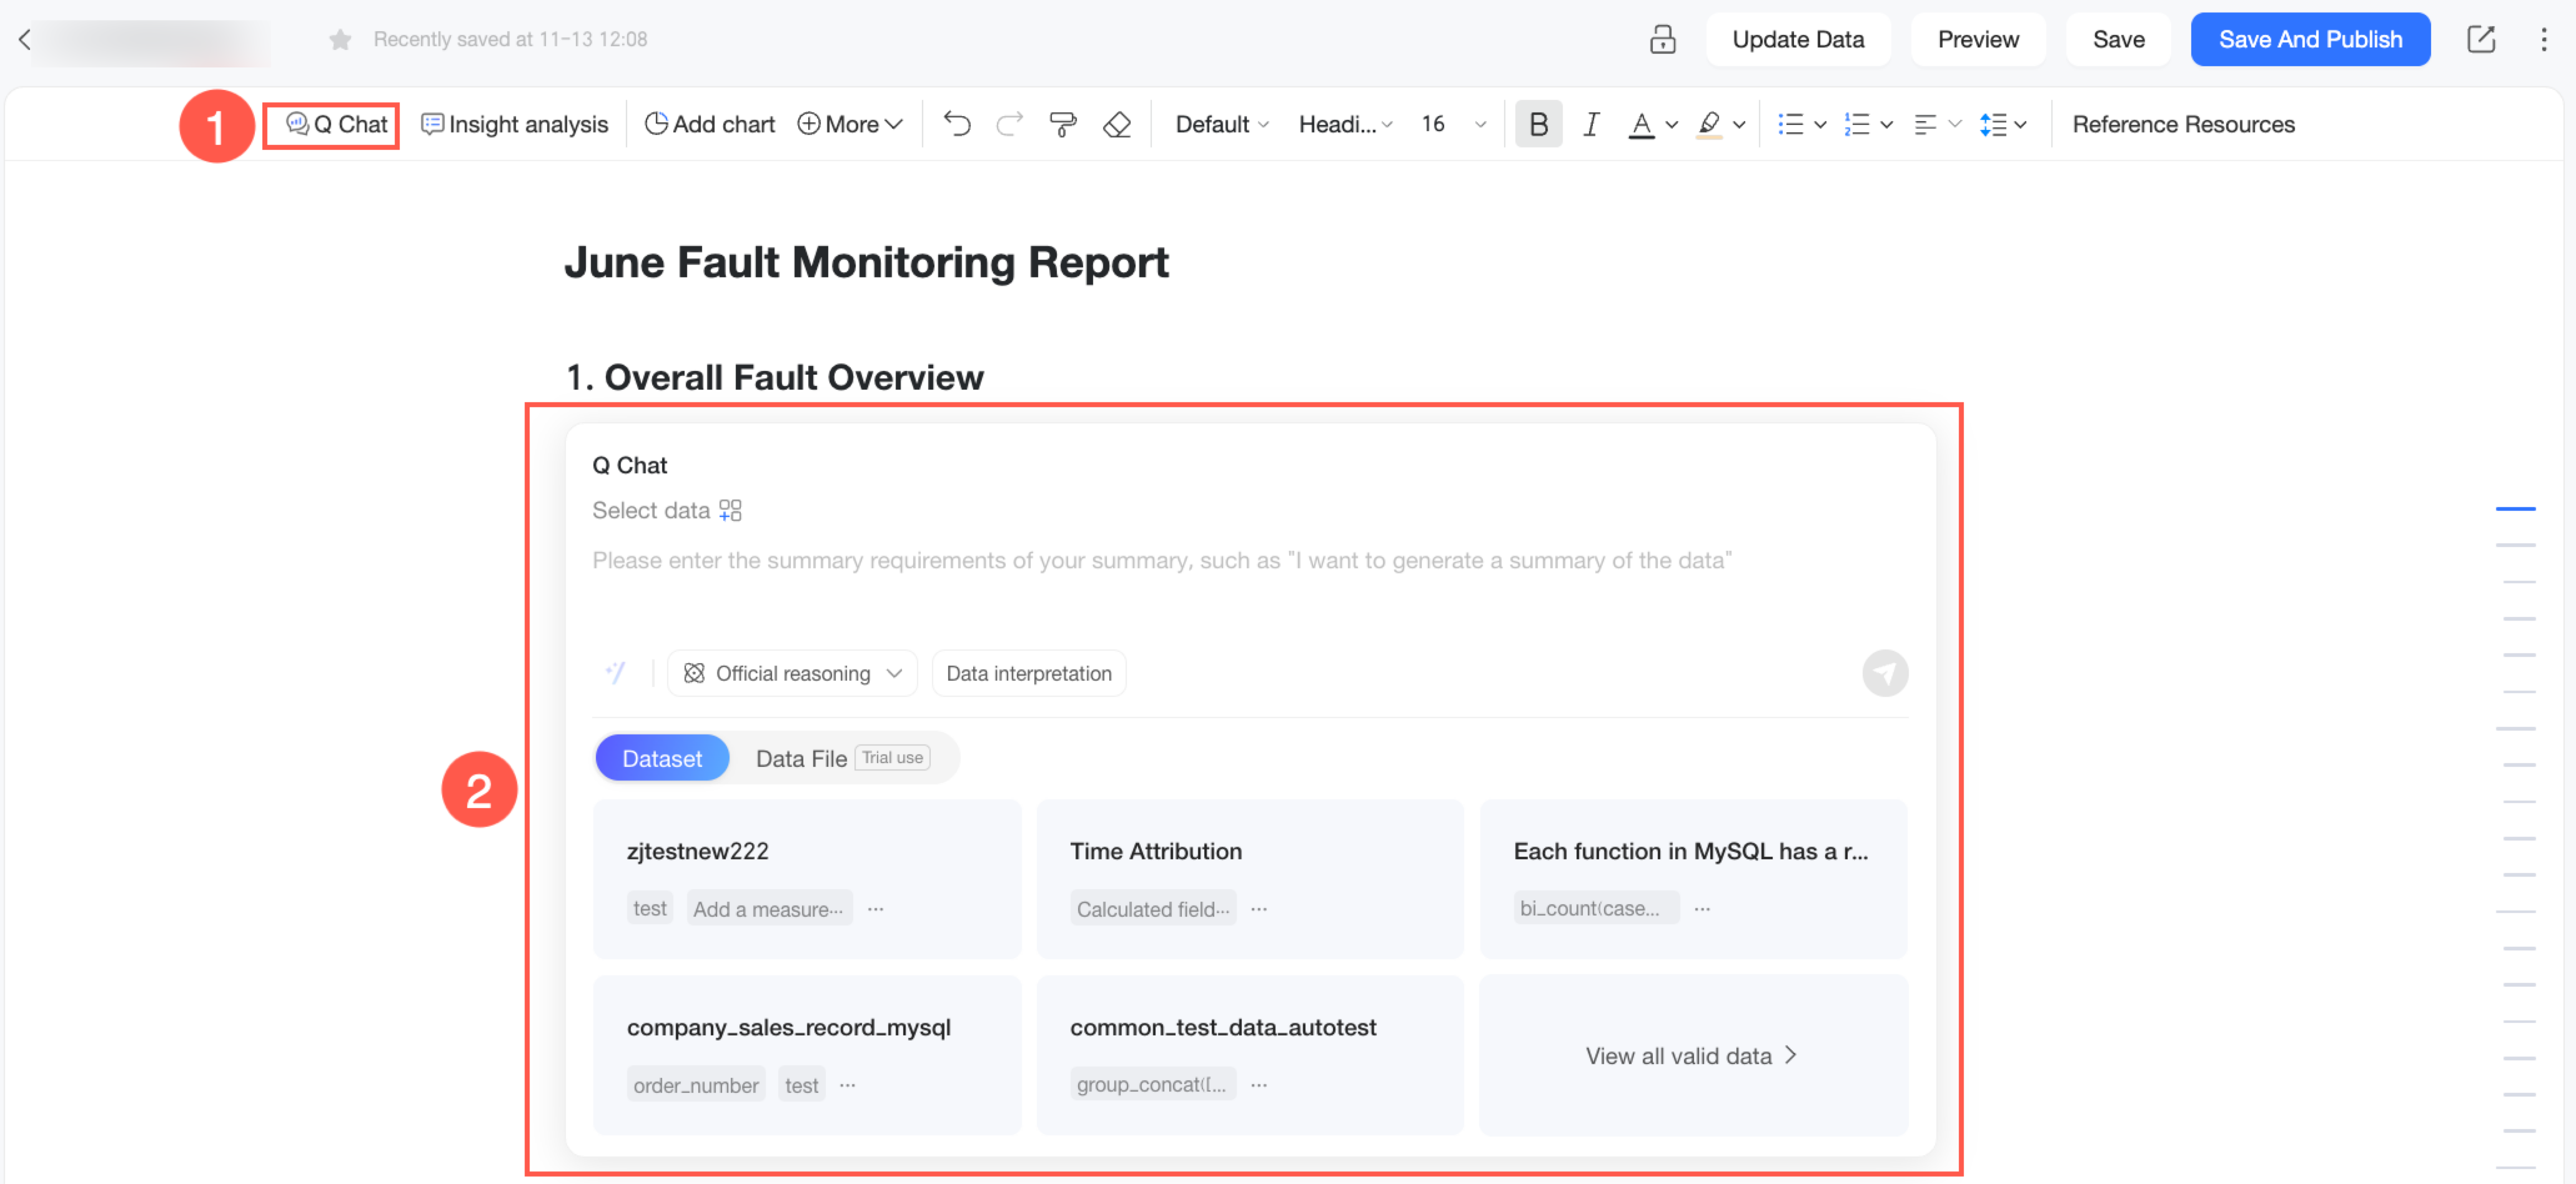
Alternatively, you can first open the AI assistant and then select Q-Question.
In the Q-Question dialog box, select the data that you want to query. You can ask questions based on a dataset or a data file.
Type
Description
Dataset
The Dataset tab displays the datasets that are configured for Q-Question and that you have permission to query.
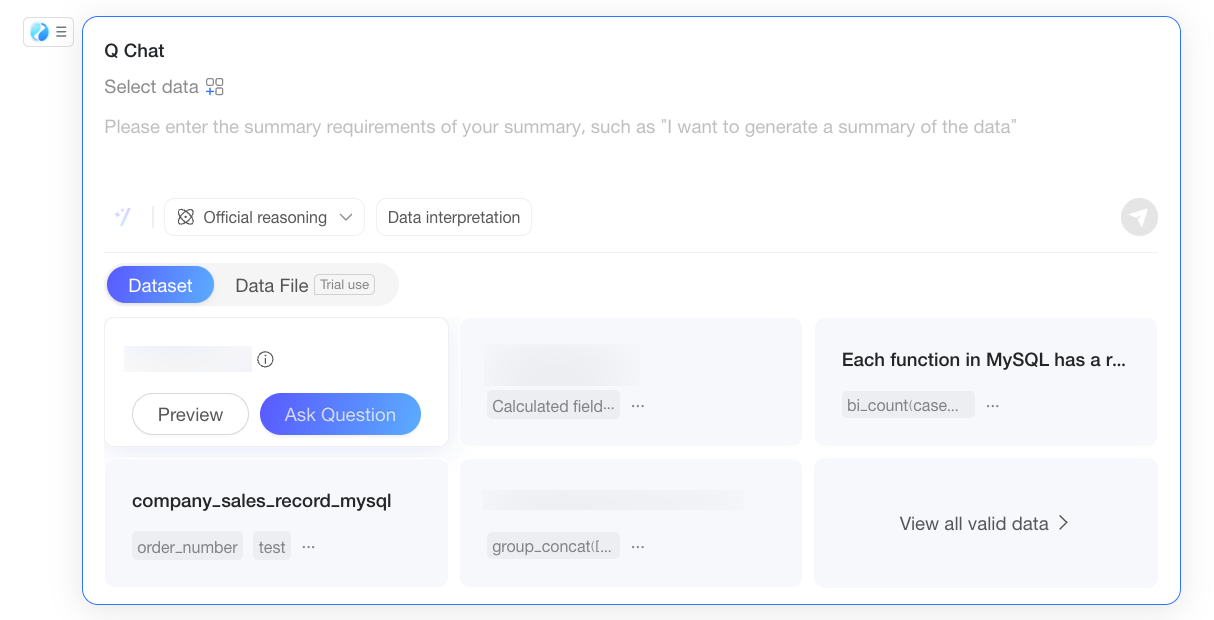
You can perform the following operations:
Preview: Hover over a dataset and click Preview to view its content in a pane on the right. After you confirm the content, you can click Ask in the upper-right corner of the pane to query the dataset.
Ask: Hover over a dataset and click Ask to query the dataset.
View All Available Data: If there are more than five available datasets, they may not all be displayed. Click View All Available Data to view all available datasets and data files in a pane on the right.
Data File
The Data File tab displays the data files you have uploaded through any Q-Question entry point in Quick BI.
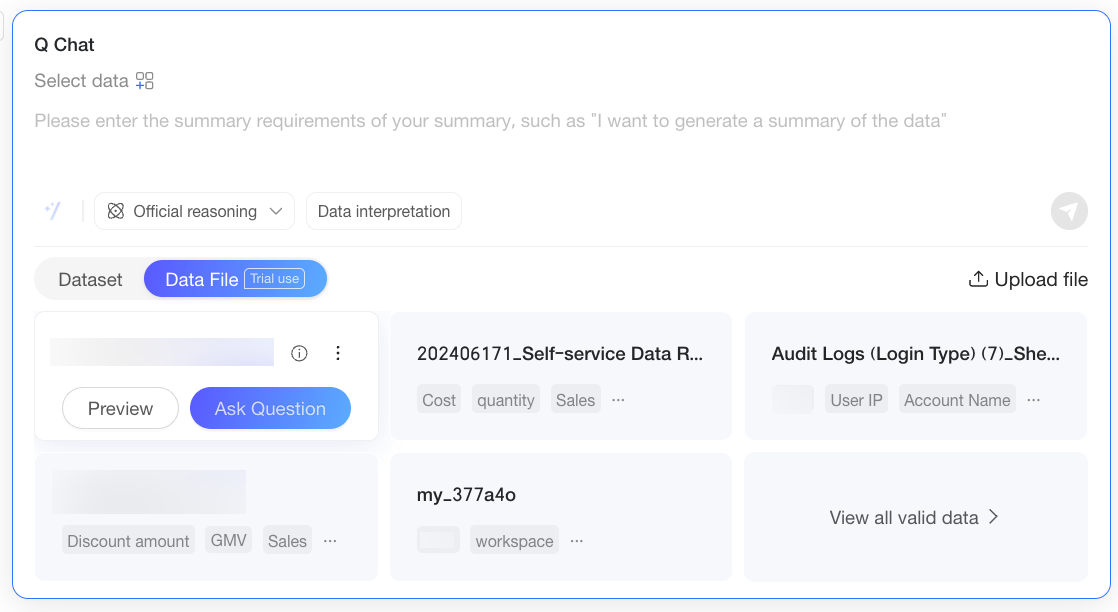
You can perform the following operations:
Preview: Hover over a data file and click Preview to view its content in a pane on the right. After you confirm the content, you can click Ask in the upper-right corner of the pane to query the data file.
Ask: Hover over a data file and click Ask to query the data file.
View All Available Data: If there are more than five available data files, they may not all be displayed. Click View All Available Data to view all available data files and datasets in a pane on the right.
Upload File: If the data file you want to query is not in the list, you can upload it in one of the following two ways:
In the current Q-Question dialog box, click Upload File in the upper-right corner. In the File Upload dialog box that appears, upload the file. For more information, see Upload a data file.
In the Data File pane, click Upload File in the upper-right corner to open the File Upload dialog box. For more information, see Upload a data file.
NoteThe following limits apply to uploaded data files:
Only data files in CSV and XLSX formats are supported. Currently, only the first sheet is parsed.
By default, the system identifies the first row of the data file as the header row and begins reading the data content from the second row.
The size of a single uploaded file cannot exceed 10 MB.
Uploaded files are associated with your account and can be reused across your reports. For example, if you upload a file in Report A, it is available in the Q-Question interface of Report B without needing to be re-uploaded.
Configure: After uploading a file, if you want to modify its configuration, such as the file name or field types, hover over the data file, click the
 icon in the upper-right corner of its card, and select Configure. In the Data File Configuration dialog box, you can perform operations such as Edit Display Name (①), Preview Data Content (②), Change Field Type (③), Edit Field Name (④), and View Field Details (⑤).
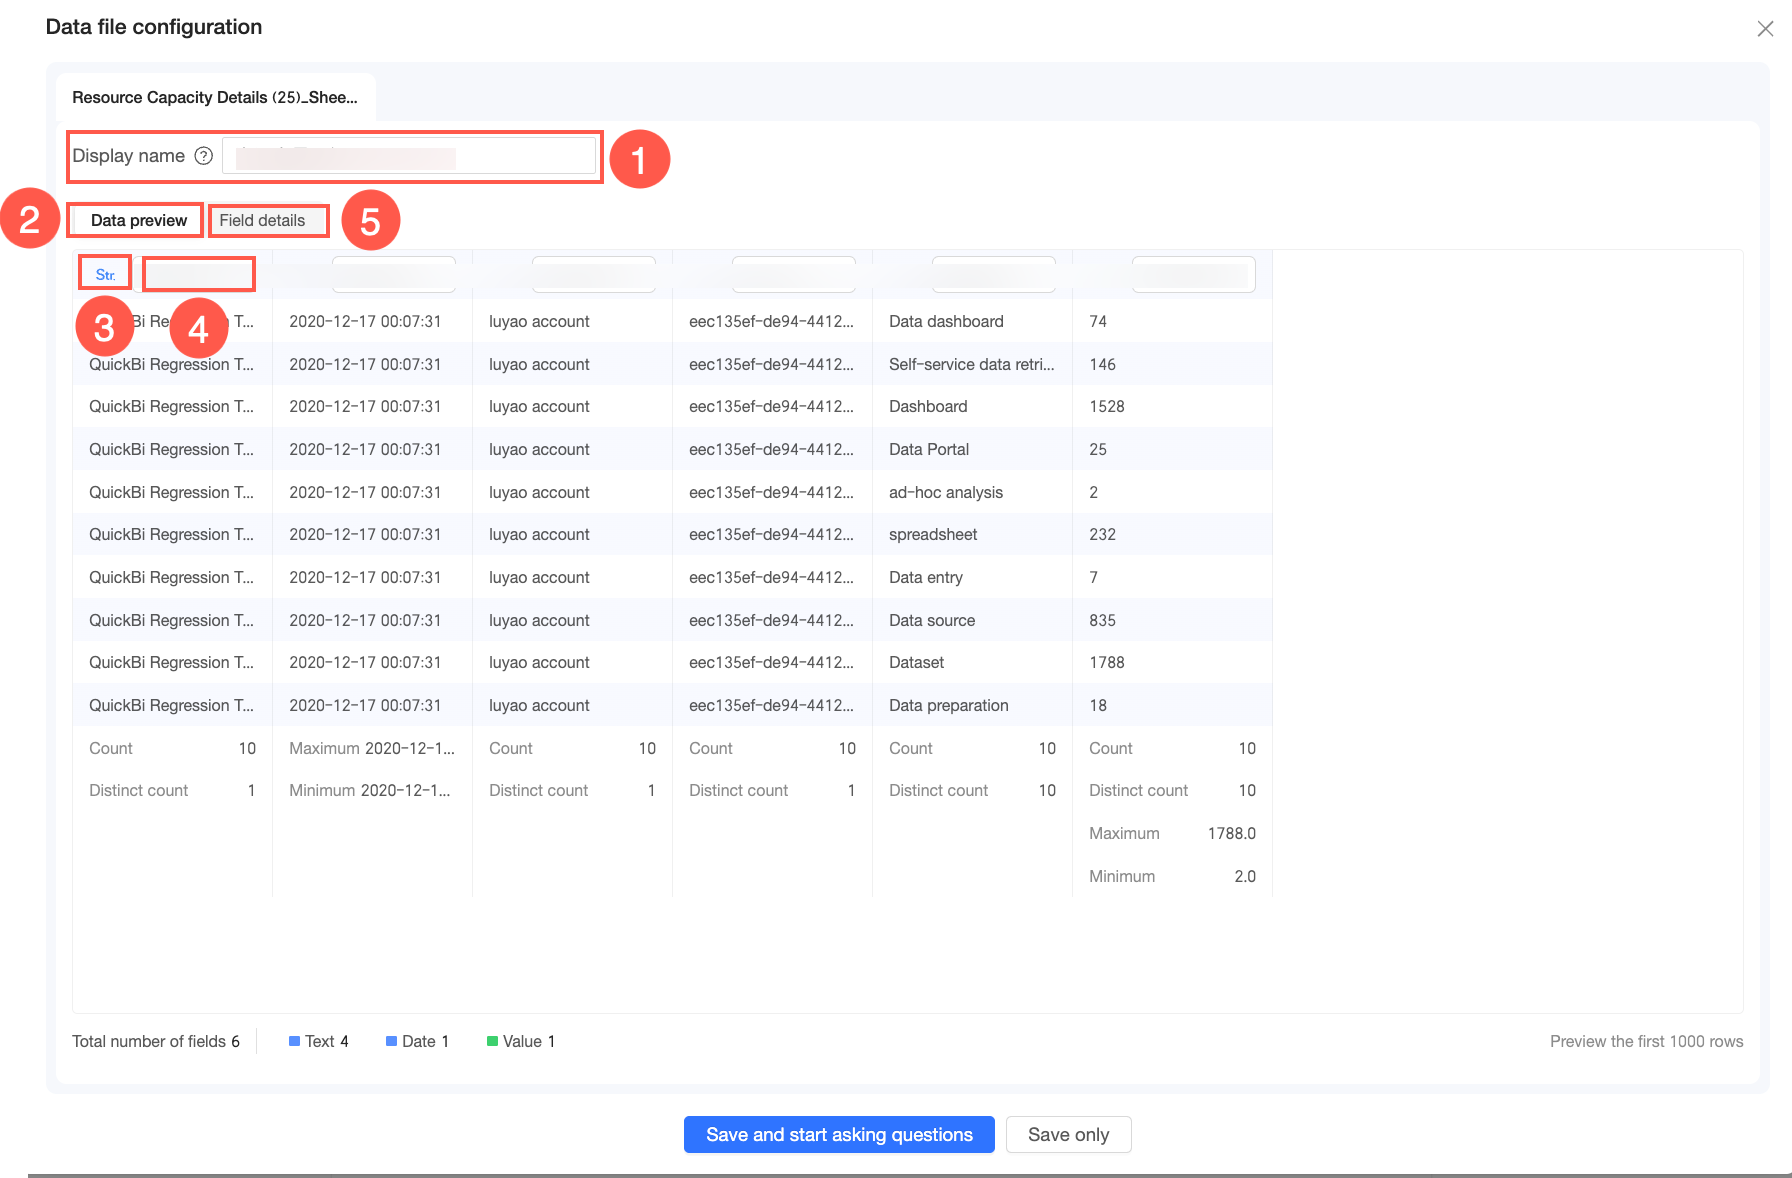
Delete: When you no longer need a data file, hover over it, click the
icon in the upper-right corner of its card, and select Delete. In the confirmation dialog box, click OK to delete the data file.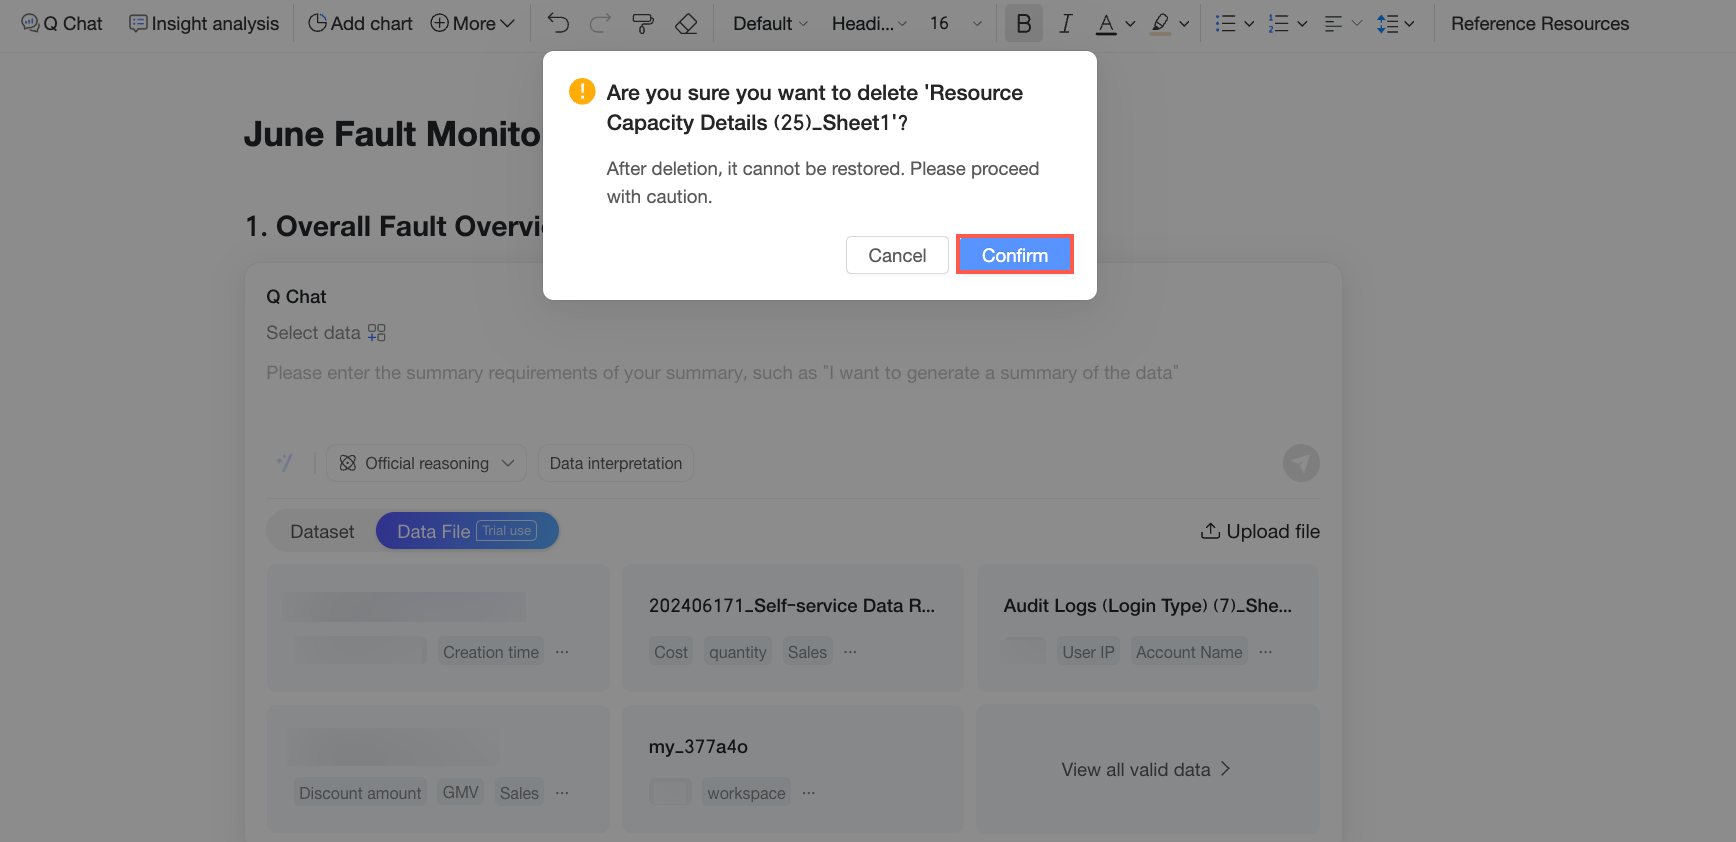
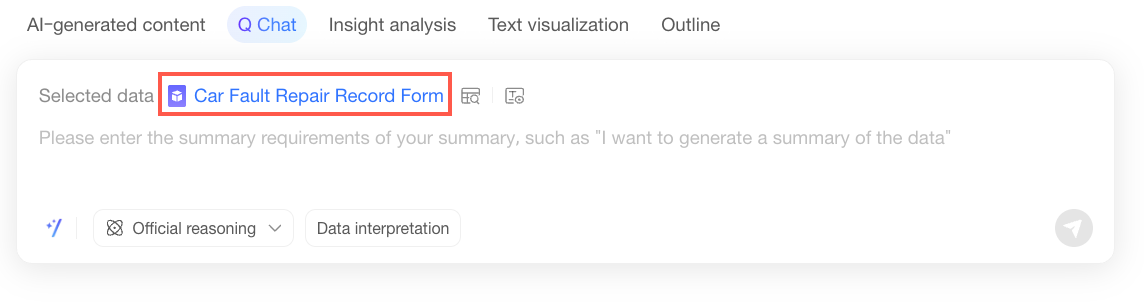
After selecting a dataset or data file in the Q-Question dialog box, you can start asking questions. In this example, the Car Failure and Maintenance Records dataset is selected.
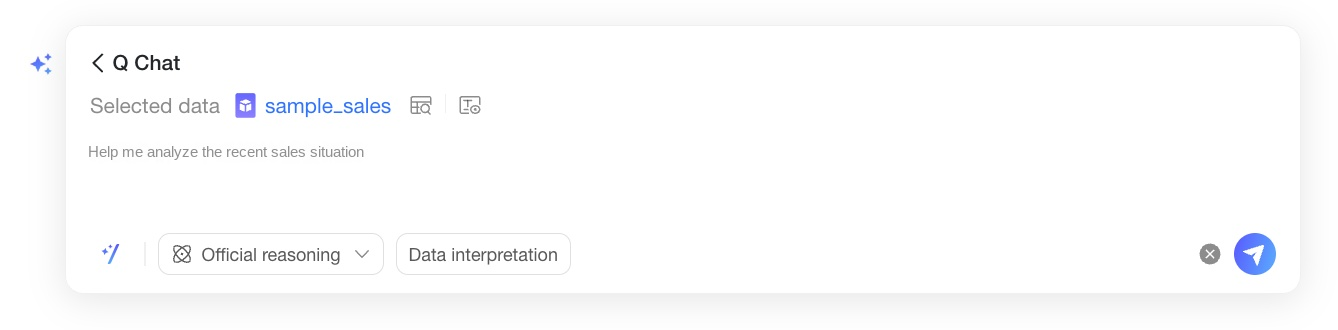
In the Q-Question dialog box, enter a custom question.
You can also click the
 icon to open the Quick Question dialog box. Here, you can select a question type that fits your needs to quickly ask a question. You can also select an inference and interpretation method.
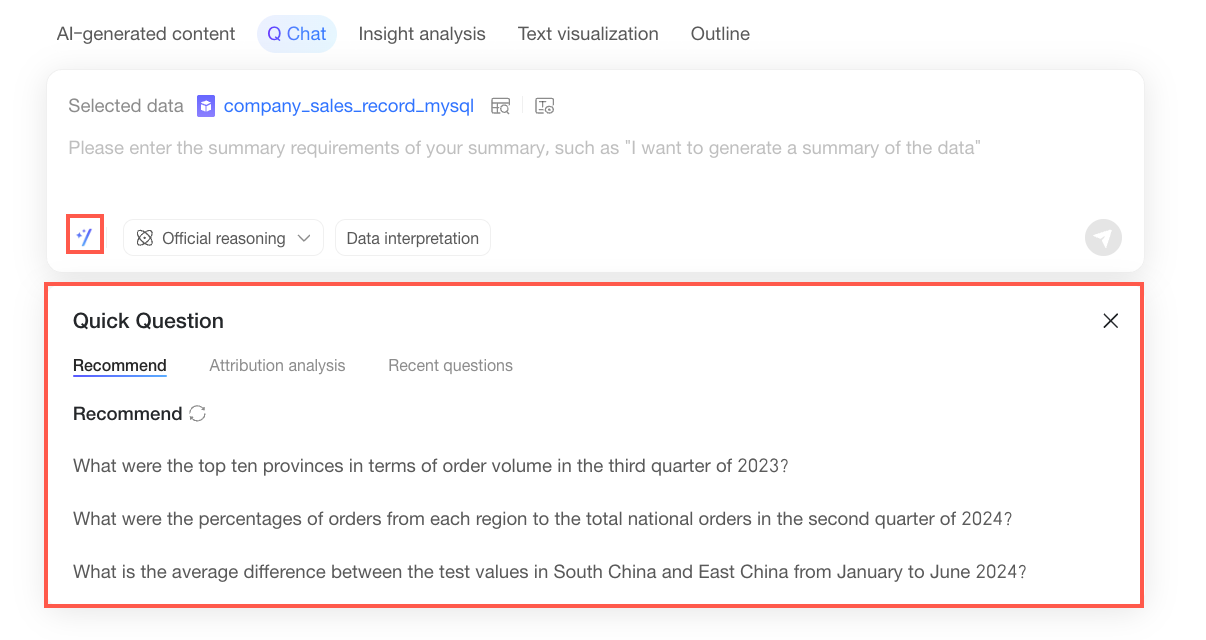
Question type
Description
Recommended
When you query a dataset, the Recommended tab in Quick Question automatically suggests high-frequency or valuable questions based on the selected dataset and common analysis scenarios. You can click a question to ask it directly.
If the recommended questions do not meet your needs, click the
 icon to get a new set of recommendations.
Q-Insight
When you query a dataset, you can use the Q-Insight tab to perform multi-dimensional, multi-step root cause analysis on metric changes in the dataset. The system generates a Q-Insight component to help you quickly identify the key drivers of business fluctuations.
Click a question template under Q-Insight to insert the Q-Insight component settings into the input box. You must then configure the Comparison Period and Comparison Metric.
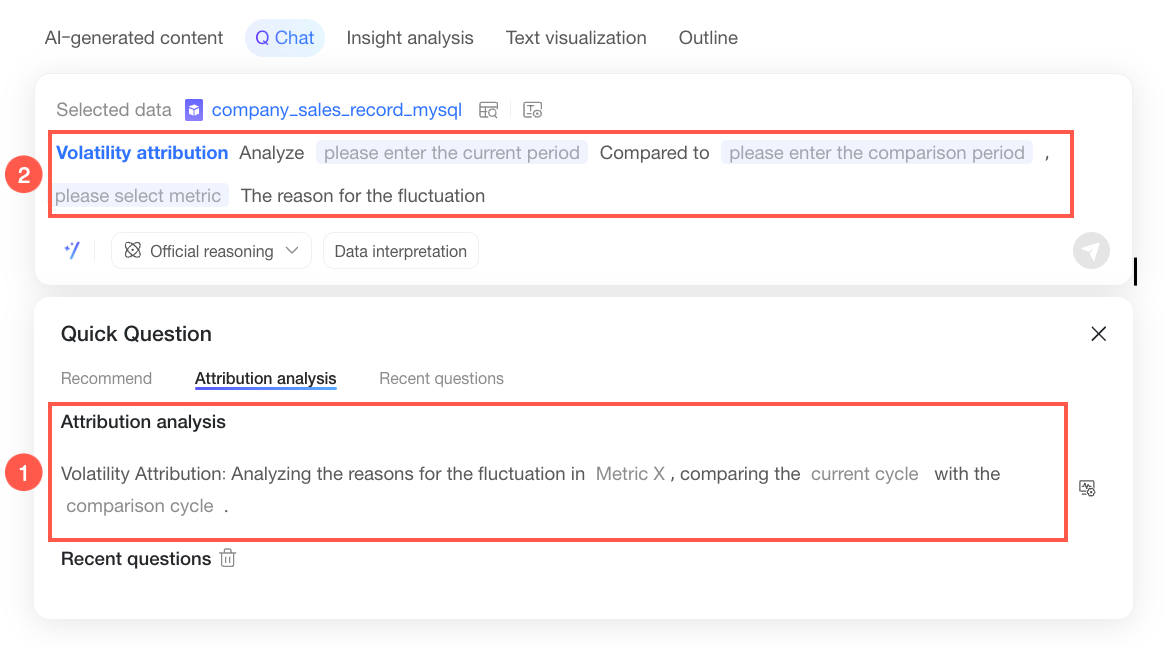
You can also click the
 icon next to a question template to enter the Q-Insight component settings in the attribution report settings dialog box.
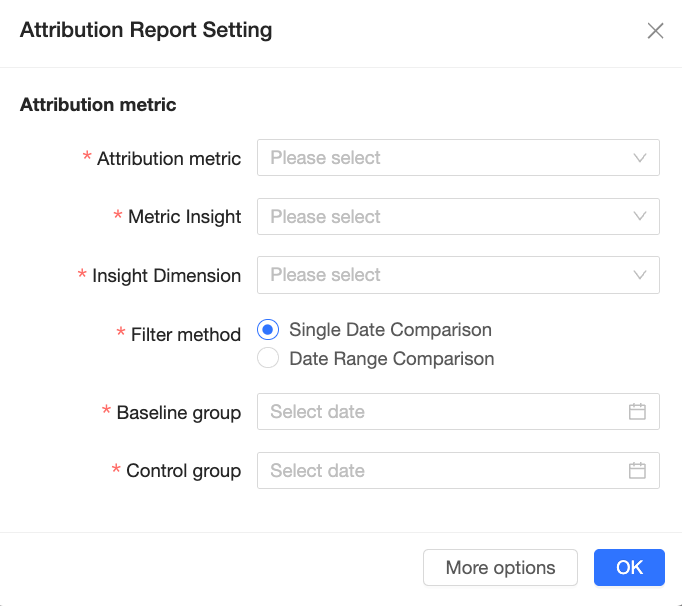 Note
NoteQ-Insight is a value-added module that requires a separate purchase.
For information about the prerequisites for using the Q-Insight feature, see Configure analysis methods and Configure report templates. For information about the parameters and usage of the Q-Insight feature, see Use Q-Insight.
Recent questions
The Recent Questions tab displays the previous questions you have asked based on the selected data resource. You can click a question to ask it again.
After you enter a question, click the
 icon in the lower-right corner of the dialog box or press Enter to get the analysis result.
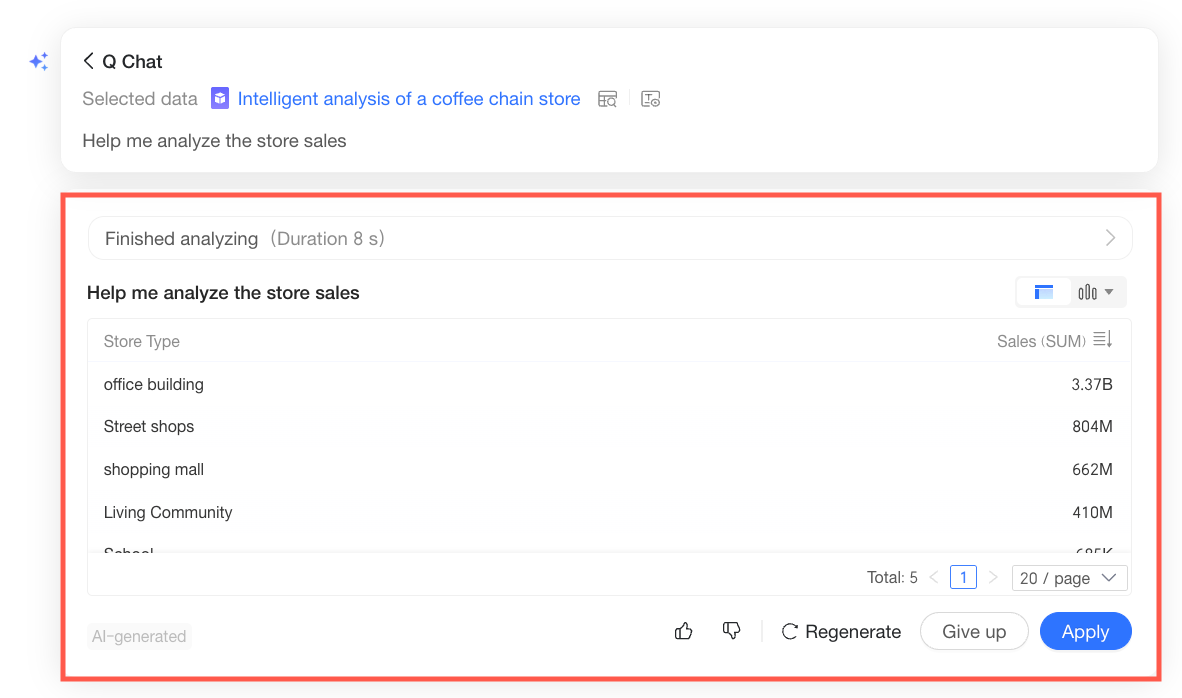
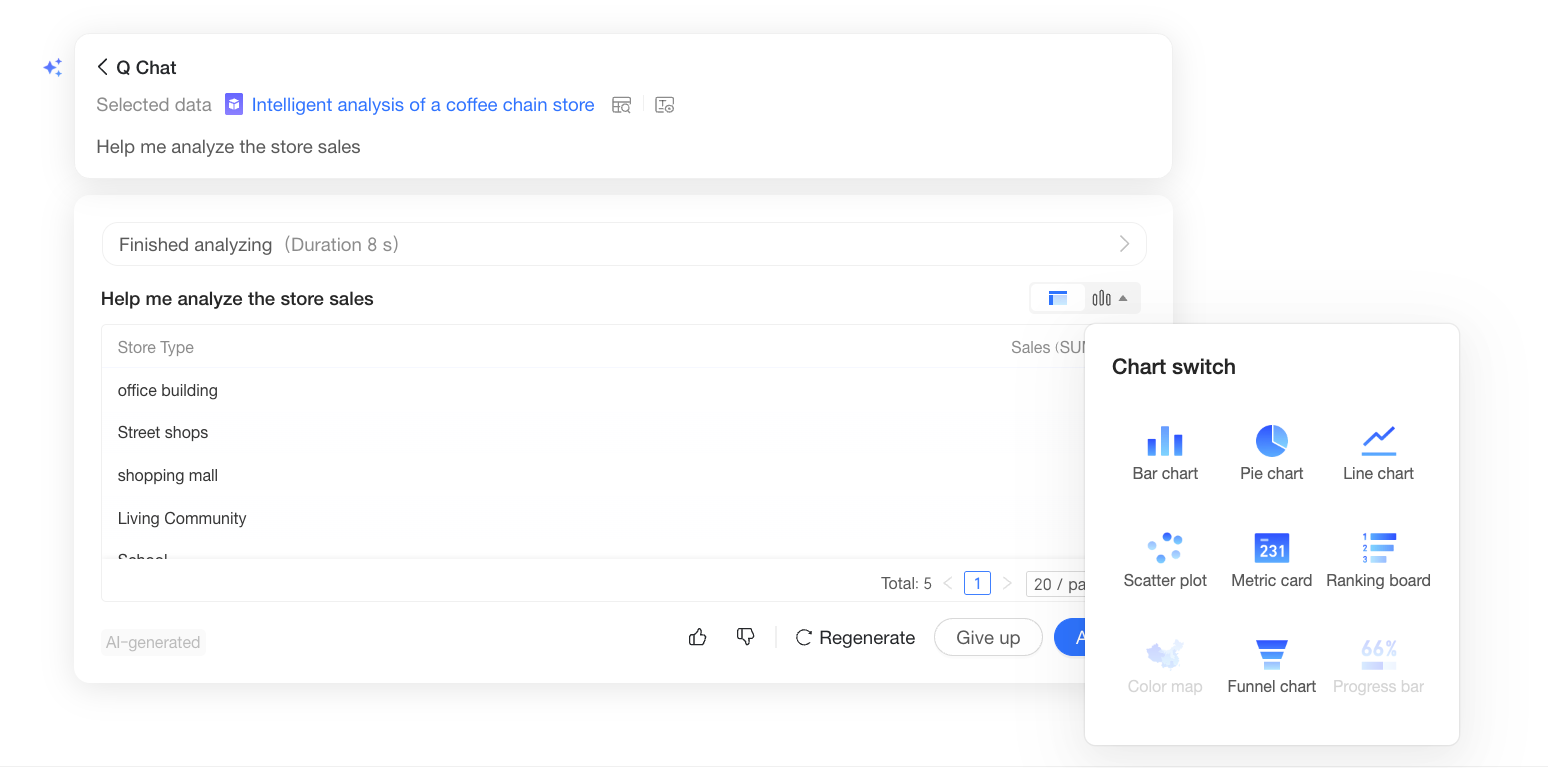
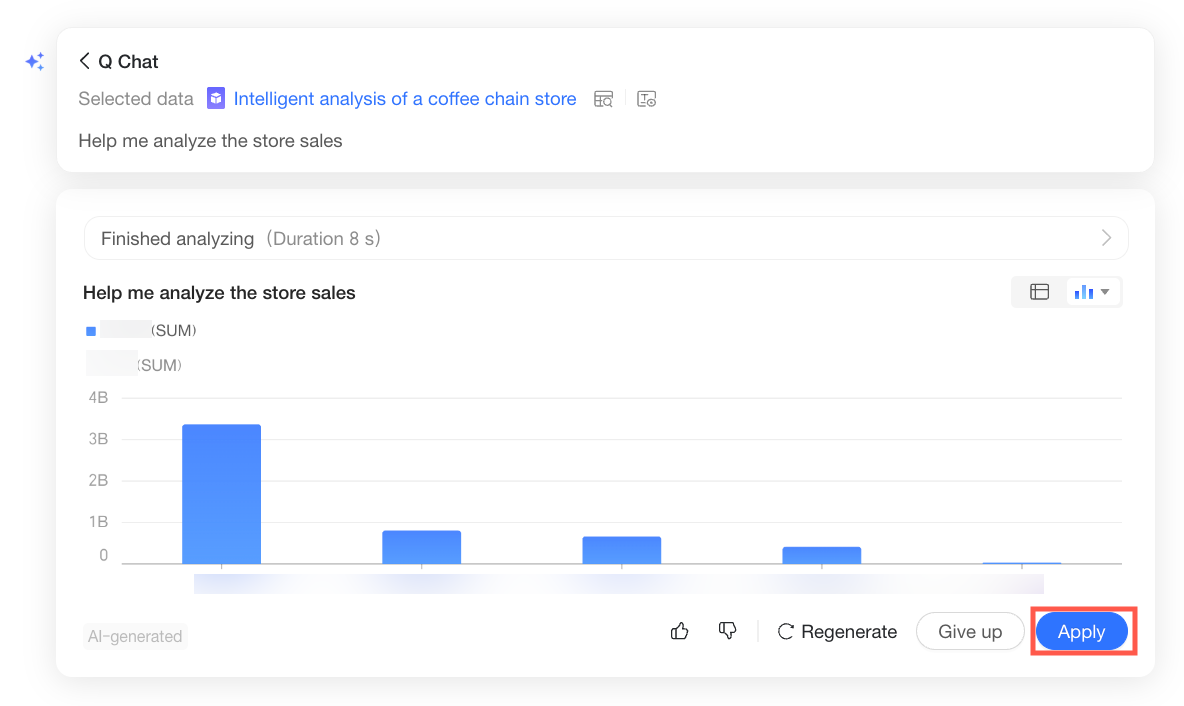
If you are not satisfied with the generated chart, you can change the chart type.
Below the generated Q-Question result, you can perform the following operations: Like/Dislike, Regenerate, Discard, and Apply.
When the generated result meets your expectations, click Apply to add the Q-Question result to the Quick BI report.
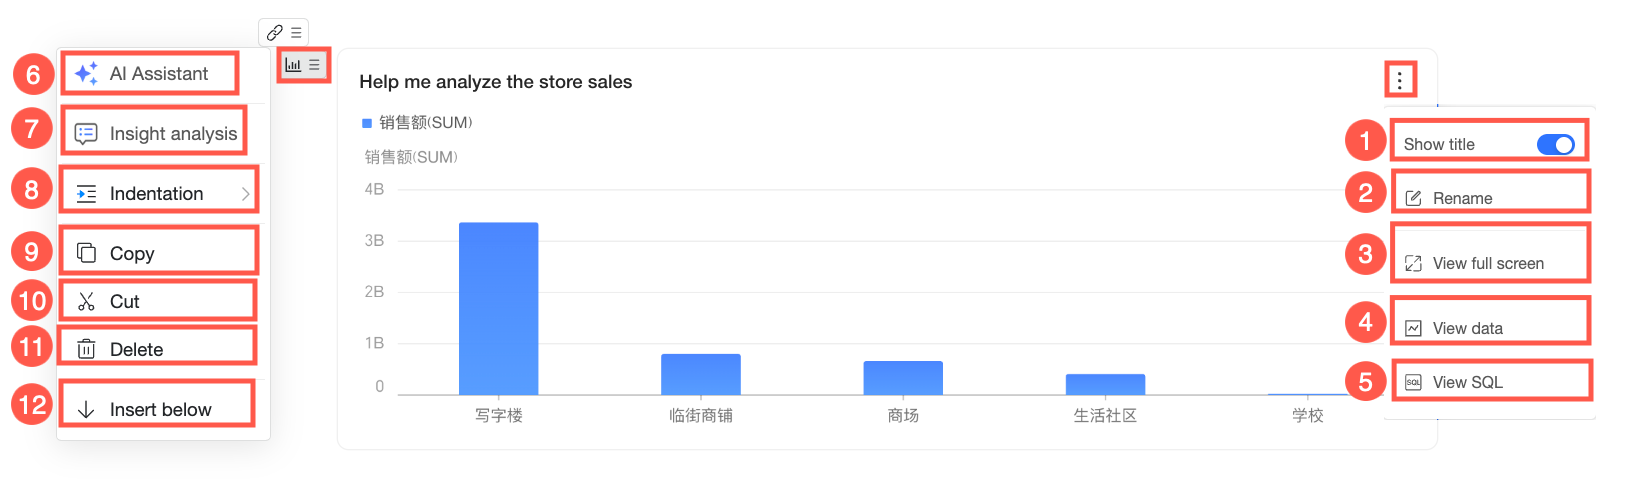
Once you add a chart from Q-Question to the report, you can perform the following operations on it.
No.
Actions
Description
①
Show title
Turn on this switch to display the chart title in the upper-left corner. Turn it off to hide the title.
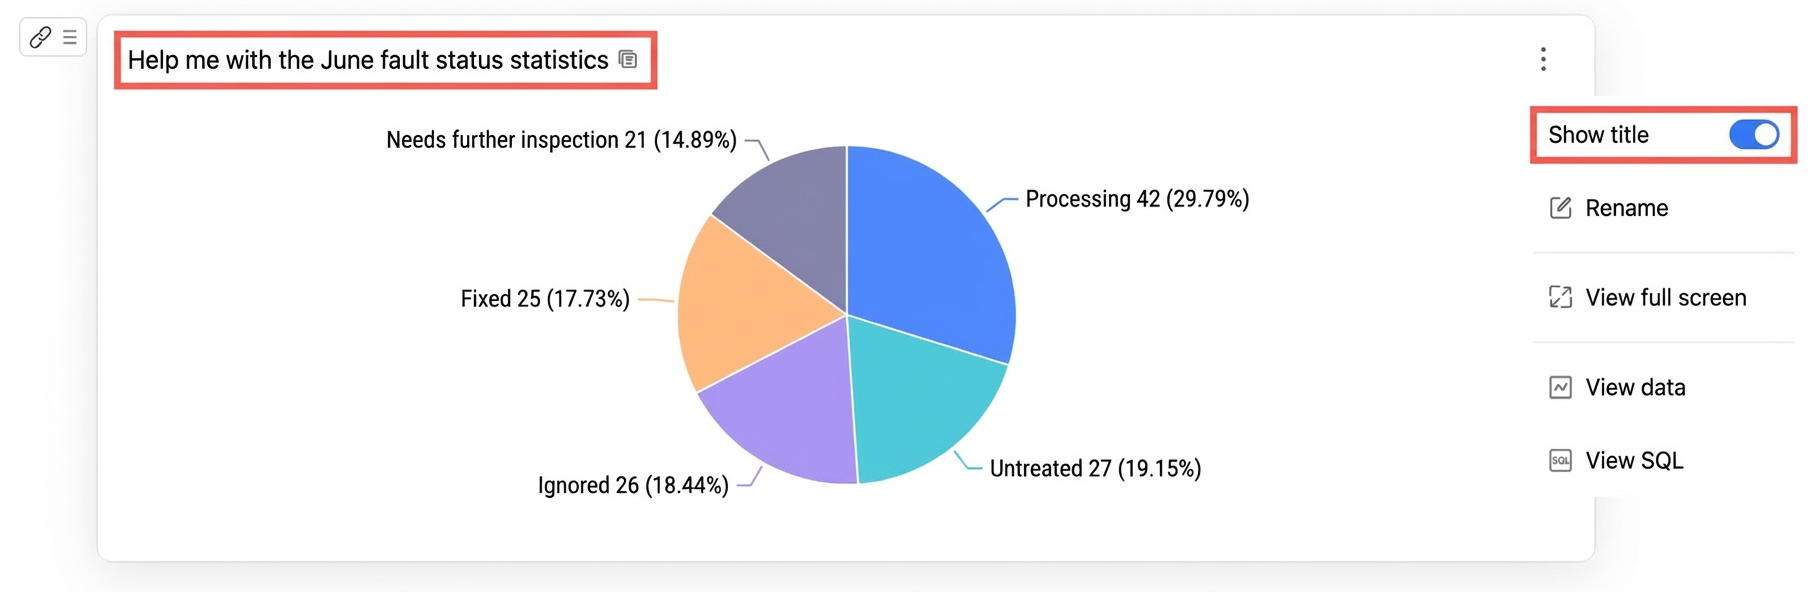
②
Rename
Double-click the title or click the Rename button to rename the chart.
③
Full screen view
View the chart in full screen.
Click Exit Full Screen in the upper-right corner to exit.
④
View data
Displays the underlying data for the chart. You can view formatted data and raw data. Click Copy Data at the bottom of the pane to copy all data in the table to the clipboard.
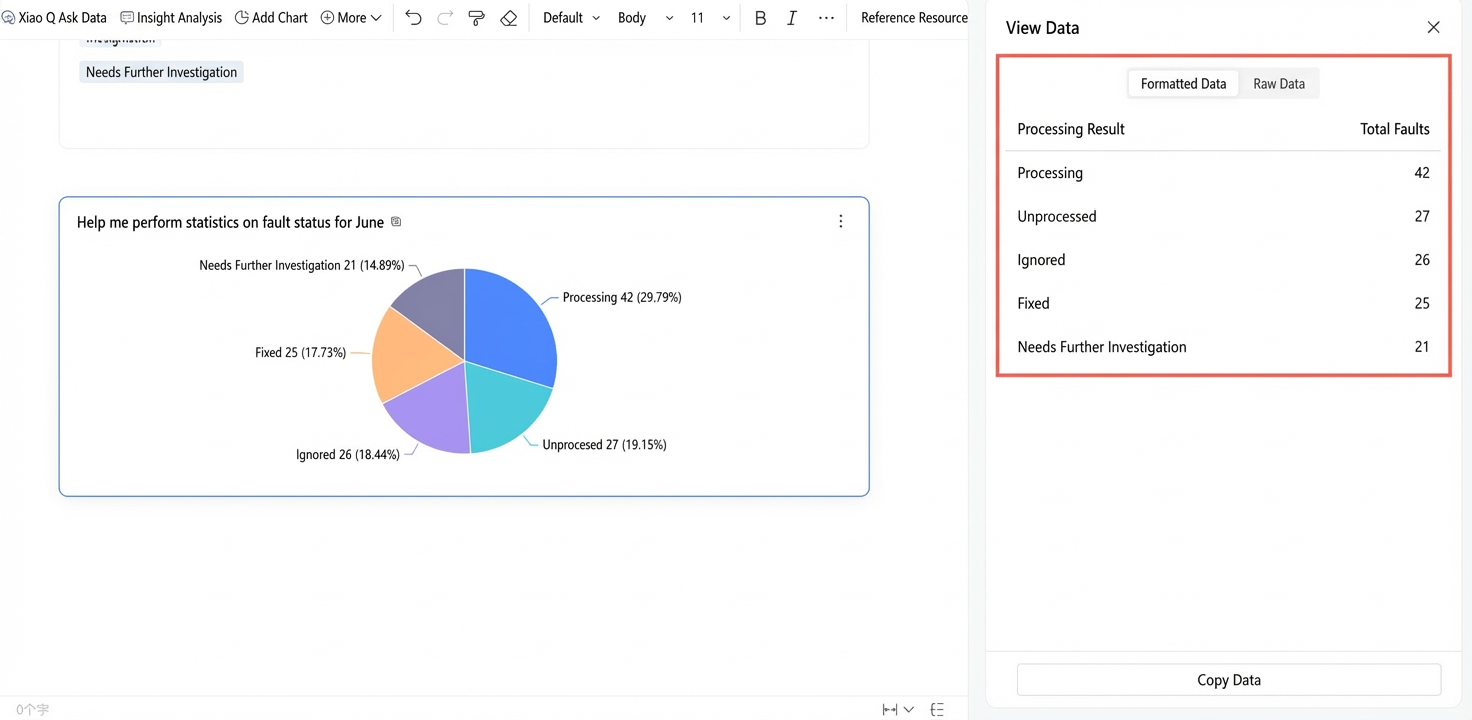 Note
NoteThe View Data feature is available only for non-table charts. This feature is not available for crosstabs, detail tables, trend analysis tables, multi-dimensional analysis tables, or heat maps.
⑤
View SQL
Click to view the underlying query statement for the chart in the SQL dialog box, which is useful for verifying data logic.
⑥
AI assistant
Open the AI assistant to perform operations such as intelligent questioning and insight analysis. For more information, see In-report AI Assistant.
⑦
Insight analysis
Interpret the data of the chart component and generate an insight analysis report. For more information, see insight analysis.
⑧
Indent
Increase or decrease the indentation. The following figure shows the effect:
⑨
Copy
Copy the current chart. The system copies all chart information. You can then paste it to quickly create an identical copy of the chart elsewhere in the report.
⑩
Cut
Remove the chart from its current location and save it to the clipboard. You can then paste it to move the chart to a new location in the report.
⑪
Delete
Delete the current chart.
⑫
Insert below
Insert other content below the paragraph where the chart is located.
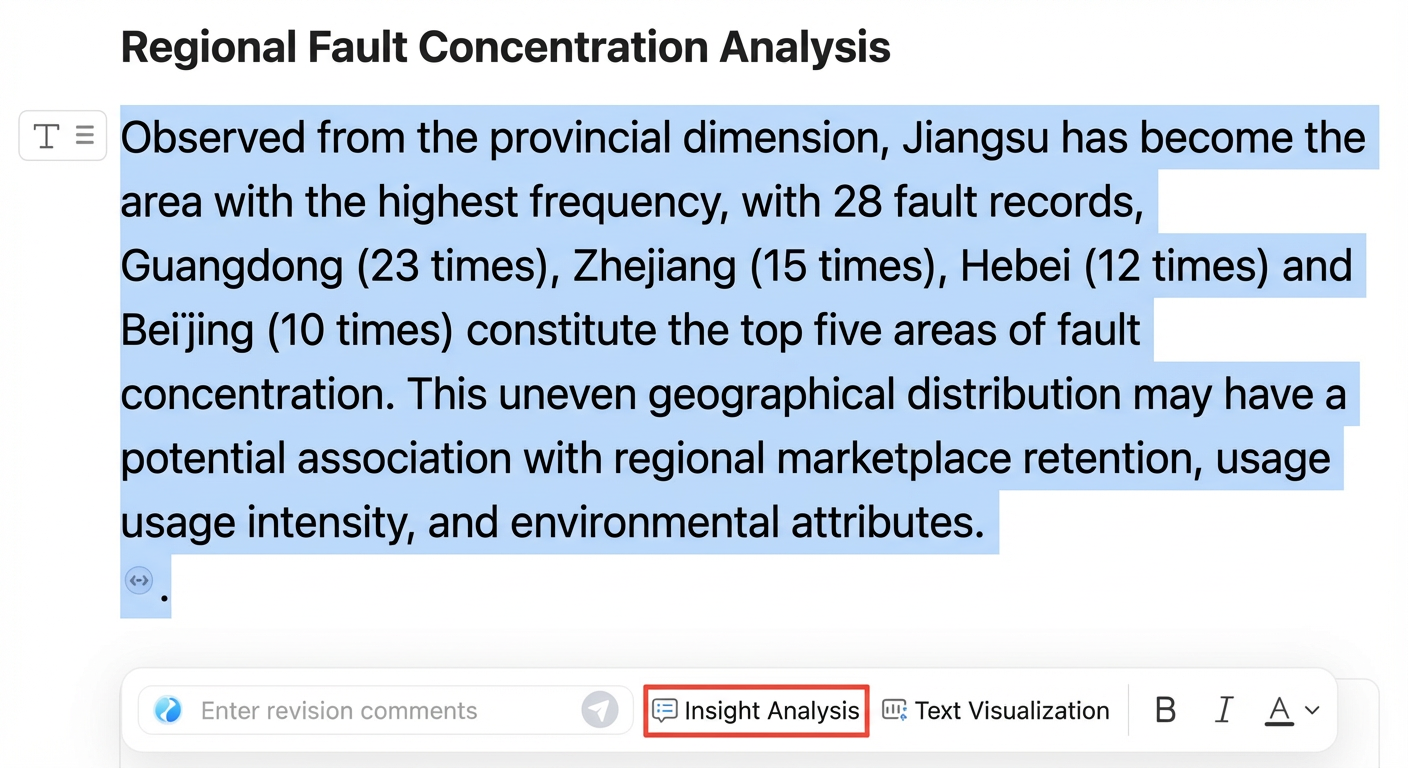
Insight Analysis
After you generate a result with Q-Question, you can perform an insight analysis on the result or other content. Follow these steps:
Hover over the chart generated by Q-Question, click the
 icon, and select Insight Analysis.
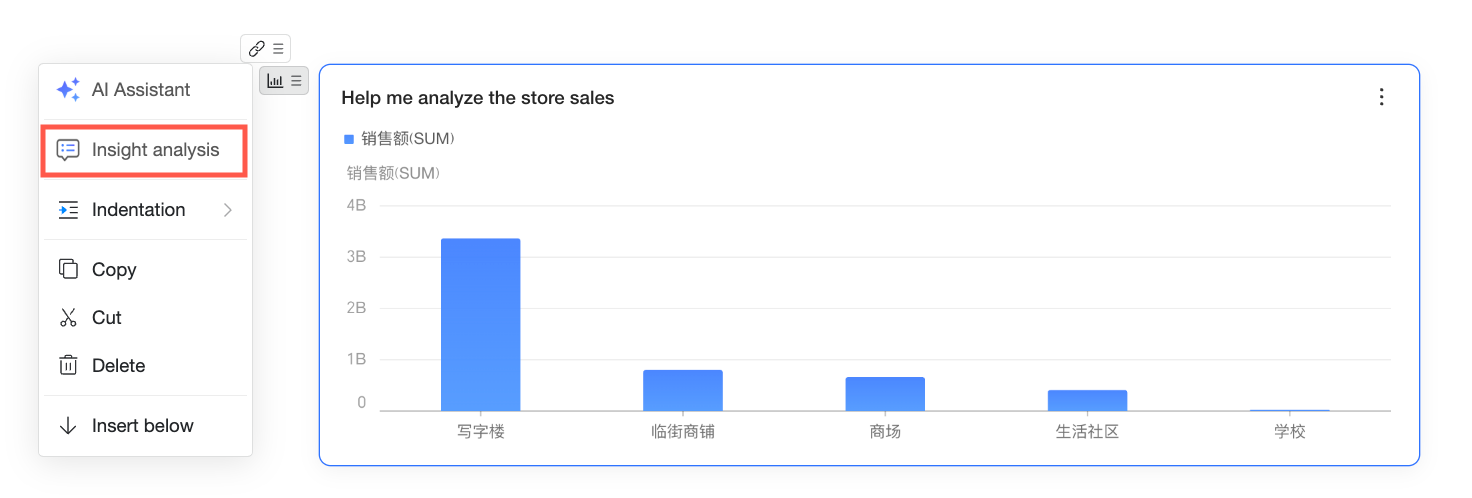 You can also open the AI assistant and select Insight Analysis, or directly click Insight Analysis in the upper-left corner of the editing page.
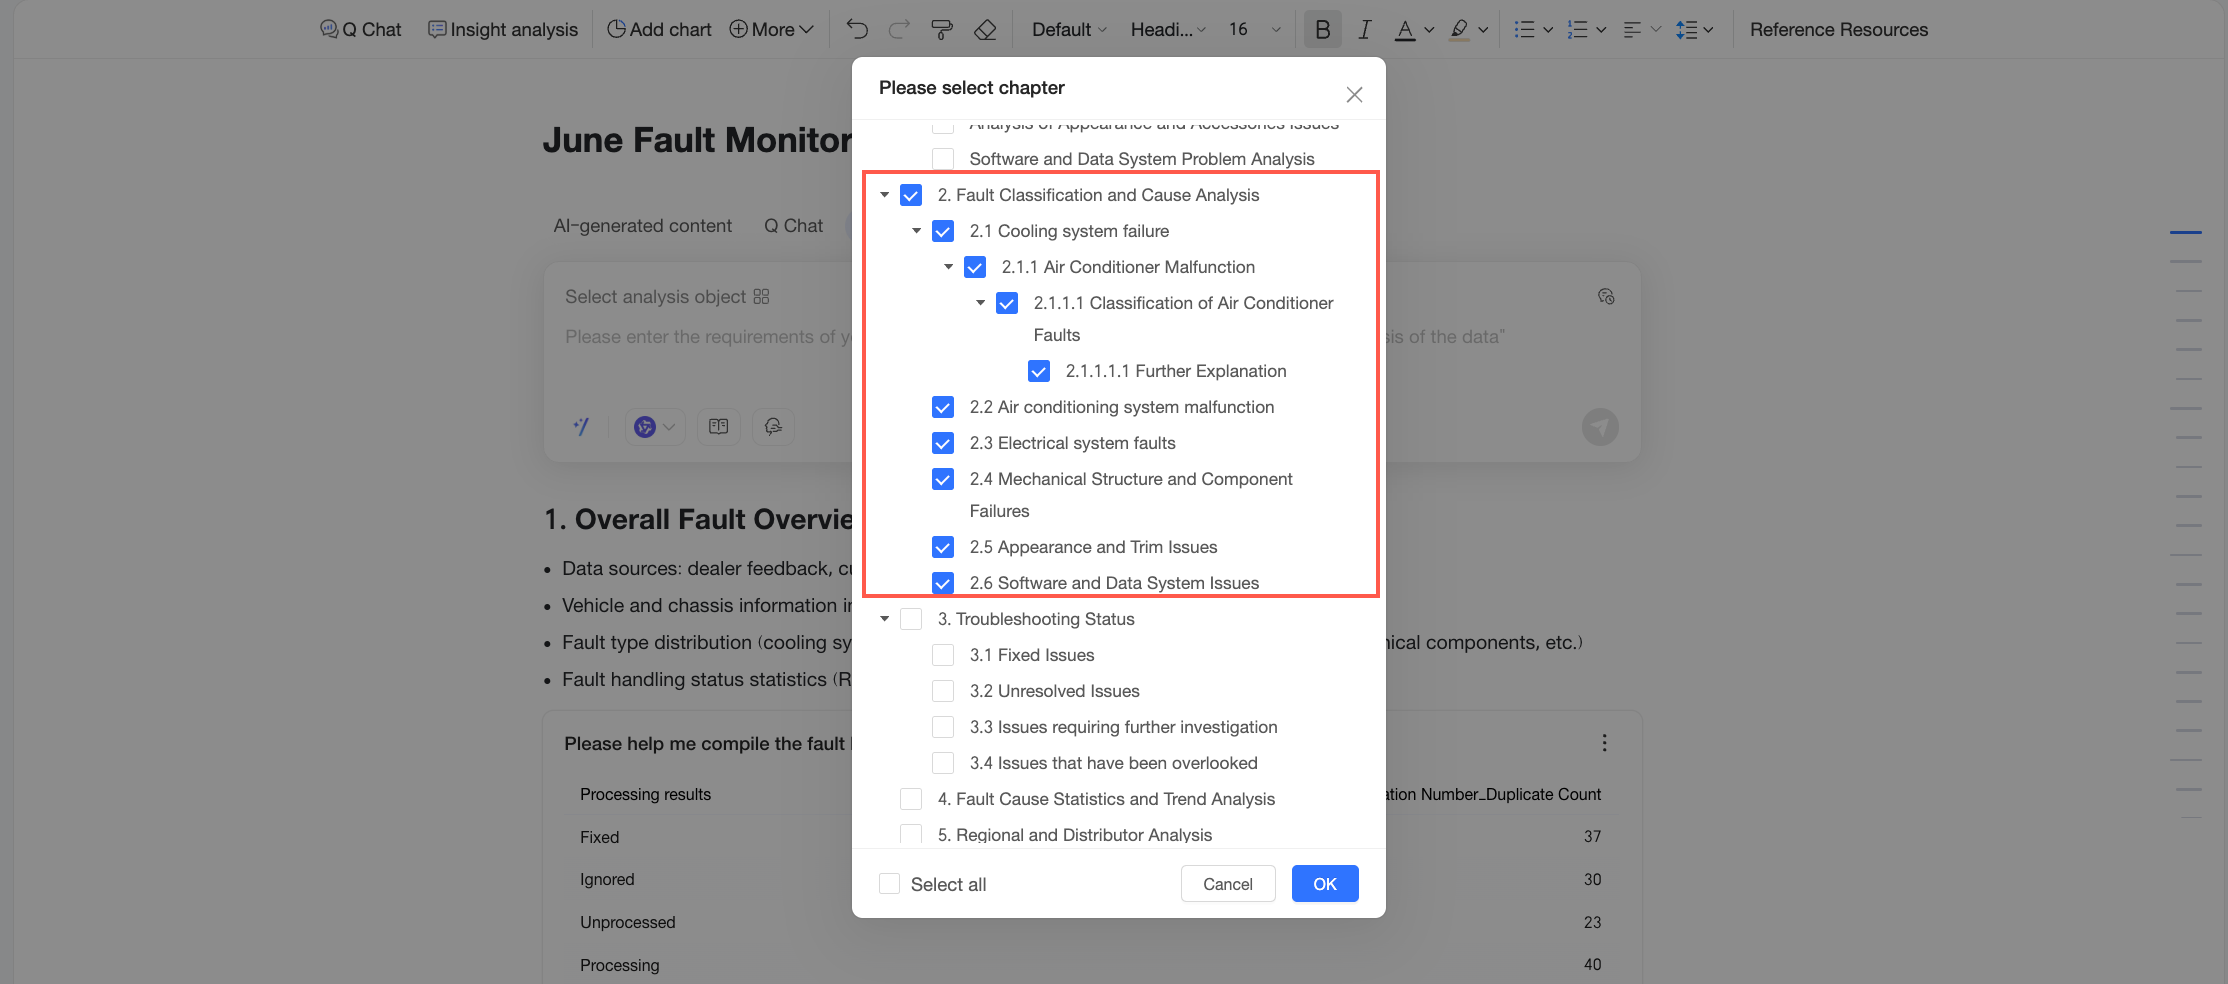
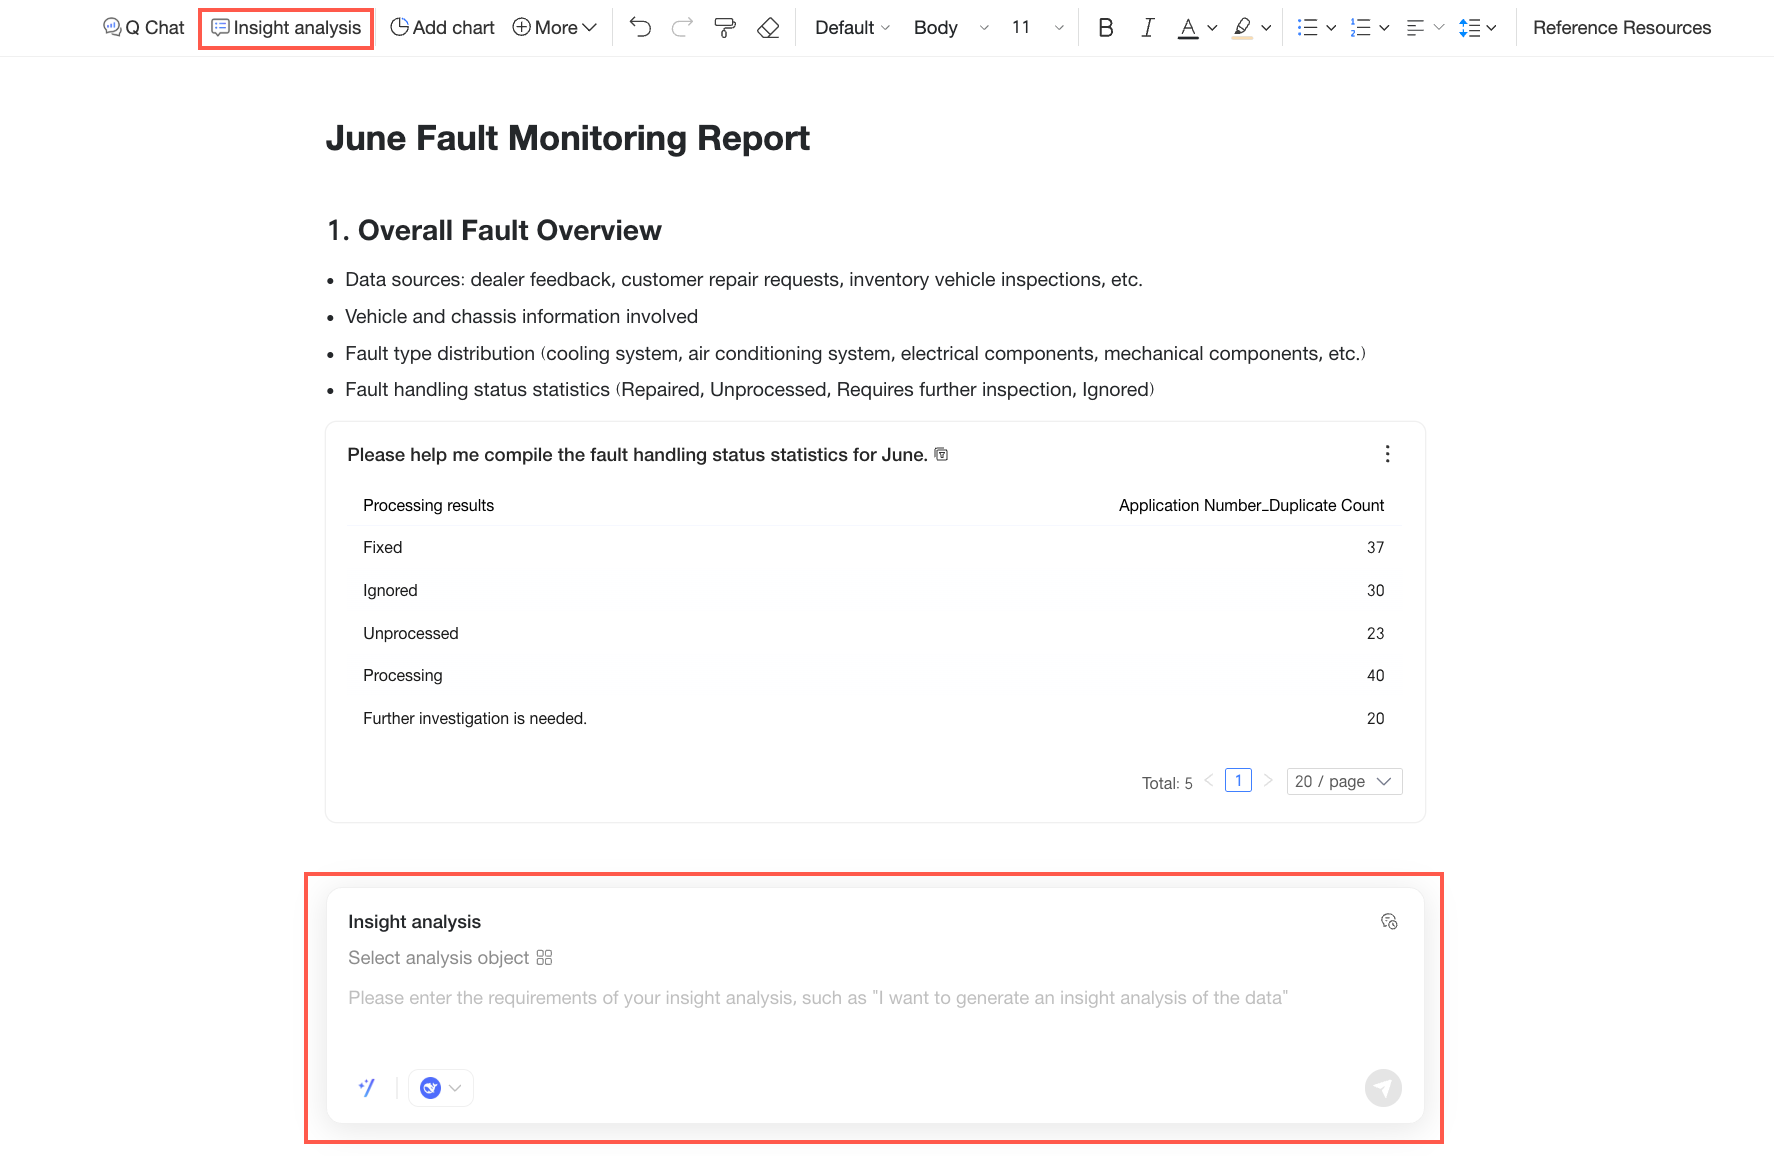 After inserting a chart, if you need to summarize an entire chapter, you can use insight analysis and select This report chapter as the analysis object.
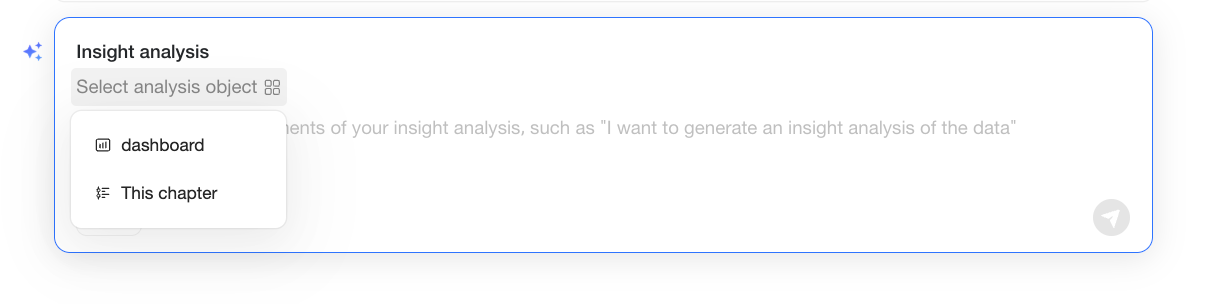
In this example, the following chapter is selected for insight analysis.
In the Insight Analysis dialog box, you can perform the following operations.
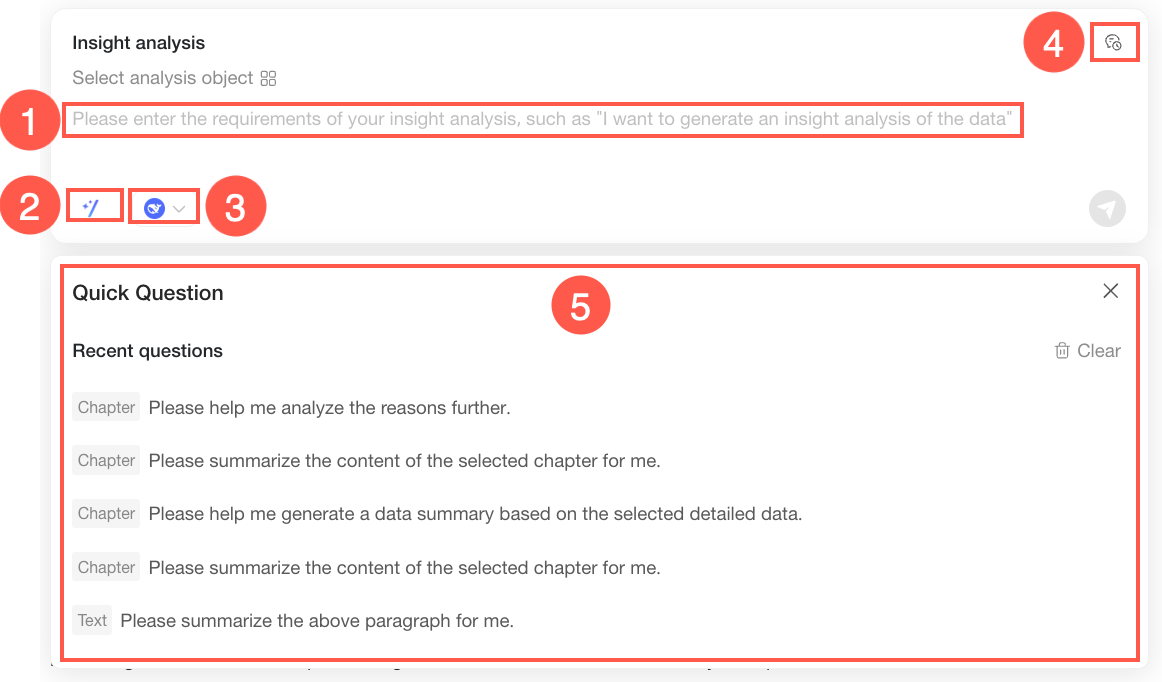
Actions
Description
① Enter summary requirements
Enter your requirements for the summary based on your analysis needs.
② Start Quick Question
Click the
 icon to open the Quick Question dialog box (⑤), which displays the last five questions asked. You can select a question to quickly ask it again.
③ Select large model
Select an appropriate large model based on your needs.
④ View generation history
If you have a generated result and want to compare it with previous versions, or if you want to use a previous result as a reference to refine your prompt, click the
 icon. The Generation History pane on the right displays the last five insight analysis records for the current report.
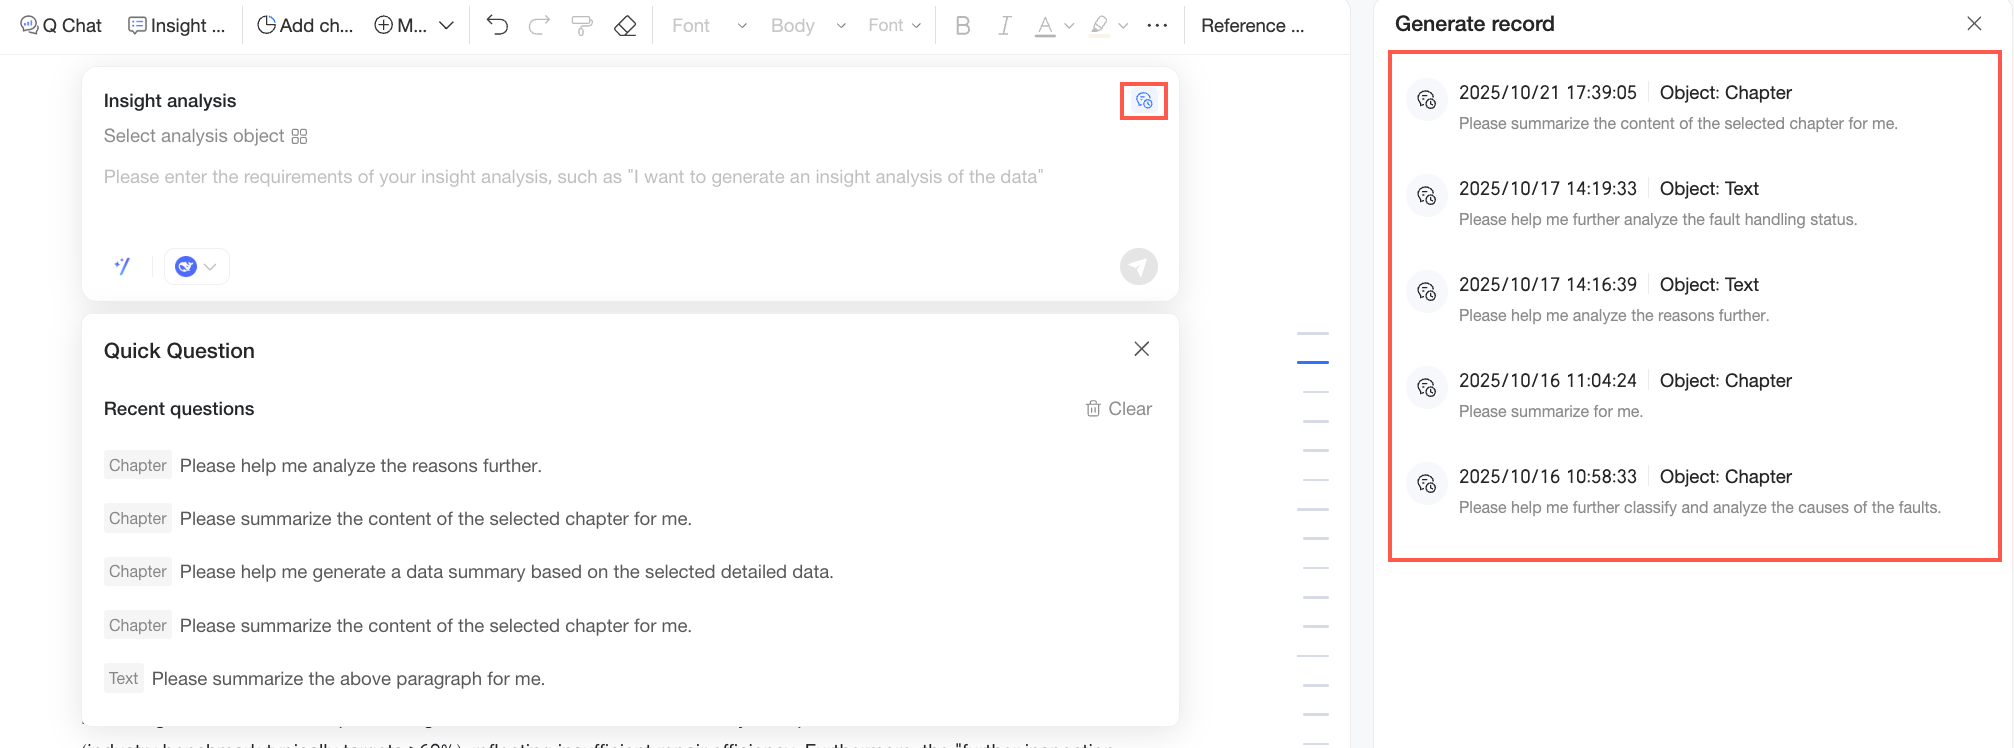
You can hover over a generation record and perform the following operations:
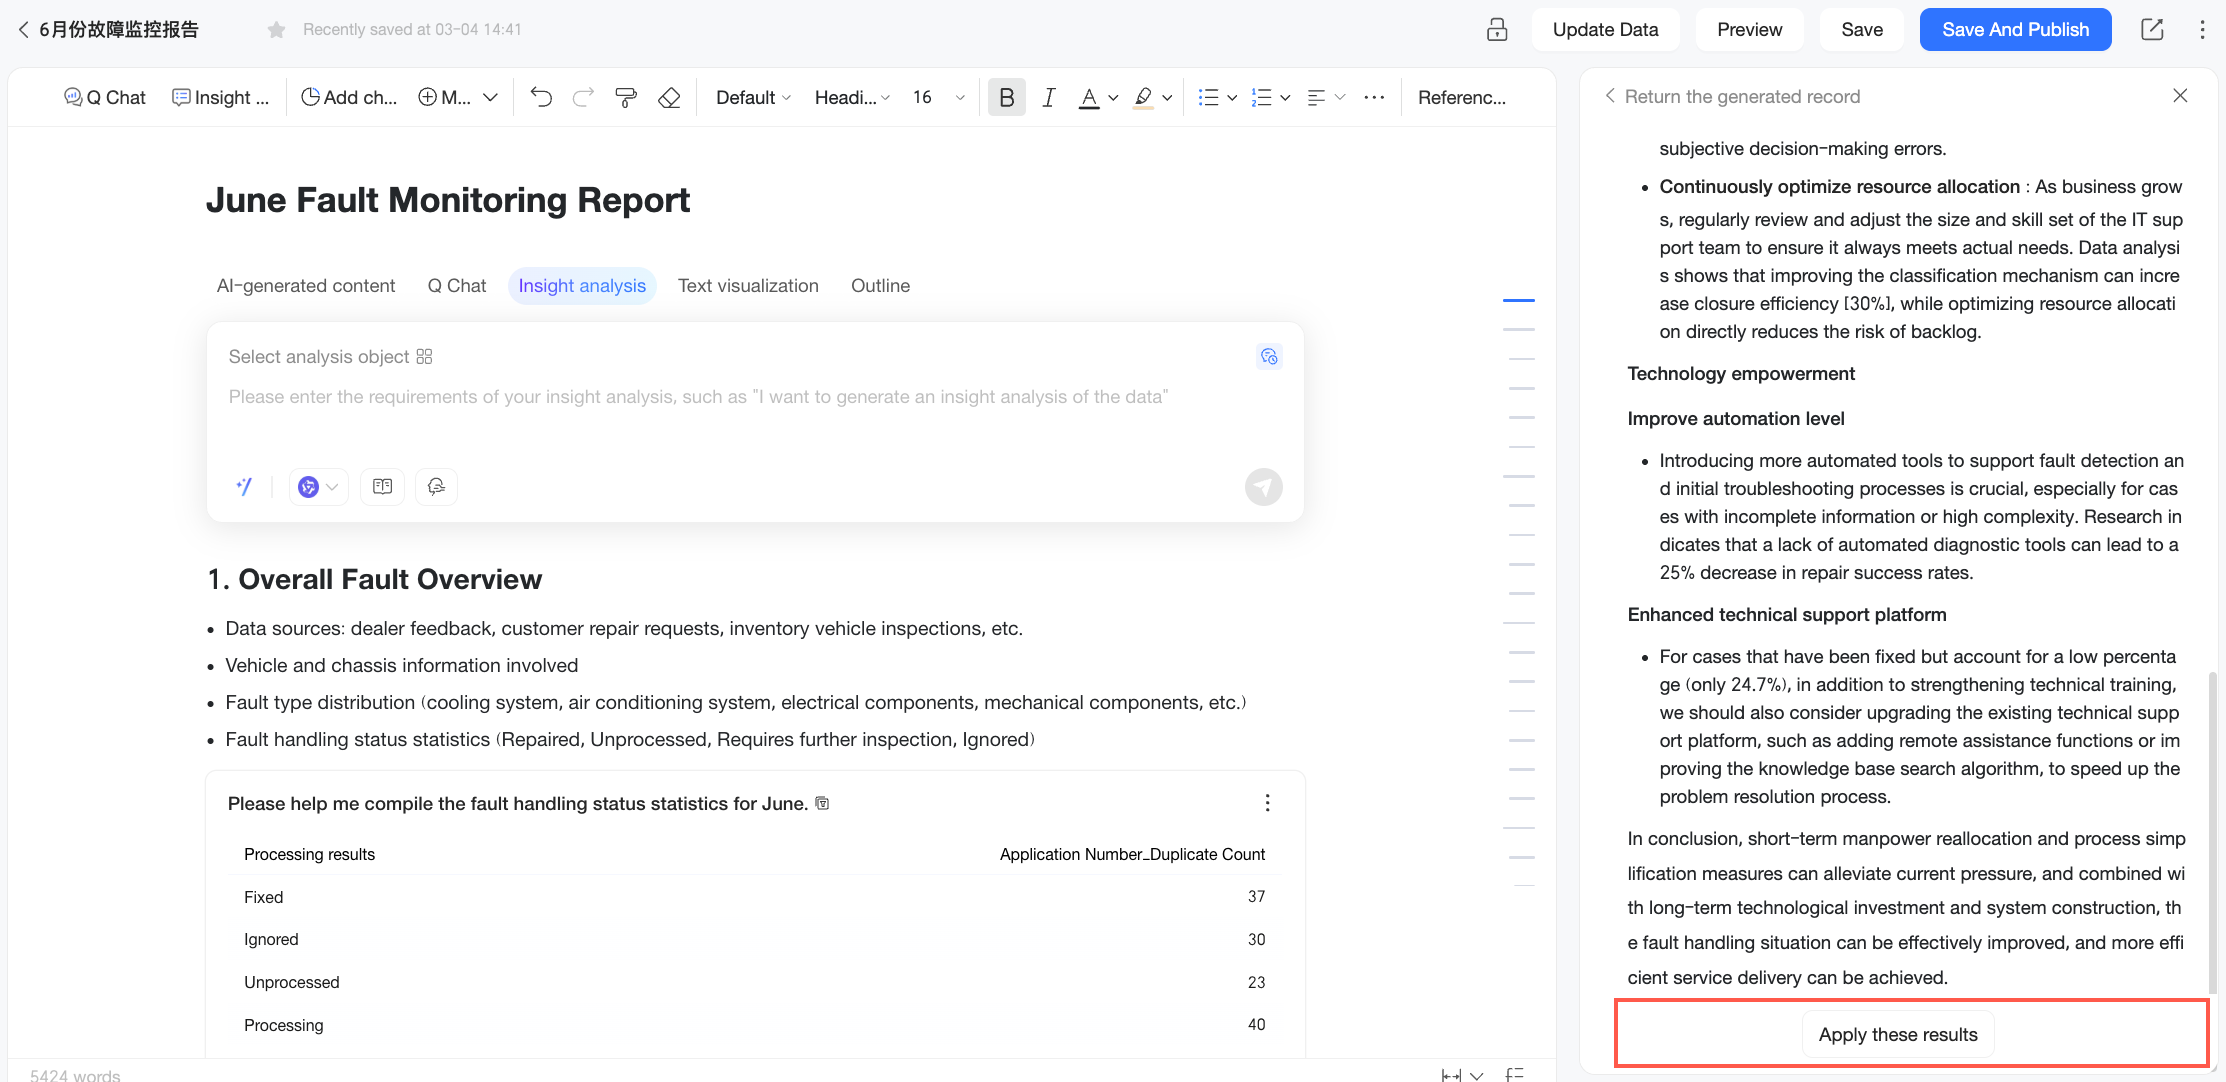
Click View Record. The pane on the right switches to the details of that record. You can then compare the current generated result on the left with the historical result. Click the
 icon to expand and view the detailed execution process of the historical result.
To apply the historical result to your report, click Apply This Result.
NoteIf the content in the generation record is a dynamic result (meaning the analysis object was a chapter selection or chart), you must confirm whether to use a static application or a dynamic application in the prompt.
Static application: The result is saved as fixed text. Subsequent data updates to the report do not affect the applied result.
Dynamic application: The result updates dynamically with the analysis object. When you update the data in the report, the analysis result can be regenerated based on the latest content.
If the content in the generation record is a static result (meaning the analysis object was highlighted text), the application defaults to a static application without requiring confirmation.
If the analysis object in the generation record is different from the currently selected one, you need to confirm whether to apply it.
Click Copy Prompt to quickly copy the prompt used for that generation record.
Click Delete to remove the generation record.
Click the
icon in the lower-right corner or press Enter to get the insight result.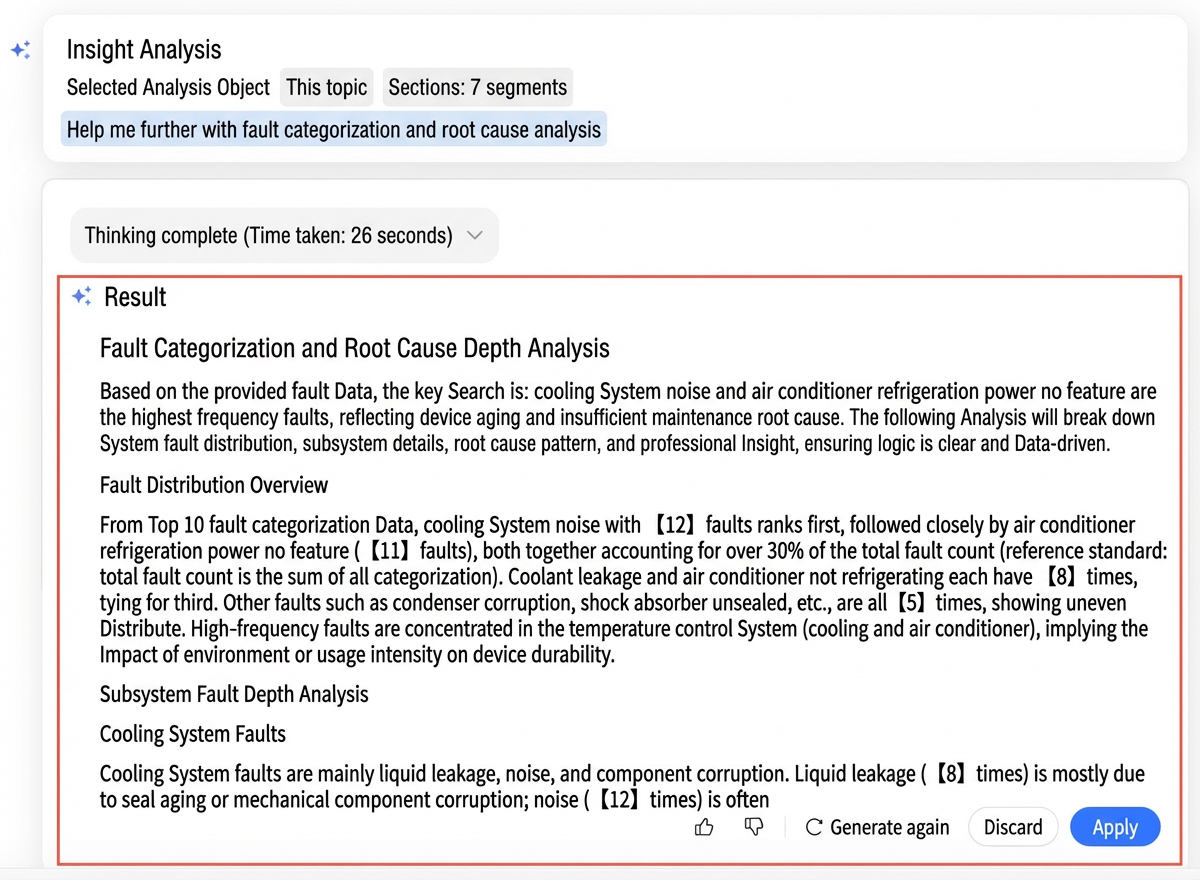
Below the generated insight analysis result, you can perform the following operations: Like, Dislike, Regenerate, Discard, and Apply.
Actions
Description
Like, dislike
Use Like or Dislike to rate your satisfaction with the result and help optimize the model's output quality.
Regenerate
The system immediately regenerates an analysis result based on the same analysis object and prompt.
Discard
Discards the current result.
Apply
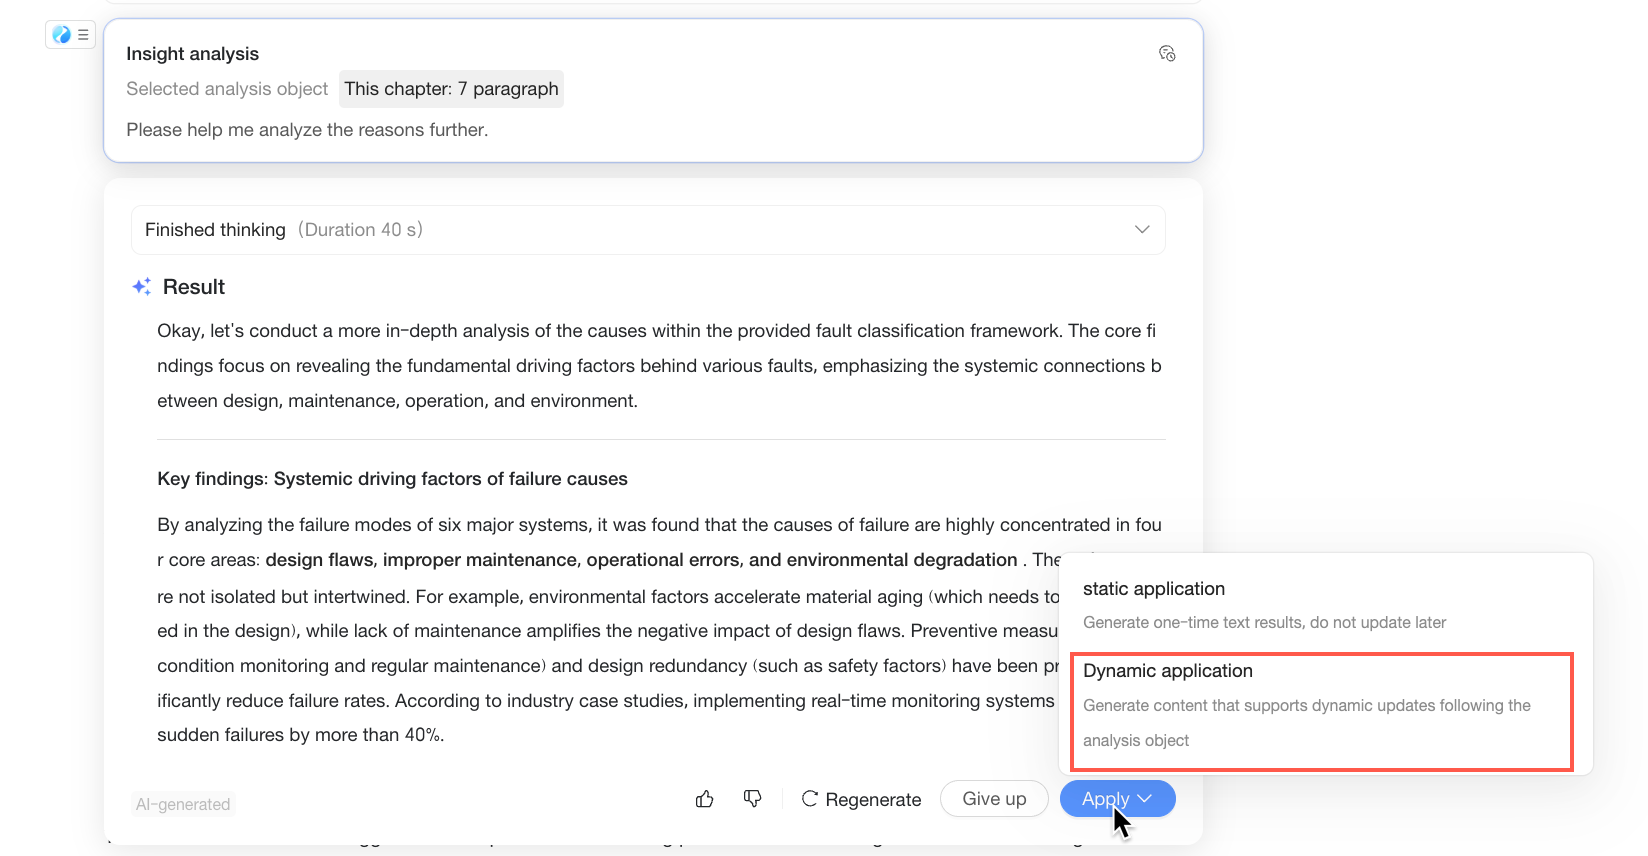
Click Apply to add the current result to the report. The type of result and available application methods depend on the analysis object:
When the analysis object is a chart component from a dashboard, the result is dynamic content, and it defaults to a dynamic application.
When the analysis object is highlighted text, the result is static content, and it defaults to a static application.
When the analysis object is a chapter of the report, the result is dynamic content, and you can choose either dynamic or static application.
For the fault report in this topic, the analysis object for insight analysis is a chapter, so the result is dynamic. When applying the result, you need to choose an application method in the prompt.
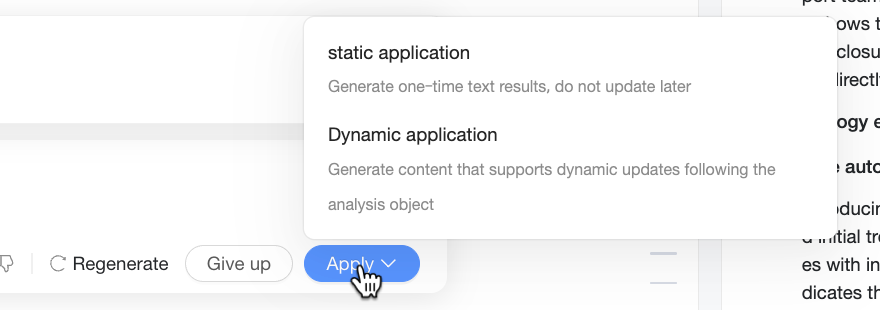
If you choose Static Application, the result is saved as fixed text. Subsequent data updates to the report will not affect the applied result.
If you choose Dynamic Application, the result updates dynamically with the analysis object. When you update the data in the report, the analysis result can be regenerated based on the latest content.
ImportantDynamic application is not supported in the following cases:
There is a dynamic dependency where a subsequent insight analysis is based on a previous dynamic result. For example, Chapter A is generated from a chart insight, dynamic result Chapter B is generated from a Chapter A insight, and then Chapter C is generated from a Chapter B insight.
If the dynamic dependency chain exceeds three levels, it can cause long update times or inaccurate content, so dynamic application is not supported.
A circular dependency exists among chapters. For example, Chapter A influences Chapter B, Chapter B influences Chapter C, and Chapter C in turn influences Chapter A.
This circular dependency prevents the system from determining the execution order during data updates, so dynamic application is not supported.
When the generated insight analysis result meets your expectations, click Apply to add it to the Quick BI report.
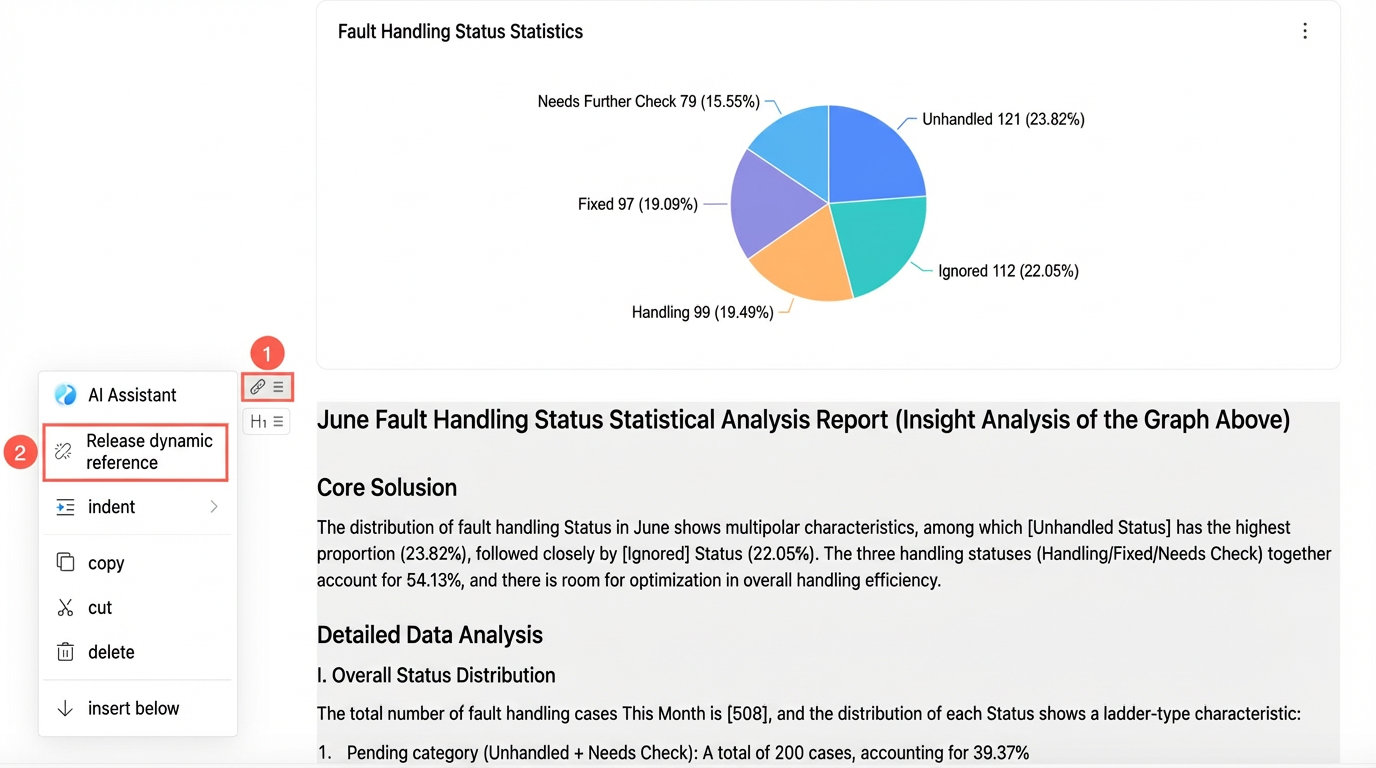
To update the insight analysis result, click the Update Data button in the navigation bar. Content with a dynamic data reference in the report will be updated. The update method for insight analysis varies depending on the analysis object:
When the analysis object is a chart component, the insight analysis result updates along with the chart.
If you need to fix the insight analysis result, you can remove dynamic reference. The insight analysis content will then no longer update with the chart.
When the analysis object is this report chapter and you chose Dynamic Application when applying the result, dynamic updates are supported.
If you chose Static Application, dynamic updates are not supported.
When the analysis object is highlighted text, the result is static content and does not support dynamic updates.
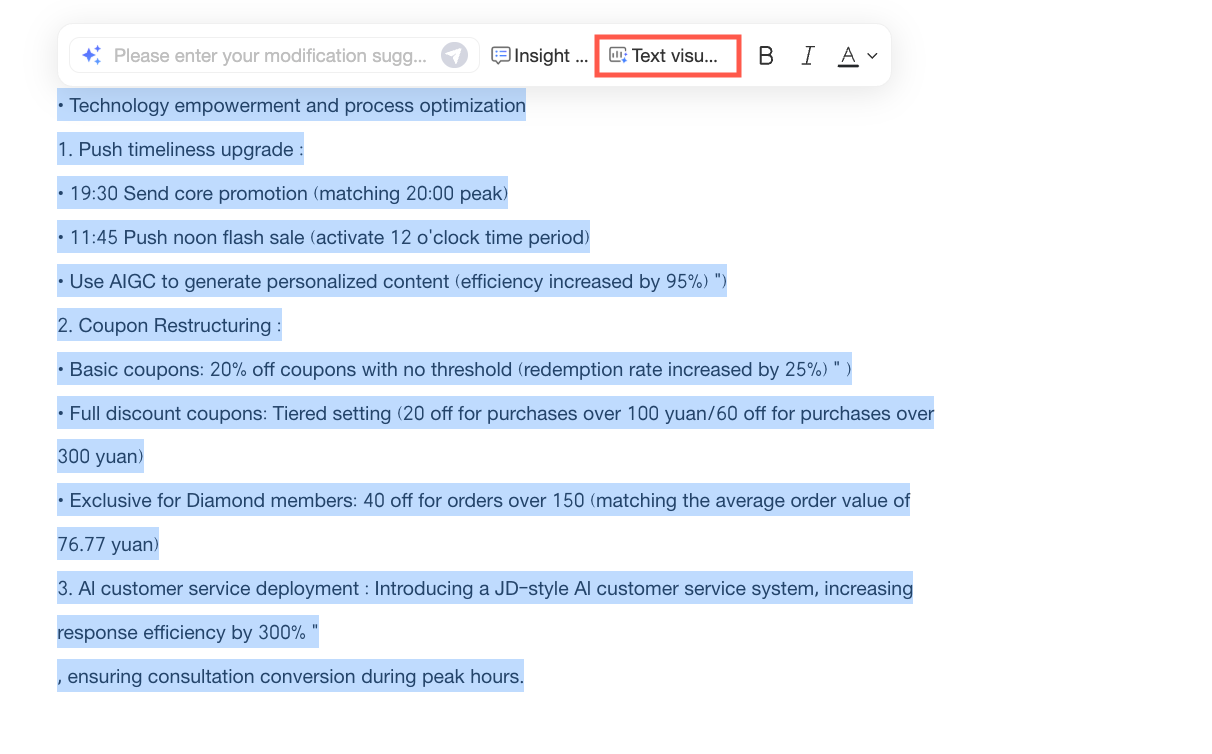
Text Visualization
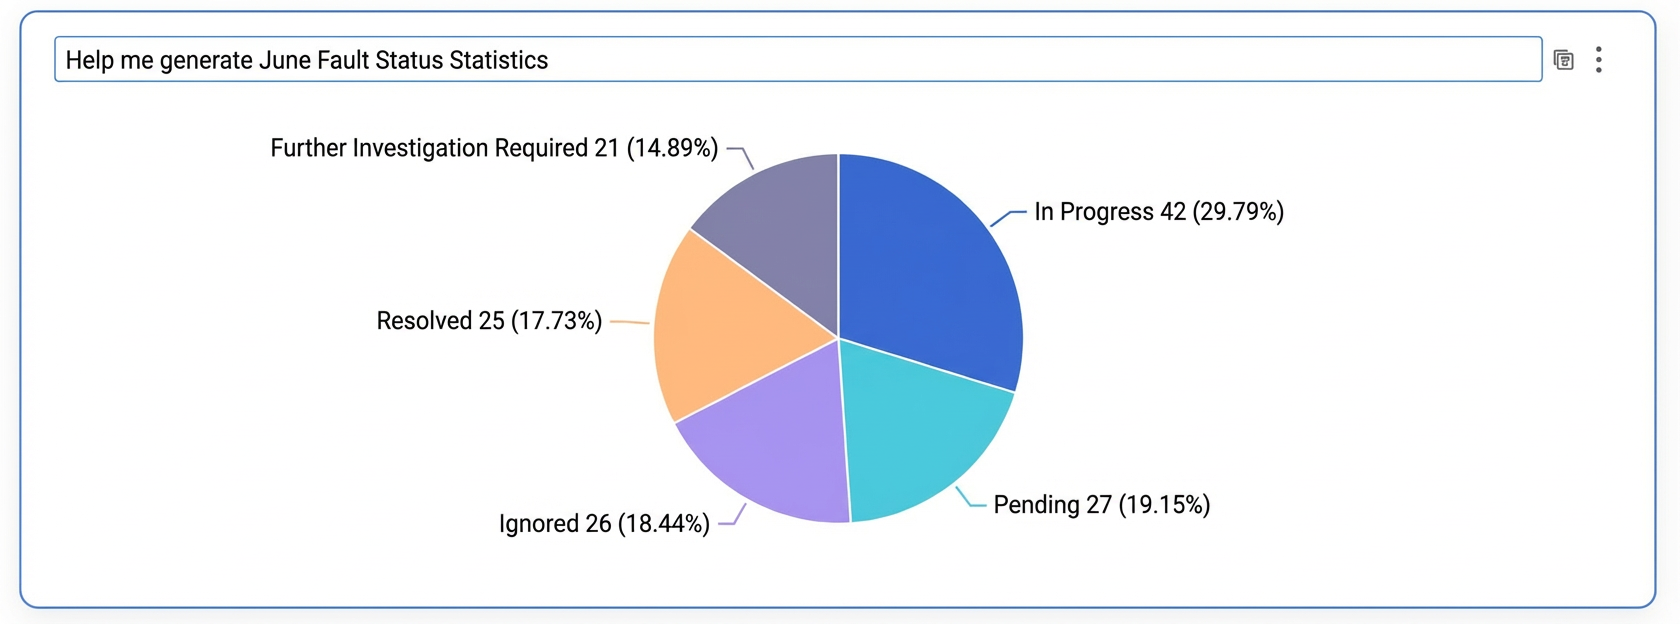
Besides using chart components from a dashboard, you can generate charts directly from text. This is useful when you have already analyzed the text content and want to display the results more intuitively, for example, by converting text from an analysis outline into a chart. Follow these steps:
Select the text that you want to visualize, and then click the Text Visualization button in the toolbar that appears.
Alternatively, you can first open the AI assistant, select Text Visualization, and then enter the content you want to generate.
A chart is generated based on the selected text.
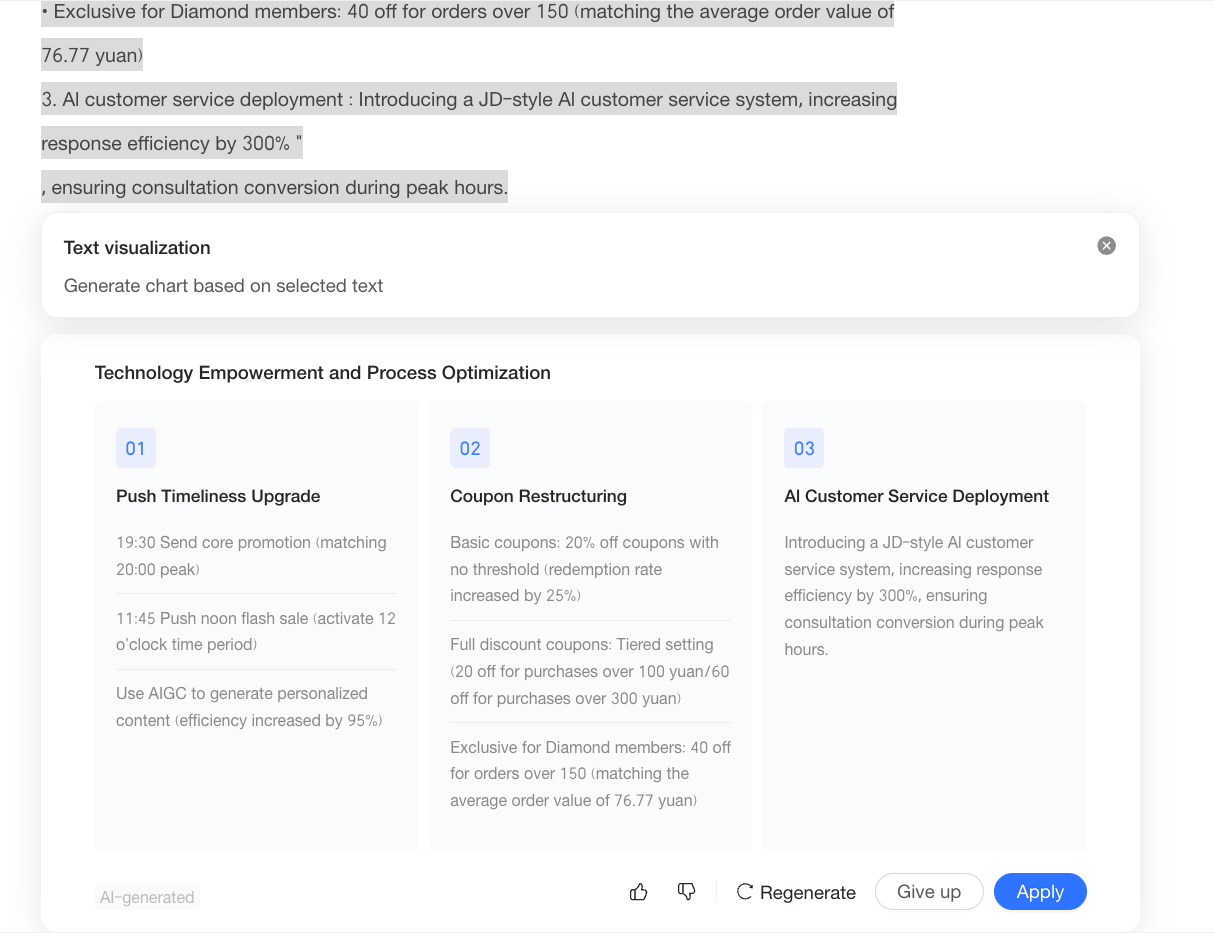
Below the generated chart, you can perform the following operations: Like/Dislike, Regenerate, Discard, and Apply.
When the generated text visualization result meets your expectations, click Apply to add it to the Quick BI report.
Example
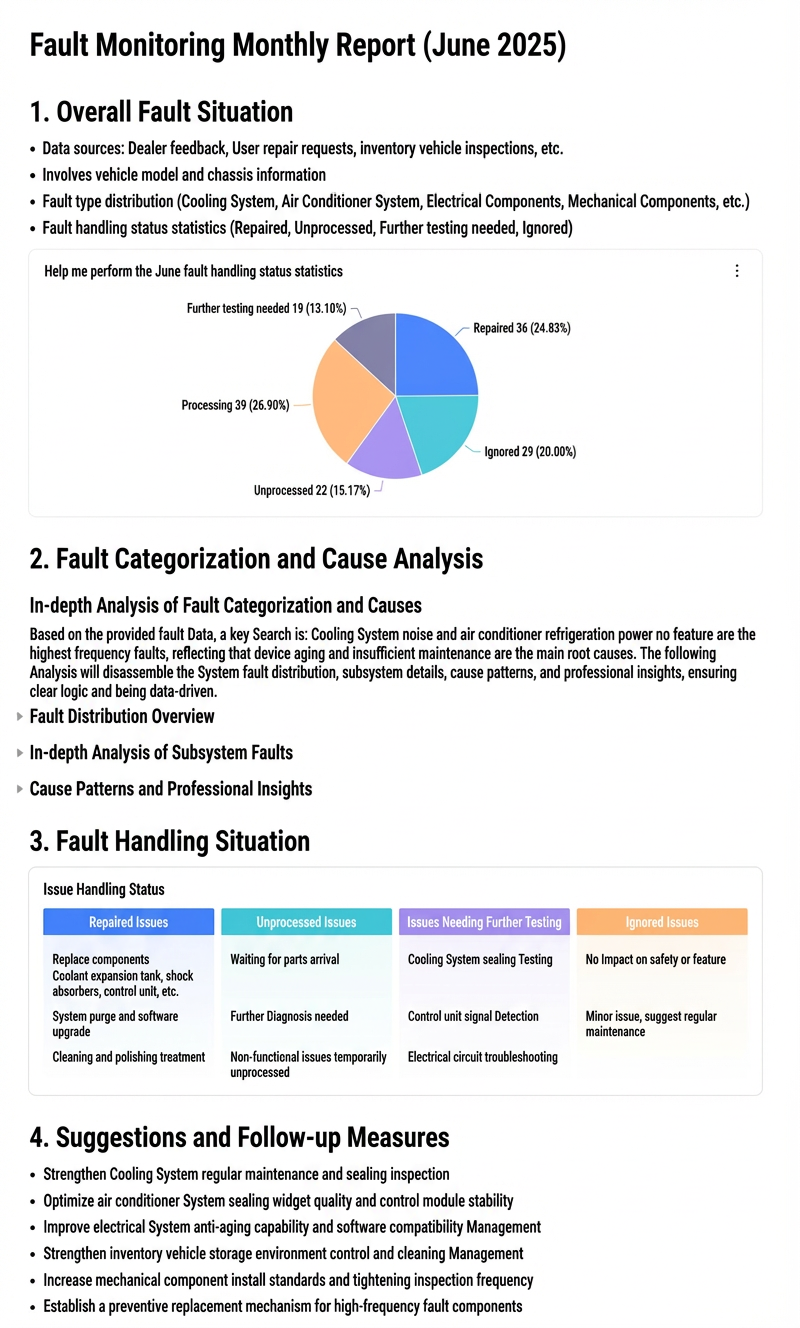
A basic Quick BI report is now complete. The following figure shows the result.
Next Steps
To add dashboard charts to a Quick BI report, see Add dashboard charts.
To configure the style of a Quick BI report, see Style configuration.